
Core Themes
Data Science Campus work focuses on a number of core themes:
Read more on Core Themes Data Science Campus work focuses on a number of core themes:
Read more on Core Themes
We have explored the feasibility of using open data to analyse local transport performance. In this publication we demonstrate how to produce hyperlocal bus service coverage and punctuality metrics.
Read more on Bus reliability – analysing the morning travel peak across England
Using data science and automation in the production of price statistics
Read more on Transformation in the Ghana Statistical Service
Synthetic data are artificially generated data that are made to resemble real-world, often sensitive, data.
Read more on Enabling Data Access through Privacy Preserving Synthetic Data
This report offers a thorough look into how we created a synthetic version of a large, linked, and confidential dataset while adhering to a formal privacy framework
Read more on Synthesising the linked 2011 Census and deaths dataset while preserving its confidentiality
We are planning to follow up on previous work we published earlier this year looking at public transport availability across the UK, by providing metrics for urban centres across the UK, as well as their international counterparts.
Read more on Comparing international transport performance in urban centres: upcoming work
In this guest blog, 10DS data science fellows Federico and Robin, talk about working with the Campus to create packages that import, process and visualise DfT’s journey time statistics data.
Read more on Guest blog: Enhancing open-access data analysis: introducing the Journey Time Statistics R and Python packages
We go behind our analysis on the use of microdata for the examination of preference tariff utilisation and take a deep dive into challenges of drawing together new administrative data sources to answer relevant policy questions.
Read more on The use of microdata for firm-level analysis of preference tariff utilisation in the UK: technical report
We show how shipping instructions can be used to map the trade routes of critical goods. This will help understand our reliance on global ports for accessing specific products, and draw insights on the impact of important events such as strikes.
Read more on Using new shipping data to improve government understanding of trade flows
We have published data to help researchers and local planners understand how public transport access varies across the UK, using open data and open-source software.
Read more on Using open data to understand hyperlocal differences in UK public transport availability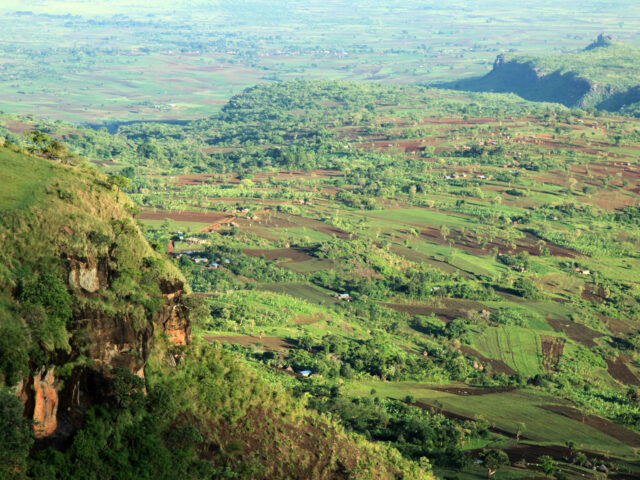
We used machine learning to develop a model to identify areas of trees from satellite images in eastern Uganda, where the Mbale Trees Programme has been running since 2010.
Read more on Using Sentinel-2 images to measure the change in tree coverage in eastern Uganda: what does it mean for the Mbale Trees Programme?
The Campus has delivered a suite of tools and code to North of Tyne Combined Authority (NTCA) to support their work to prioritise broadband infrastructure improvements in the region.
Read more on Using data science to help inform regional broadband investment
In this guest blog, data science apprentice Evie Brown from the Social Care Analysis team at the Office for National Statistics (ONS) presents work on grouping online job adverts by social care role. This project was a significant part of the final year of the Level Six Data Science Apprenticeship.
Read more on Identifying different roles in the social care sector using online job advertisements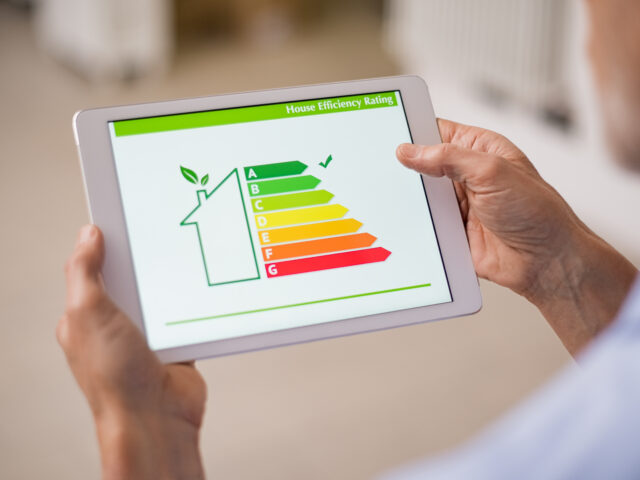
The Department for Business, Energy and Industrial Strategy (BEIS) asked the Campus to see if machine learning techniques could be used to predict the energy efficiency of properties that do not have an official score. Read more about our findings on this blog post.
Read more on Predicting the Energy Performance Certificates (EPC) of properties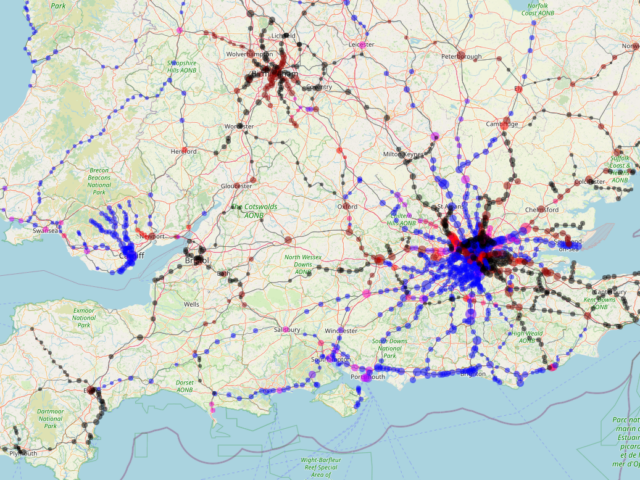
Rail services can be affected by temporary factors such as unseasonably hot weather, industrial action and engineering works. We produced maps from open data showing service levels at every station in Great Britain over a 21-day period.
Read more on Visualising rail schedules using open data
Data synthesis is an active area of research for many organisations, including the Office for National Statistics (ONS). SynthGauge is a Python library that provides decision-makers with a range of metrics and visualisations for evaluating synthetic data.
Read more on Evaluating synthetic data using SynthGauge
To support the national fight against coronavirus (COVID-19) in March 2020, BT made aggregate, anonymised mobility data available to the UK Government. We quickly turned this into daily updates, with only one day’s delay between activity and the reporting of it.
Read more on Case study: responding to the coronavirus pandemic using aggregated BT mobility data
Understanding and monitoring the major influences on COVID-19 infection numbers in communities is essential to inform policy making and evaluate the impact of non-pharmaceutical interventions. We have developed a community-level analysis by assembling a large set of static and dynamic data for England.
Read more on Use of hybrid data to understand the community-level influences on coronavirus (COVID-19) incidence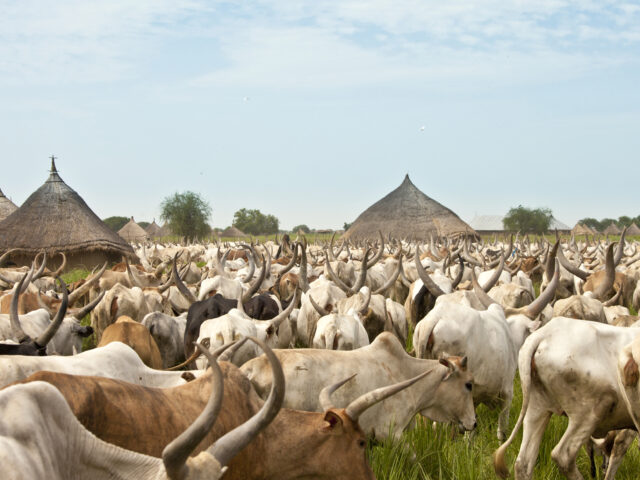
Cattle are central to many people’s livelihoods in South Sudan, but there are very few recent data on the number of animals and their geographic distribution. Building on previous work, this blog explores new methods, based on convolutional neural networks, that can better distinguish cattle camps from similar landscape features.
Read more on Technical report: Predicting cattle camp locations in South Sudan from Sentinel 2 satellite imagery
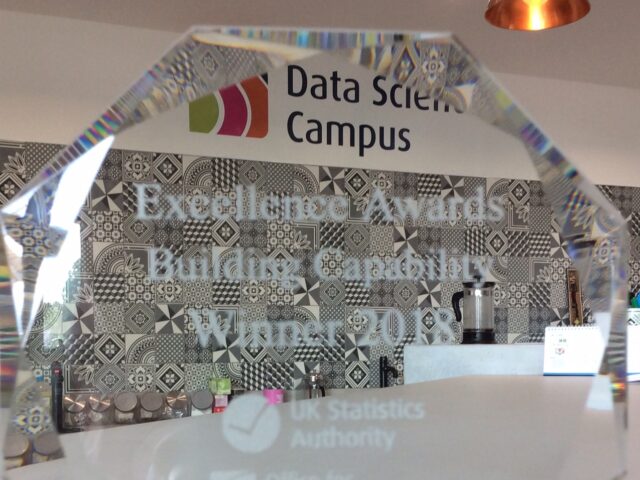
On 27 March 2017, with an audience of UK and international data science leaders from across the public, private and academic sectors, a team of 8, some brilliant presentations, and a lot of excitement, the Data Science Campus was launched. 5 years later, Louisa Nolan shares what have we learned along the way.
Read more on The Data Science Campus – five years of data science for public good
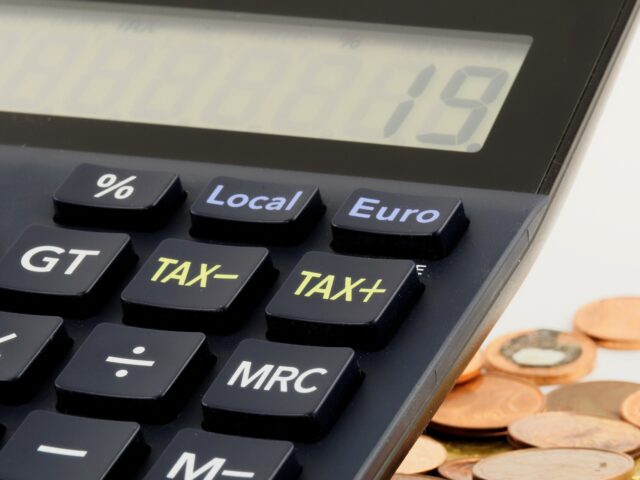
Preference utilisation rates (PURs) measure the extent to which UK businesses make use of the zero or reduced tariffs available via free trade agreements (FTAs). In this work, we study the take-up of preferential tariffs by UK businesses between 2009 and 2019 and examine their trends and patterns.
Read more on Employing data science to analyse the use of preferential tariffs in free trade agreements
Part of our mission at the Data Science Campus (DSC) is to build data science capability across the public sector. In this project, which grew out of our Data Science Accelerator programme, we worked with the Royal Air Force (RAF) to help upskill their staff in the Python programming language and natural language processing (NLP) methods.
Read more on Technical Report: Project Mertz—novel use of historical RAF flight safety records
We have released a new version of our open codebase to enable the Traffic Cameras project to run on a single, stand-alone laptop as well as on Google Cloud Platform, making it more accessible to users without cloud infrastructure.
Read more on Estimating vehicle and pedestrian activity from town and city traffic cameras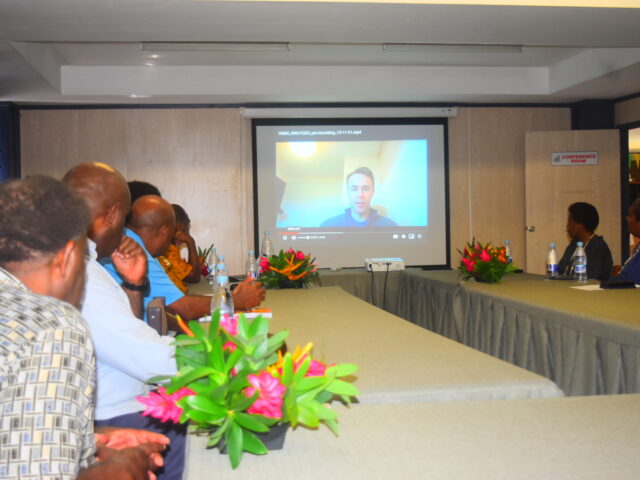
Our FCDO hub’s mentorship model has helped countries, including Rwanda and Vanuatu, deliver in-house data science projects with significant impact, while also creating a flourishing sustainable ecosystem of data scientists.
Read more on Making an international impact with data science mentoring
This report summarises our work to meet widespread demand for better automated and higher quality solutions to this problem, by using machine learning (ML) methods to improve the match rate and accuracy of automatic classification of SIC and SOC classifications.
Read more on Automated coding of Standard Industrial and Occupational Classifications (SIC/SOC)
In this guest blog, Robyn Hunt from the ONS travel and tourism review team looks at using mobility data to model estimates from the International Passenger Survey.
Read more on Using Mobile Phone Data for Enhancing International Passenger Survey Traveller Statistics
Many countries in the developing world lack regular estimates of road traffic activity. To address this, we applied machine learning techniques to open-source satellite data to generate estimates of traffic volume in Kenya, East Africa.
Read more on Detecting Trucks in East Africa
In this report, we talk about our use of novel machine and deep learning techniques to explore changes in population behaviour and well-being during the coronavirus pandemic.
Read more on Using data science to explore changes in behaviour and well-being during the coronavirus (COVID-19) pandemic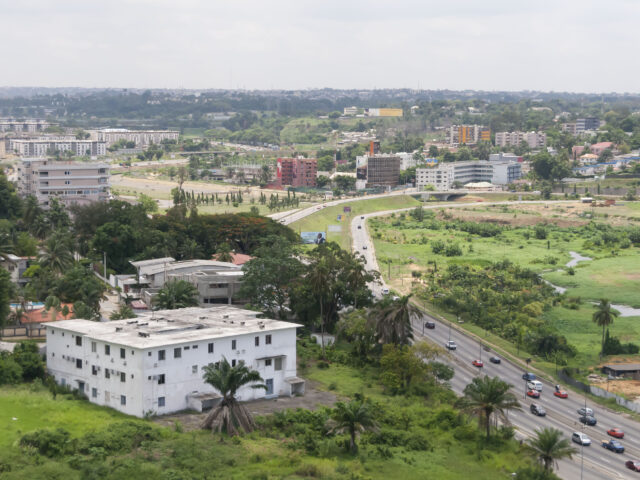
We have been exploring if machine learning methods and publicly available spatial datasets can be used to map and understand HIV risk in Cote d’Ivoire, West Africa.
Read more on Mapping HIV risk in Côte d’Ivoire, West Africa
We have been exploring Facebook data to understand changing patterns of mobility and the impact of lockdown restrictions.
Read more on Using Facebook data to understand changing mobility patterns
This blog outlines some of the work the Campus has been doing, bringing our skills together with new data sources to help inform responses to the coronavirus (COVID-19) pandemic.
Read more on Understanding mobility during the COVID-19 pandemic
A report on the quality and methodology of data used to produce extent and change of surface water statistics for reporting on Sustainable Development Goals indicator 6.6.1 for the UK.
Read more on Quality and methodology: Extent and change of surface water statistics
In this blog, we describe how we have assessed the quality of the novel Global Surface Water Explorer (GSWE) dataset to better understand its value and fitness-for-purpose, producing data to report the UK’s position on indicator 6.6.1.
Read more on Using satellite imagery to report changes to water bodies for SDG 6.6.1
We used text data from over 500,000 business websites to inform survey response-chasing efforts and gain insights into the impact of COVID-19.
Read more on Extracting text data from business website COVID-19 notices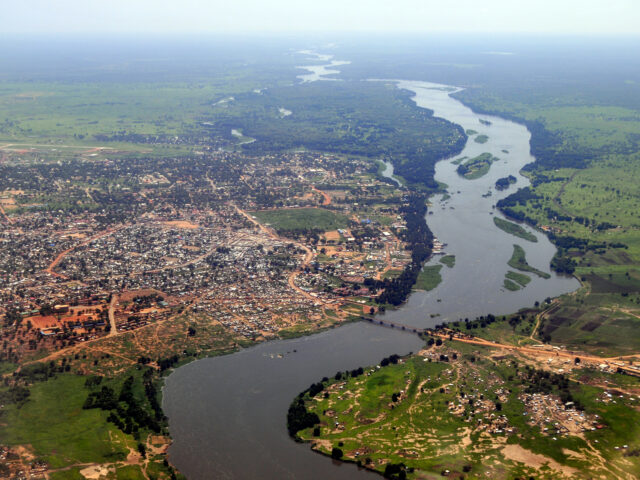
On World Statistics Day 2020, our ONS FCDO Data Science Hub talk about exploring the use of satellite imagery to conduct a cattle census in South Sudan.
Read more on Counting cows in South Sudan
The latest update on our work with Barclays exploring if aggregated and anonymised card transactions data could provide significantly quicker, more granular insight into UK consumer spending.
Read more on Payments Data for Public Good
Large volumes of unstructured, free-text data such as patent applications, contain potentially valuable information for policymakers. Here we describe the pipeline used to process such data sources.
Read more on pyGrams: An open source tool for discovering emerging terminology in large text datasets
In this report, we focus primarily on how the pyGrams tool can be used to analyse terms through time using the time stamps in document metadata.
Read more on Discovering emerging important terminology in large text datasets using pyGrams: a comparison between net growth and e-score methods
We introduce pyGrams – a new Python tool for extracting, visualising and identifying emerging terms in large document collections, such as patents.
Read more on Extracting, visualising and identifying emerging important terminology from patent collections
We are exploring new data sources such as Google’s Community Mobility Reports to strengthen the information that we have through surveys and other sources.
Read more on Supporting the response to coronavirus (COVID-19)
Our latest project investigates the use of machine learning techniques to predict missing energy performance scores. It also attempts to create a complete picture of the energy efficiency profile for domestic properties in Wales.
Read more on Can machine learning be used to predict energy performance scores?
This article summarises further development we have carried out to improve the timeliness and relevance of the shipping indicators, in response to feedback from our users.
Read more on Faster indicators of UK economic activity: more timely and relevant shipping indicators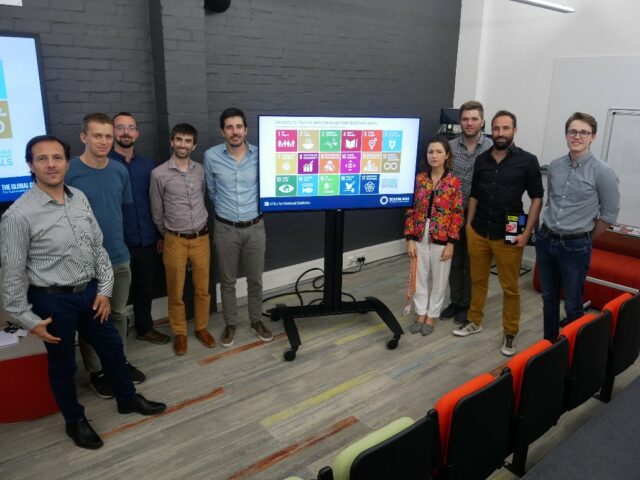
How data science is helping to address the challenge of measuring the Sustainable Development goals in the UK.
Read more on Data science for sustainable development
Extracting social-economic signals from internet traffic data.
Read more on What can internet use tell us about our society and the economy?
Improving the current approach to identifying the proportion of vegetation for urban residential gardens in Great Britain.
Read more on Green spaces in residential gardens

So, June was notable for (i) more uninterrupted sunshine than I can remember in the UK; (ii) the short-lived excitement…
Read more on The month that was – June 2018
Where do the days go? It’s already time for my latest update – providing an overview of what happened in the…
Read more on The month that was – May 2018
Here’s the latest “monthly” update for the Data Science Campus, covering both March and April 2018. We took a break…
Read more on The months that were – March and April 2018
Here’s our latest monthly update for the Data Science Campus, covering February 2018. We’ve taken the liberty of stretching the…
Read more on The month that was – February 2018 (plus a bit)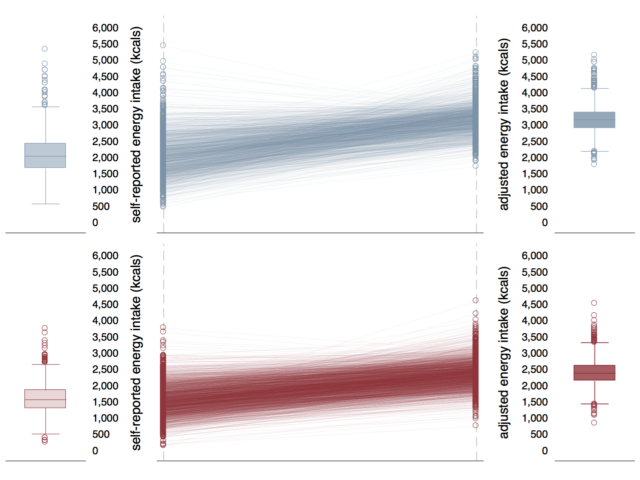
1. Executive Summary The Evaluating Calorie Intake for Population Statistical Estimates (ECLIPSE) project was carried out by the Data Science…
Read more on Evaluating Calorie Intake Following a brief midwinter break, here is our bumper two-month update, covering December 2017 and January 2018. The Campus continues…
Read more on The months that were – December 2017 and January 2018
Here’s our update for November, the month when the Campus won an award and had the privilege of welcoming numerous…
Read more on The month that was – November 2017Using doubly labelled water to improve our understanding of the UK’s calorie intake. The problem We’re not very good at…
Read more on How much is the UK eating?
This is our monthly update for October 2017 – one of a series of regular snapshots that highlight some of…
Read more on The month that was – October 2017
This is our monthly update for September – one of a series of regular snapshots on what we’ve been doing…
Read more on The month that was – September 2017
Welcome to “the month that was”, providing you with a snapshot of what we’ve been doing this month to support…
Read more on The month that was – August 2017Welcome to the first of our monthly updates – a regular snapshot on what we’ve been doing to support data…
Read more on The month that was – July 2017
It is 100 days since the Data Science Campus officially opened our doors to help the Office for National Statistics…
Read more on The first 100 days
The Office for National Statistics (ONS) is on a fantastic journey to better serve the UK by improving the quality…
Read more on Building and stocking the survey question libraryThe Office for National Statistics (ONS) Data Science Campus is keen to collaborate with partner organisations both in the UK…
Read more on Collaborating with Statistics Netherlands towards a data driven society
Urban forest refers to the trees and vegetation present in the streets, parks, gardens, balconies and even green roofs within…
Read more on Mapping the urban forest
The Data Science Campus celebrated a significant achievement on Monday 27 March, as it opened its doors for the first…
Read more on We are officially open for business
On 5 December 2016, the Office for National Statistics and The Alan Turing Institute signed a Memorandum of Understanding signalling their shared…
Read more on When the team met Turing