Using new shipping data to improve government understanding of trade flows
We have been supporting the Department for International Trade (DIT) in the assessment and initial analysis of an exciting new data source: shipping instructions data.
Shipping instructions (or Bill of Lading) data detail the type, quantity and destination of goods being shipped in containers. These data were procured for UK imports and exports by DIT and the Department for Transport (DfT) in 2021, with Canadian company ThinkData Works (TDW) successful in their bid through an open tender process. This was the first time that shipping instructions data had been procured by the UK government, and the purchase was supported by the Treasury’s Economic Data Innovation Fund. The ONS Data Science Campus is partly funded by DIT to support this work.
This first blog post demonstrates the uniqueness of this data source and how data science techniques are being used to determine its data quality and potential cross-government uses to understand trade.
We will show how shipping instructions can be used to map the trade routes of critical goods, understand our reliance on global ports for accessing specific products, and draw insights on the impact of important events such as strikes. By linking with automatic identification system (AIS) data, we can monitor the journey of containerised goods in near real-time. Finally, the data offer the possibility of improving our understanding of trans-shipment, where goods change ship in a port (for example, Rotterdam) on their way from origin to destination. The effect of trans-shipment on UK trade statistics can be considerable, and this is an important strand of work that the ONS Data Science Campus and DIT are researching further.
Potential added value
Shipping instructions data are recorded in a legal document between the shipper (the seller of the goods) and the carrier (who transports them across the sea) and, as such, their primary use has not been for government analysis. There has been growing interest in better understanding the type of container goods being shipped into and out of the UK. Traditional trade sources, such as customs declarations, provide robust overall import and export figures. However, shipping instructions provide additional granular detail (for instance, the products in each container) and more detailed trade flows (for instance, the route that each ship takes). Both are crucial when understanding the impact of, for example, disruptions on supply chains.
At present, marine traffic data are used by the ONS as an innovative data source to respond to the challenge of producing faster economic information. Experimental indicators using ship position data are published weekly to provide an early indication of the movement of goods into and out of the UK. However, ship position data do not provide any information on the goods carried by the ships, and they cannot follow the journey of a container that is transferred from one ship to another. Trade statistics are reported at an aggregate level, which is not sufficient to give insights into issues such as the passing of commodities through critical straits, trans-shipment activity, and supply chain issues. Linking ship position data to shipping instructions data may enable near real-time monitoring of goods carried by ships.
Data coverage
TDW have shared data from December 2019 to November 2022 under the contract they have with DIT. The dataset covers the majority of ports in the UK. Ports are geographically dispersed and tend to be specialised based on geography. For example, the South East is dominated by freight vehicles given its proximity to mainland Europe, whereas Scotland is influenced by nearby North Sea oil and fishing industries. Given that ports are essential to local economies, understanding the contribution of critical goods and ports to the economy will help port policy. The largest container ports (which this dataset relates to) are geographically spread across the UK in areas such as London, Liverpool, and Southampton. These data will therefore help us identify specific goods and trading routes that are crucial to local economies in and around ports, as an important input to policymakers’ interest in levelling up.
Container ships carry around 15% of the UK’s imports and exports by weight, and the shipping instructions dataset covers around half of the UK’s container ship trade. In particular, the data have good coverage of the largest container ports in the UK, with details of approximately 50% of containers passing through Felixstowe, London Gateway, and Southampton. These are the three largest container ports in the UK, accounting for around 70% of UK container movements.
Aggregate figures and intended uses
What the UK imports in containers
Using shipping instructions data, we are able to count how many containers carry specific types of goods, as seen for UK imports in Figure 1. Customs data can show the weight and value of different types of goods, but container counts indicate the proportion of container port traffic involved. This can be further broken down by port of origin, showing the importance of each global port to each type of UK import.
Figure 1: Shipping instructions data allows us to count the number of containers carrying specific goods into the UK
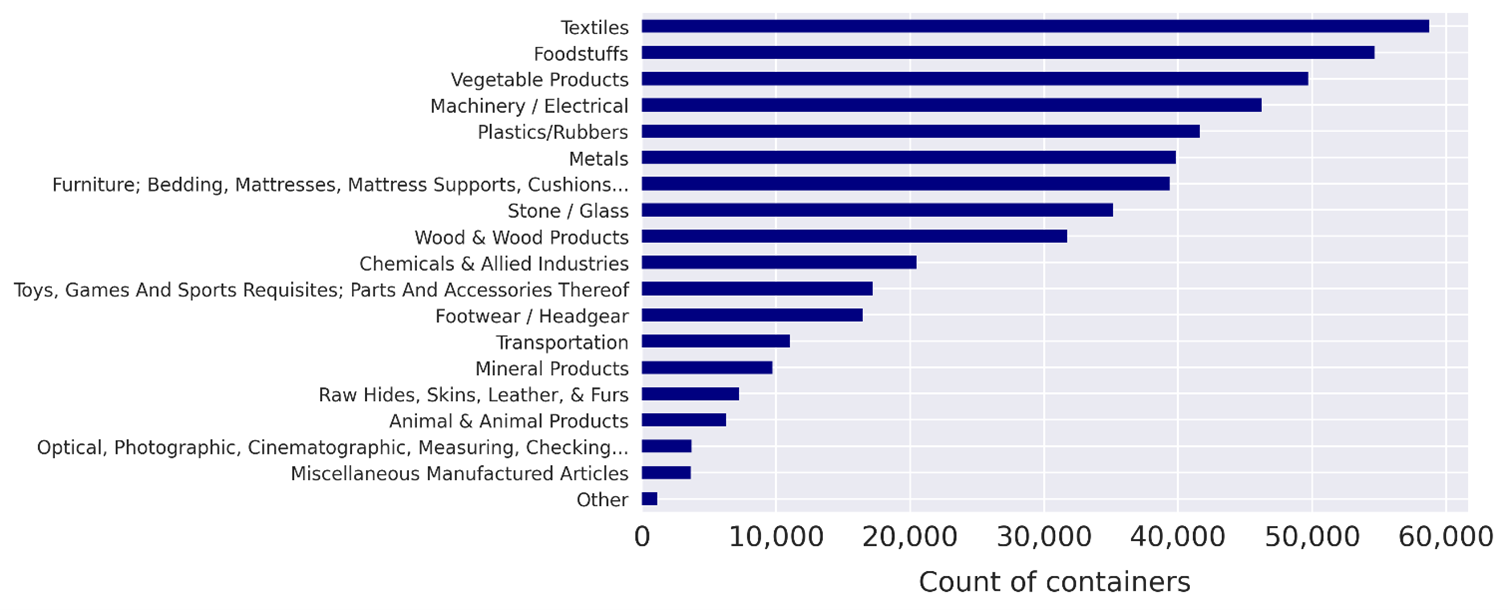
Source: Office for National Statistics – shipping instructions
Detecting anomalies in trade flows
Policymakers would like to understand how important events, such as strait blockages or industrial action, can affect the flow of commodities into and out of the UK. Anomaly detection methods can be used to detect and draw insights on these disruptive events using the shipping instructions data.
We need to distinguish between “normal” and anomalous patterns in the data, given that we expect to observe high (for example, in the lead up to Christmas) or low levels of container traffic during certain periods (for example, in the New Year). To achieve this, we built a pipeline that detects anomalies based on the differences between predicted and actual values of the smoothed container count (for instance, the residuals). The count was “smoothed” by generating the 30-day moving average to help remove random variations in the data. We obtained predicted values by fitting time-series models on the 30-day moving average using the Prophet programme. Observations were then labelled as anomalous if the computed residuals fell outside three standard deviations from the mean value.
Figure 2 shows how this method performs with data on inflowing containers at Felixstowe port. The algorithm detects several anomalies, which coincide with an eight-day strike that took place at Felixstowe between 21 and 29 August 2022. These anomalies imply, as expected, that container traffic was particularly low during the strike period. Encouragingly, the algorithm can deliver good predictions and, in turn, good anomaly detection results, despite modelling based on just under three years of data. This shows early potential in using shipping instructions data to analyse the impact of events such as strikes, political crises, natural disasters, or blockages. Wider tests on specific product flows also showed that this could help with understanding which goods were affected, which could provide useful insights into supply chain vulnerabilities.
Figure 2: We can use predictions of the smoothed container count to detect the August 2022 strike period at Felixstowe
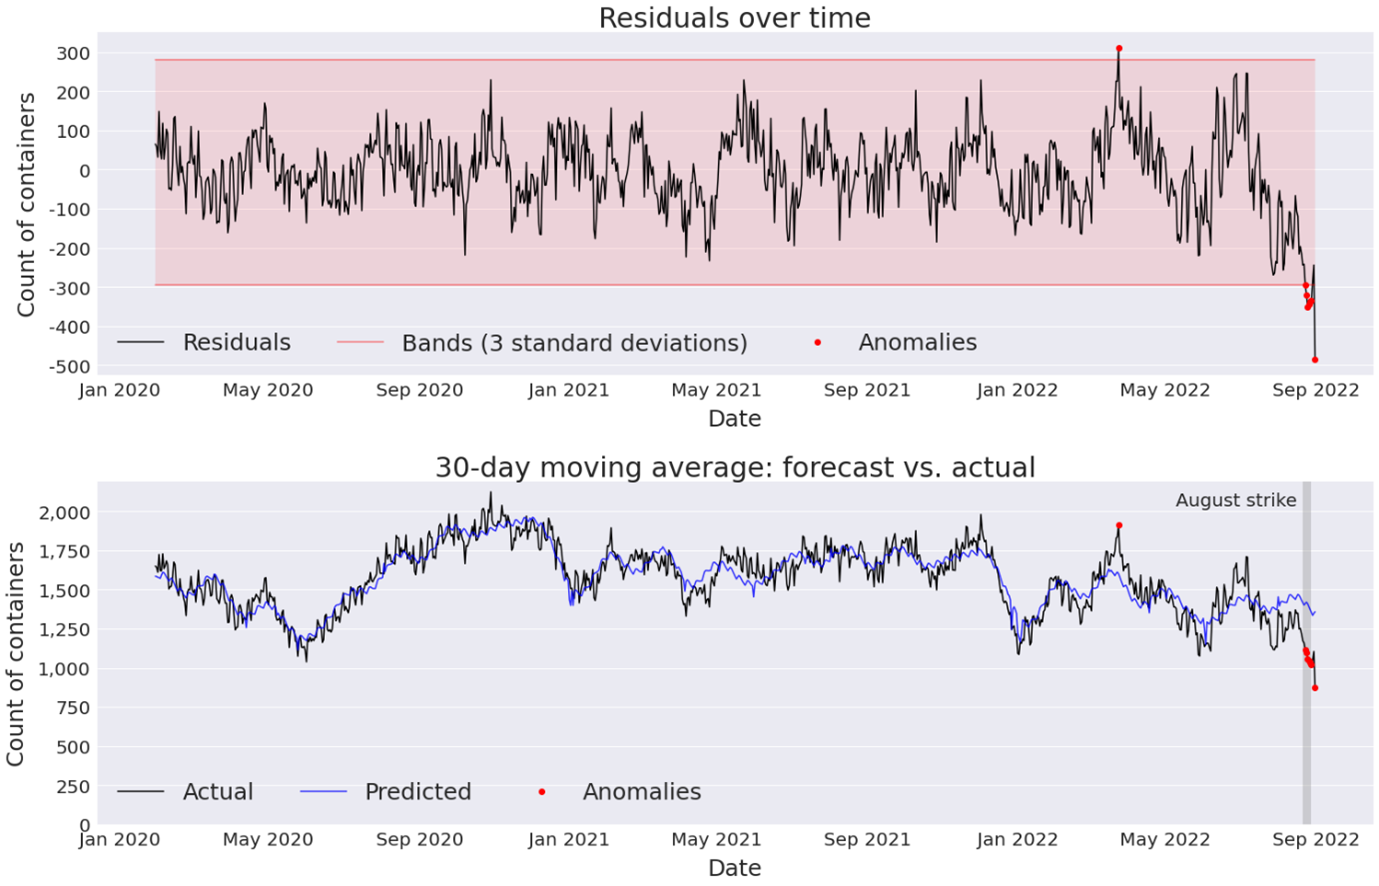
Source: Office for National Statistics – shipping instructions
Journey of critical goods
Linking ship position data to shipping instructions data will provide valuable information on what is carried by the container ships arriving and departing UK ports. This is expected to provide insights into issues such as the journey of goods through critical channels, global supply chain disruptions, and, alongside other sources, potentially improving our understanding of trans-shipment (where goods change ship on their way from origin to destination) in trade.
A pipeline that will enable linking ship position data with shipping instructions data is currently in development. Information on the position of ships in real time is obtained from automatic identification system (AIS) data. The data are transmitted every few seconds by ships through onboard navigation safety devices and include information on their location, identification, and characteristics (for example, cargo ship or tanker). Linking AIS data with shipping instructions data is achieved by using ship unique identifiers, which are present in both databases. There are often ambiguities when matching ships in the two databases because unique ship identifiers are sometimes missing from shipping instructions data. Additional challenges arise because of inaccurate event timestamps recorded in both AIS and shipping instructions data. We handle these challenges by applying fuzzy matching techniques.
Figure 3 shows initial outputs from our processing pipeline that links shipping instructions data with AIS data. In this example we track shipments of specific goods from Antwerp to Felixstowe (red line) and from Felixstowe to Rotterdam (orange line).
Figure 3: Using the linked shipping instructions and AIS data we can track the journey of shipments in near real-time
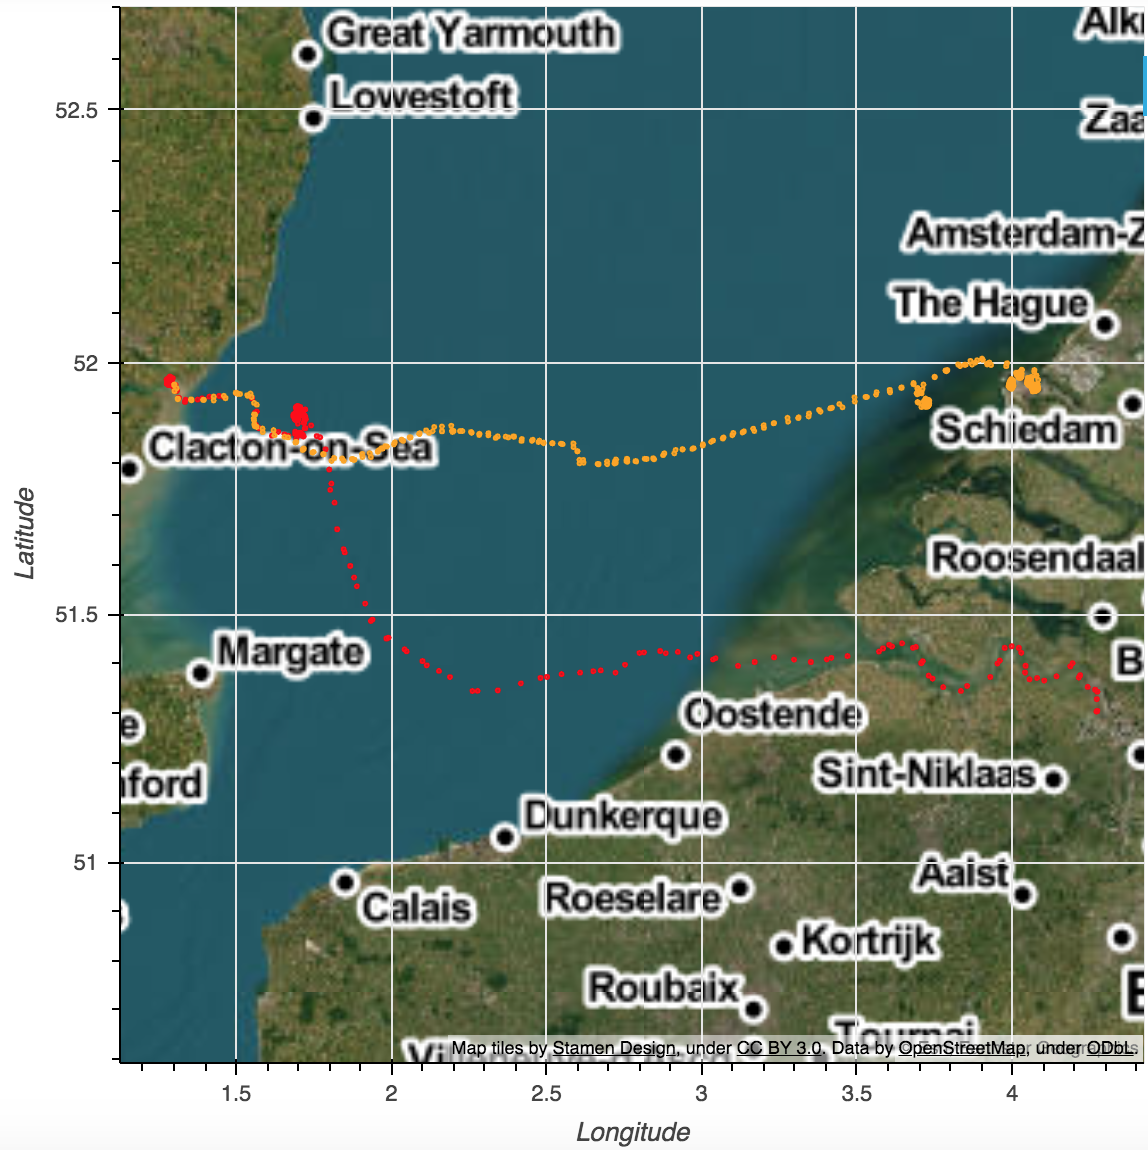
Source: Office for National Statistics – shipping instructions, automatic identification system (AIS)
Data quality
DIT, DfT and the ONS have been engaged in several data validation exercises to understand how well the dataset represents shipping and container activity. As well as AIS data, shipping instructions data have been compared with other data sources on UK trade volumes, namely statistics used in DfT port freight publications and HM Revenue and Customs (HMRC) Overseas Trade Statistics (also known as Trade in Goods). These exercises have provided relatively consistent insights into the coverage and quality of the dataset. For example, approximately half of unique cargo vessel visits recorded in AIS data are present in shipping instructions data. This corresponds with comparisons with DfT port freight statistics, which suggest that the dataset covers around half of all container imports and exports to and from the UK.
Regular interactions between TDW and the three departments have enabled data quality issues, such as duplicates and invalid observations, to be promptly flagged and addressed. DIT is also finalising a pipeline that enhances tables on container journeys. The pipeline removes implausible events and ensures that we can follow the movement of each container – from when it is first loaded to when it reaches its destination port – more easily and readily.
Around 60% of Harmonized System (HS) codes, which are used to categorise the goods carried in the containers, are known. This means that we are not certain what type of goods are in around 40% of containers. We expect the algorithm used to derive HS codes (which is based on cargo descriptions and implemented by TDW) and HS code completeness to improve as more data are accessed.
Next steps
Given its potential cross-government utility, DIT and DfT have elected to extend the contract with TDW to receive shipping instructions data up to November 2023. The ONS, DIT and DfT will continue to use this dataset, in conjunction with AIS data, to better understand trade flows in and out of the UK. A second blog, planned for publication in Spring 2023, will demonstrate how this work has progressed.
Acknowledgements
We would also like to thank David Bradnum (Data Science Campus) and Mark Purver (DIT) for their support with this project.