Using open data to understand hyperlocal differences in UK public transport availability

We have published data on our Open Geography Portal on the areas people can feasibly travel to using public transport, for hundreds of thousands of starting points across the UK. These data were requested by the Spatial Data Unit (SDU) in the Department for Levelling Up, Housing and Communities (DLUHC). The aim was to understand how the availability of public transport varies within a local area, for example, comparing one side of a town with another. This helped identify groups of households that might not be able to access important surrounding towns and cities within a certain timeframe.
The Data Science Campus were asked to produce detail on how these areas vary for different travel times (increments of 15 minutes up to a maximum travel time of 60 minutes). Then, data was compiled for all four nations using comparable sources and methods, so that SDU could reproduce analysis for any place in the UK. To understand how access varied at a hyperlocal level, we needed to produce data at the most granular census area possible. This is currently output area (Census 2021 basis) for England and Wales, output area (2011 Census) for Scotland, and small area level (2011 Census basis) for Northern Ireland. This equates to areas that have groups of approximately 40 to 150 households.
Data and methods
We compiled and reformatted existing, openly available, bus and train timetable data and used the open-source route planning software, OpenTripPlanner. Using these, we converted the timetables into the entire feasible set of locations people can travel to, from a given starting point. We repeated this process for every output area in the UK, which equates to 239,768 different places.
So that journeys going through the Republic of Ireland could be incorporated, we added bus and train timetables for the Republic of Ireland. This kept data and methods for all four nations of the UK consistent. Alternative public transport methods, such as tram and underground services, were also included when calculating the feasible travel area.
Bus and train timetable data for Scotland, England, and Wales were sourced from the Department for Transport (DfT) and Rail Delivery Group, respectively. The Northern Ireland bus and train data were sourced from OpenDataNI. Data for the Republic of Ireland were sourced from Transport for Ireland. Timetable data were converted to a standardised General Transit Feed Specification (GTFS) format using a range of tools, including the R package, UK2GTFS, developed by the University of Leeds. For England, Scotland, and Wales, travel area estimates were generated using timetable data for Tuesday 15 November 2022. For Northern Ireland, data for Tuesday 6 December 2022 was used. Both days were unaffected by temporary factors that could affect service levels, such as industrial action and weather events.
The feasible travel areas calculated from OpenTripPlanner depended on a range of adjustable parameters. One of the most important was the choice of start time. In many places, buses and trains run less frequently than an hour. Therefore, producing travel areas from one single point in time (for example, 8am) was likely to lead to variation in results, depending on which services depart close to that single point in time. However, results should account for differences in the frequency of services. We took the approach to calculate the feasible travel areas for eight start times in 15-minute increments, between 7:15am and 9:15am inclusive. Once we obtained these eight travel areas, we took the union of the areas, which incorporates all the area generated from the eight instances.
A second important parameter was the starting point. Our approach was to have the starting point default to the population-weighted centroid within each output area. This was to model the feasible travel area that could be achieved by an “average household” within an output area. However, it should be noted that as households are often unevenly geographically distributed, the centroid can be an unrepresentative starting point for some households within a given output area. The population-weighted centroid can also be positioned in inaccessible places, such as forests and car parks (one was even located in a prison). In these cases, we change the starting point to a nearby road. The final important parameter was the degree to which people can walk during the journey. We set this at 1.5 kilometres for the whole journey, which could be used up in a single stretch of walking, or multiple trips. One example would be walking from home to a departing train station, followed by another journey from the arrival train station to a different location. This is approximately the distance travelled by foot for the average commute in the UK.
Data availability and access
The full UK dataset produced for the Department for Levelling Up, Housing and Communities (DLUHC) contains feasible travel areas using public transport for 239,768 places across the UK. We have made these data publicly available on the Office for National Statistics (ONS) GeoPortal in the form of ESRI shapefiles (for information on shapefiles, see the ArcGIS reference page). These shapefiles can be accessed either as a bulk dataset or by using the GeoPortal application programming interface (API). Further information on the data can be found in the accompanying metadata.
Data can be accessed using two different approaches. Firstly, data can be accessed from the ONS GeoPortal’s bulk download facility. Secondly, the data can be accessed via the ONS GeoPortal API, which has documentation on how subsets of the data can be queried.
Use case
These data have been used for the recently conducted Department for Levelling Up, Housing and Communities (DLUHC) “deep dive” work in Grimsby, where policymakers worked with local stakeholders to identify barriers to growth and improve outcomes. The Data Science Campus supported this work by producing data on feasible travel areas for approximately 50 output areas in Grimsby and the nearby surrounding area.
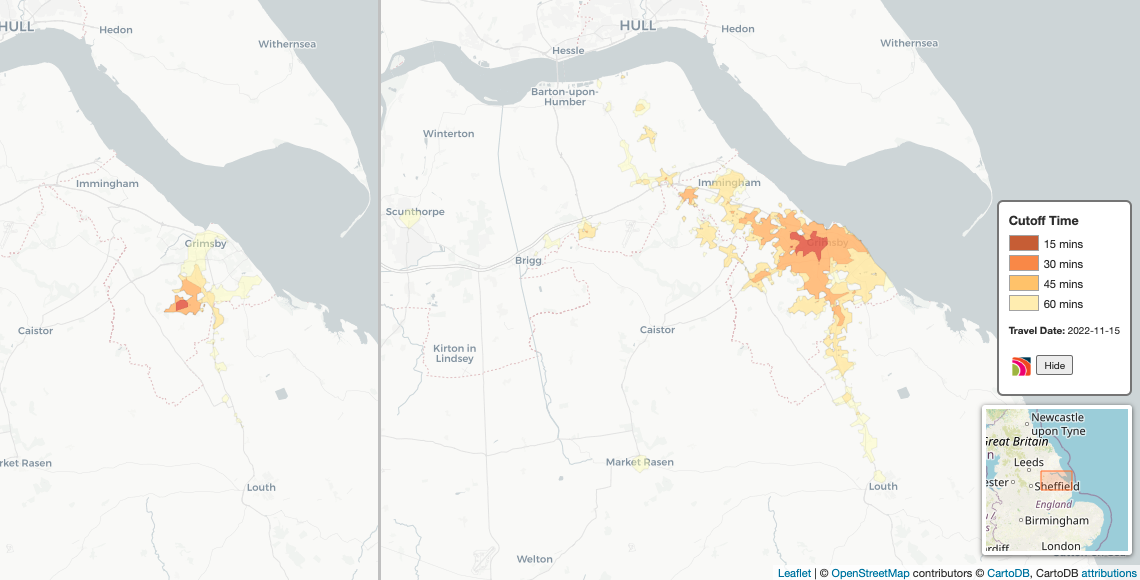
Figure 1 shows how public transport accessibility varies in Grimsby, by visualising the feasible travel area for two different starting locations. One location is in West Marsh, close to Grimsby Town train station, and one in Waltham, a suburb four miles south of Grimsby. These two travel areas show that there is wide variation in the locations that are available by public transport to households living in these areas. For example, places such as Louth and Barton-Upon-Humber are accessible to those living closer to the centre of the town, but not accessible by public transport for those living in Waltham.
Figure 1: Feasible travel areas starting from Waltham (left pane) and near to Grimsby Town train station (right pane), increments of 15 minutes up to 60 minutes, between 7:15am and 9:15am
For further clarification on the methods, data sources, schema, and metadata for this project, we encourage contact by email at datacampus@ons.gov.uk.