Using Sentinel-2 images to measure the change in tree coverage in eastern Uganda: what does it mean for the Mbale Trees Programme?
In this project we helped the Welsh Government quantify the impact of the Mbale Trees Programme on tree cover change in eastern Uganda. Between 2016 and 2022, we found a positive net change in tree cover. The greatest positive change in tree cover was found near to Mbale Tree Programme’s nursery sites. For more information on the Mbale Trees Programme visit this storyboard developed by the Welsh Government.
Towards the end of 2021, the Welsh Government approached us with a project proposal to explore whether tree cover has changed in recent years in eastern Uganda, in response to a tree planting initiative they lead in the area. Identifying changes over time and at scale, such as deforestation, has long been done using satellite and aerial images (Green and Sussman, 1990). We were well placed to support this request because of prior experience in the Campus working on similar projects, including:
- assessing green spaces in residential gardens (Bonham, Williams and Grimstead, 2019)
- reporting changes to water bodies (Hannay et al. 2020)
- detecting trucks in East Africa (Douglas, Dangerfield and Green, 2021)
- counting cows in South Sudan (Wilson and Harris, 2020)
Why are the Welsh Government interested in trees in eastern Uganda?
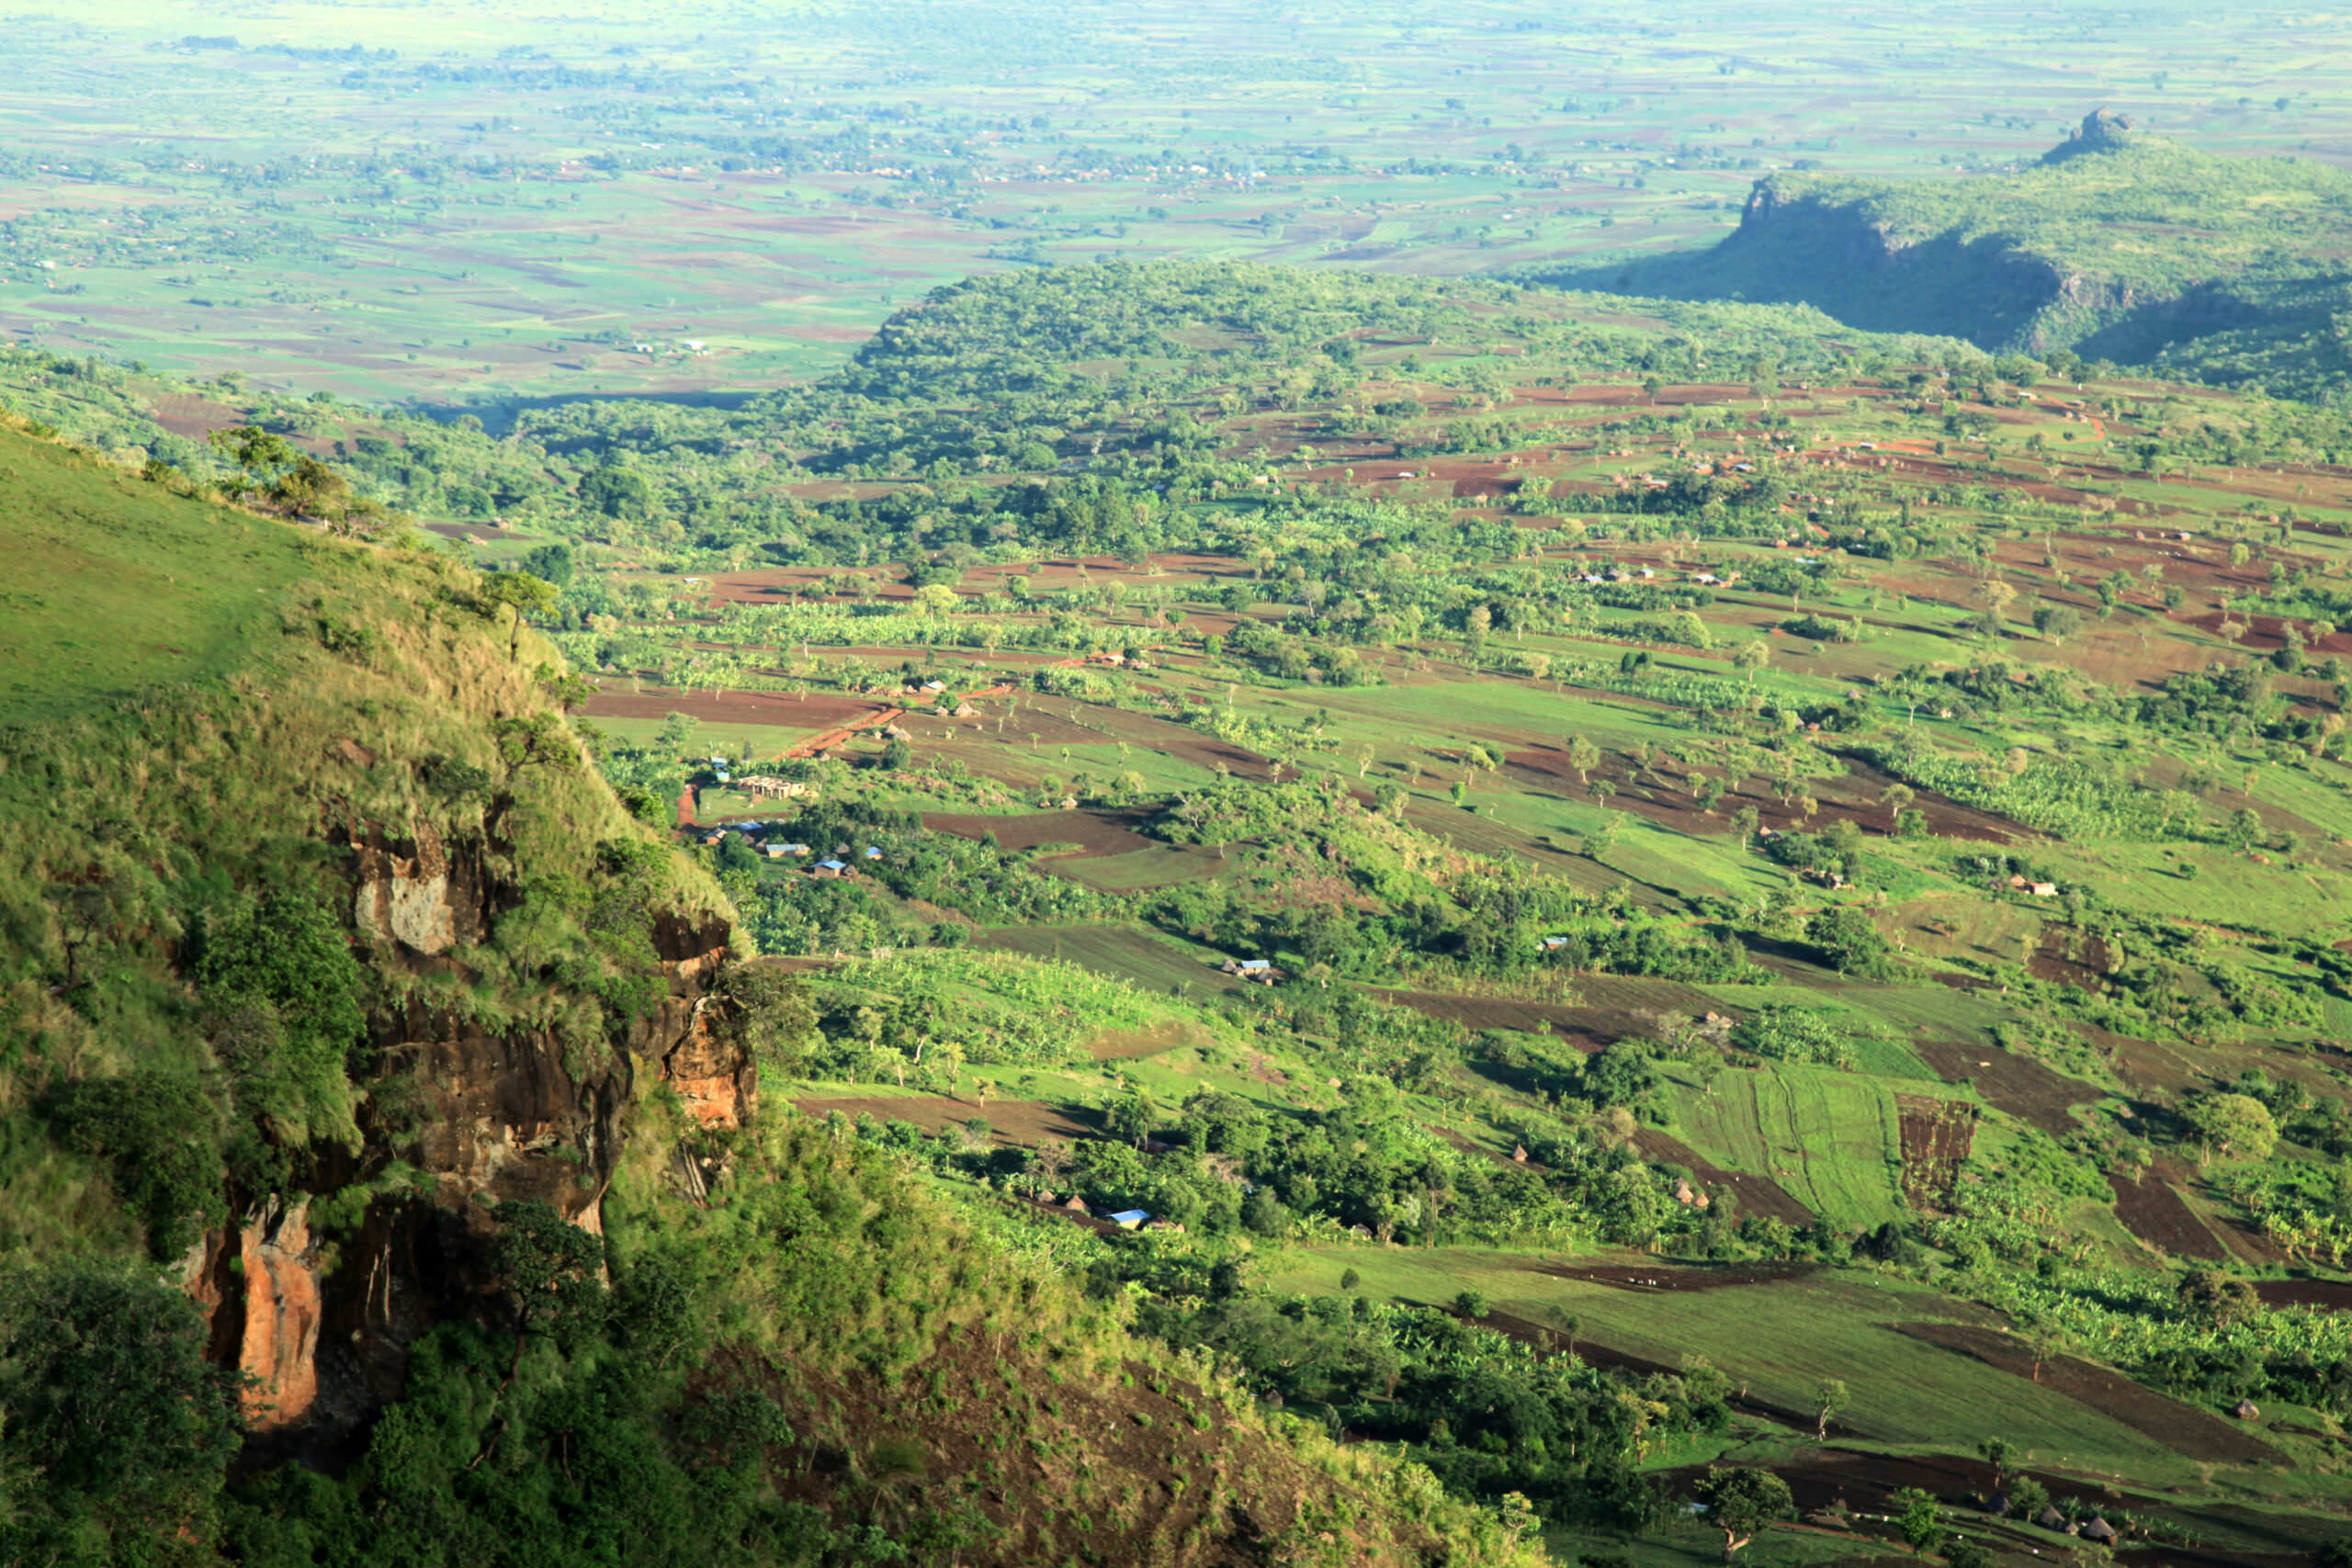
The area surrounding Mbale, Uganda, is hilly and heavily vegetated (Figure 1). For many in the region, trees provide a source of fuel, food, and income. According to Global Forest Watch, who calculate tree cover change using 30-metre (m) resolution data, Mbale district has lost 727 hectares (ha) (a hectare is around the size of a football pitch) of tree cover between 2000 and 2021, equating to around 1.5% of its area. The loss of trees has an impact on the local area and residents, as well as contributing to the broader effects of climate change. In recent years, for example, fatal landslides in Mbale (Reuters, 2022) and neighbouring districts (BBC, 2018) are likely to have occurred because of heavy rainfall, combined with increased surface runoff caused by tree loss.
Figure 1: A map showing the location of a. Uganda, b. the Mbale Trees Programme area in eastern Uganda, and c. the tree nurseries and districts within the programme
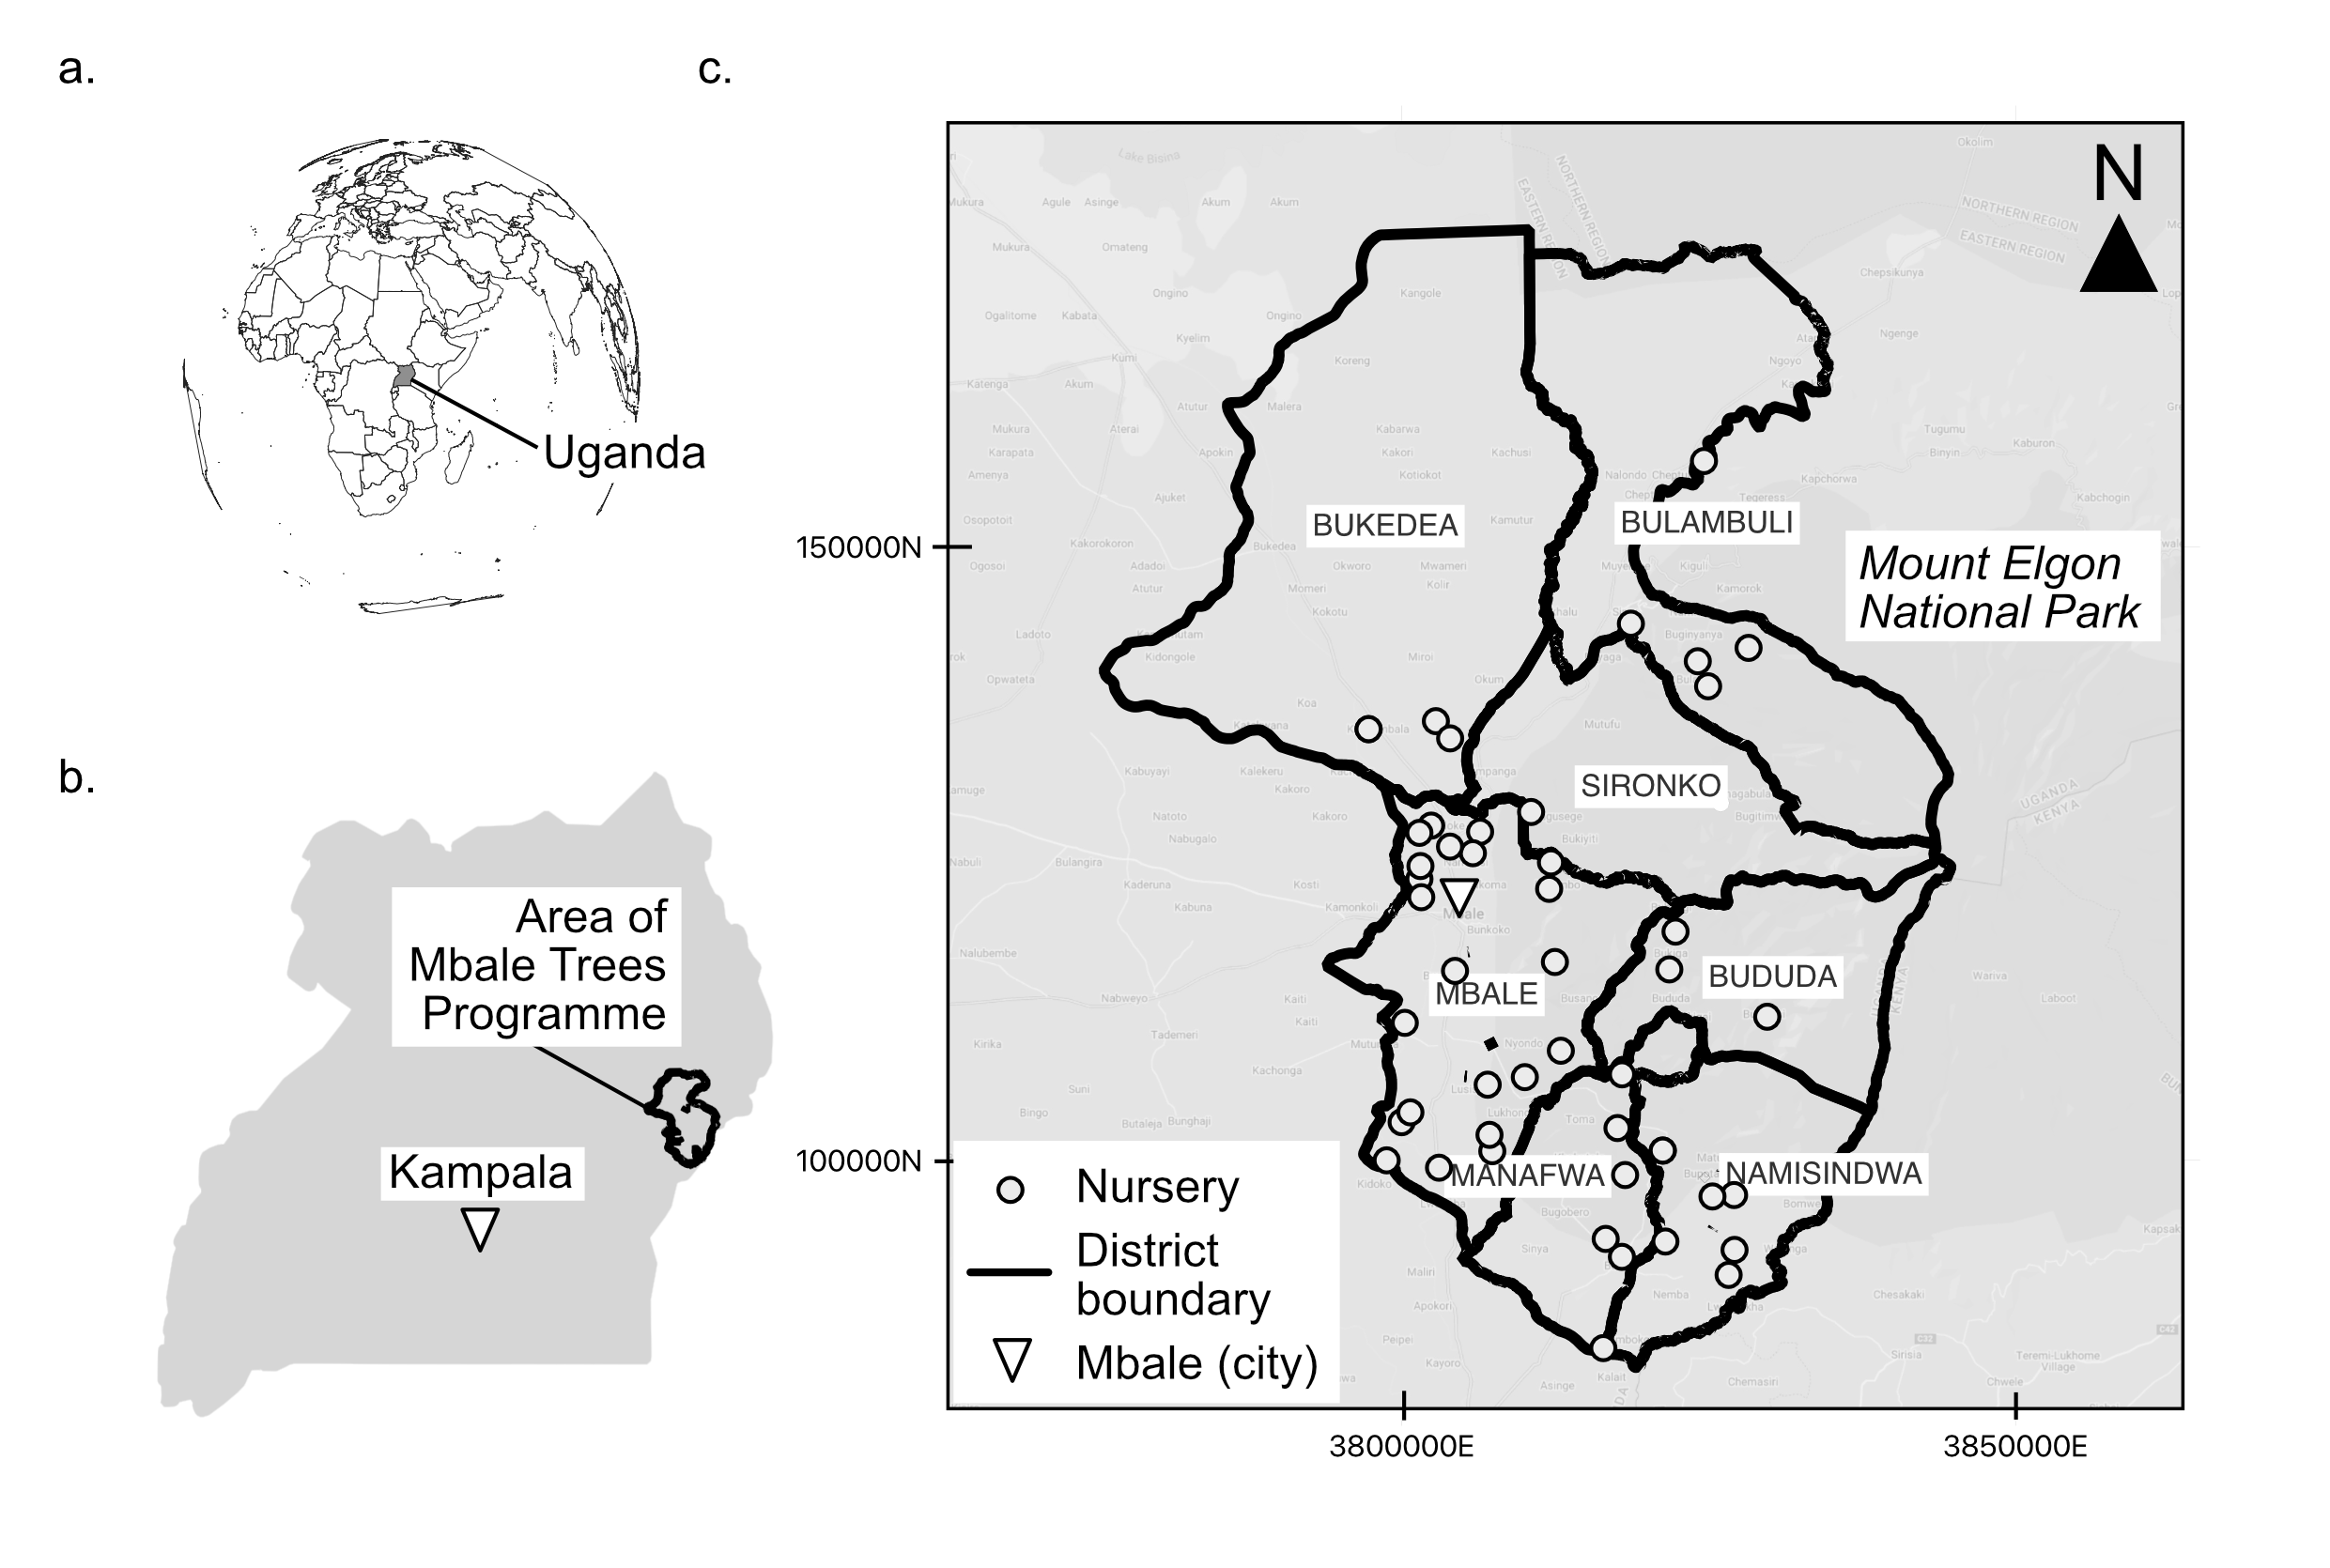
To combat this tree loss, the Mbale Trees Programme was established in 2010 by the Welsh Government, in partnership with the Size of Wales and the Mount Elgon Tree Growing Enterprise (METGE). The programme works in collaboration with local partners to freely distribute tree seedlings to local people for planting on smallholdings or community land. Since the programme began, 17 million seedlings have been distributed in local communities from tree nurseries. It is hoped that the planting of these seedlings will lead to increased tree cover. This will, in turn, help mitigate the risks of further landslides, provide an economic resource (through fuel, wood, and fruit), provide an ecological resource in more resilient habitats, and more broadly help to combat climate change.
Although the Mbale Trees Programme was not developed to restore dense forests, it is hoped that it has helped to achieve this indirectly by reducing the need for locals to cut down trees from established forests. Although tree loss has been calculated yearly up to 2021 by Global Forest Watch, tree gain uses a different methodology and does not have data per year for the area around Mbale (Potapov, P. et al 2022). Between 2000 and 2020, it was estimated that for the Mbale district, tree gain was around 684 ha (Table 2). Differences in methodologies mean it is difficult to directly compare tree loss and tree gain using Global Forest Watch; however, tree loss appears to be greater than tree gain since 2000.
In this blog post we describe how we used 10m resolution Sentinel-2 satellite images to calculate the most recent changes in tree cover around Mbale from 2016 to 2022, and what we can infer about the Mbale Tree Programme from these findings.
Data and Methods
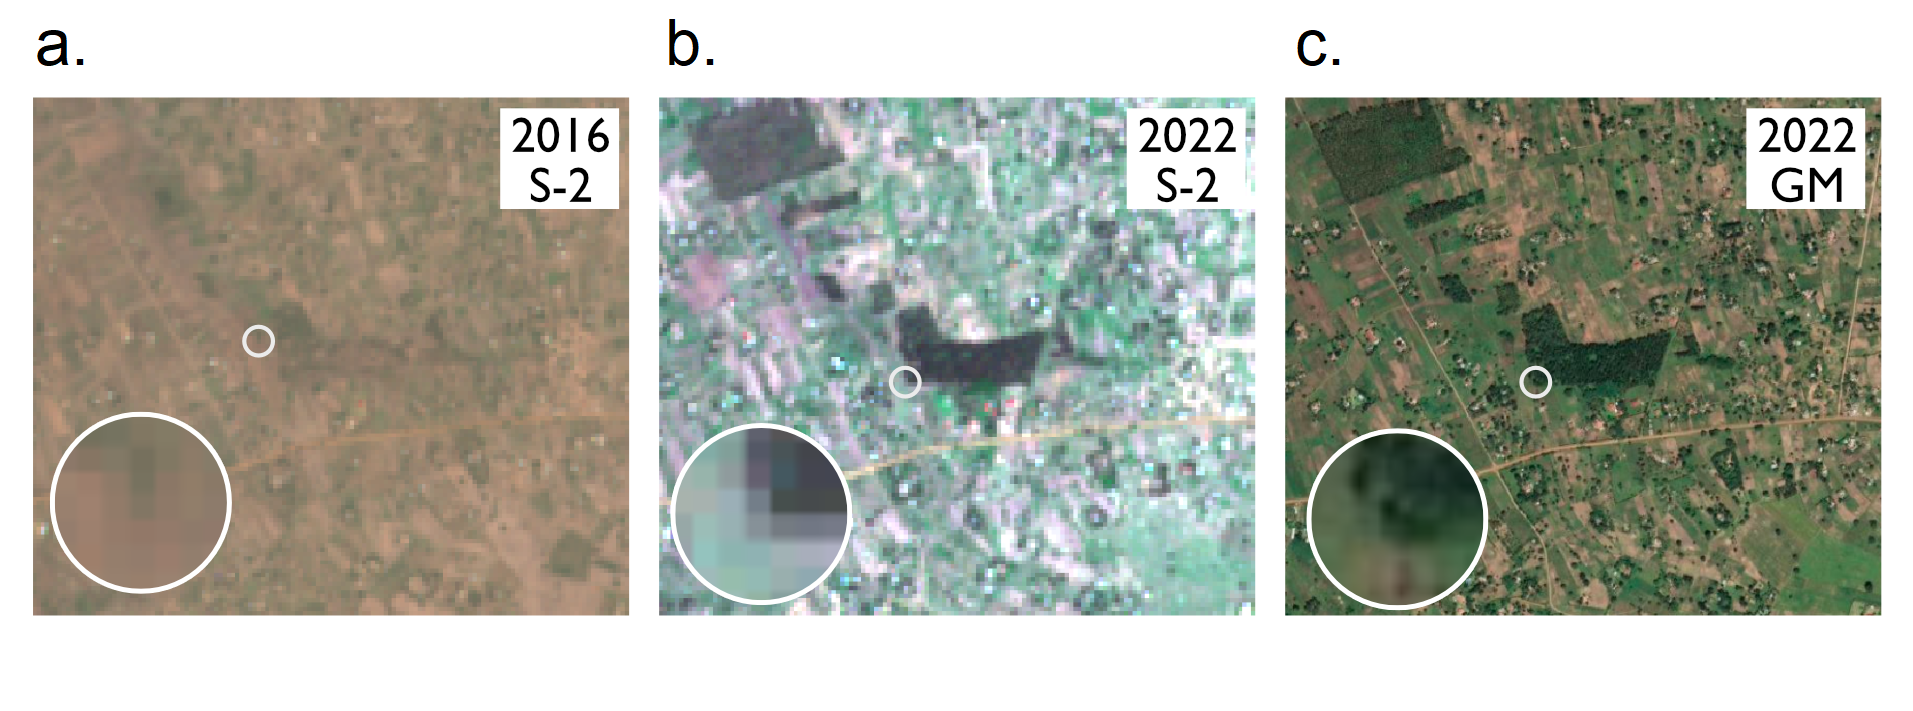
In this work we used the European Space Agency’s open-access Copernicus Sentinel-2 satellite imagery. As Sentinel-2 has only been operational since 2015, it does not span the entire time of the Mbale Trees Programme (2010 onwards). We considered changes in tree cover between 2016 and 2022 and compared images from similar times of the year to avoid biases introduced by differing seasons. The resolution of the Sentinel-2 images (10m) means that only areas of trees can be identified, as opposed to small, single, or dispersed tree canopies (Figure 2).
Figure 2: Resolution differences between a. 2016 Sentinel-2, b. 2022 Sentinel-2 and c. the latest 2022 Google Maps image for an area in The Mount Elgon region, eastern Uganda. The white circle shows a zoom of a small area in each image to show the pixel resolution.
To calculate changes in tree cover we first classified the pixels in the 2016 and 2022 images that represented areas of trees, and then analysed where classifications were different using a computer script developed in Python. To identify pixels that were tree covered, we constructed a manual training set, and then (aptly) applied a random forest classifier to categorise the pixels as tree covered or not. After tuning, the algorithm was able to classify pixels of Sentinel-2 images with around 90% accuracy. Differences in tree and non-tree classifications between the 2016 and 2022 images could then be calculated to identify tree cover gain and loss (Figure 3 and Figure 4). To decrease errors because of misclassification, we only calculated differences for areas above 2,000 metres squared (around 4 by 4 pixels). Therefore, tree loss or gain in areas less than this threshold will not be considered.
Figure 3: The top row (a to d) shows the Sentinel-2 images and areas used for training (yellow denotes a non-tree area, blue denotes a tree area). The bottom row (e to h) shows the predictions of the model for non-tree (background colour, white) and tree (black) for four randomly selected areas
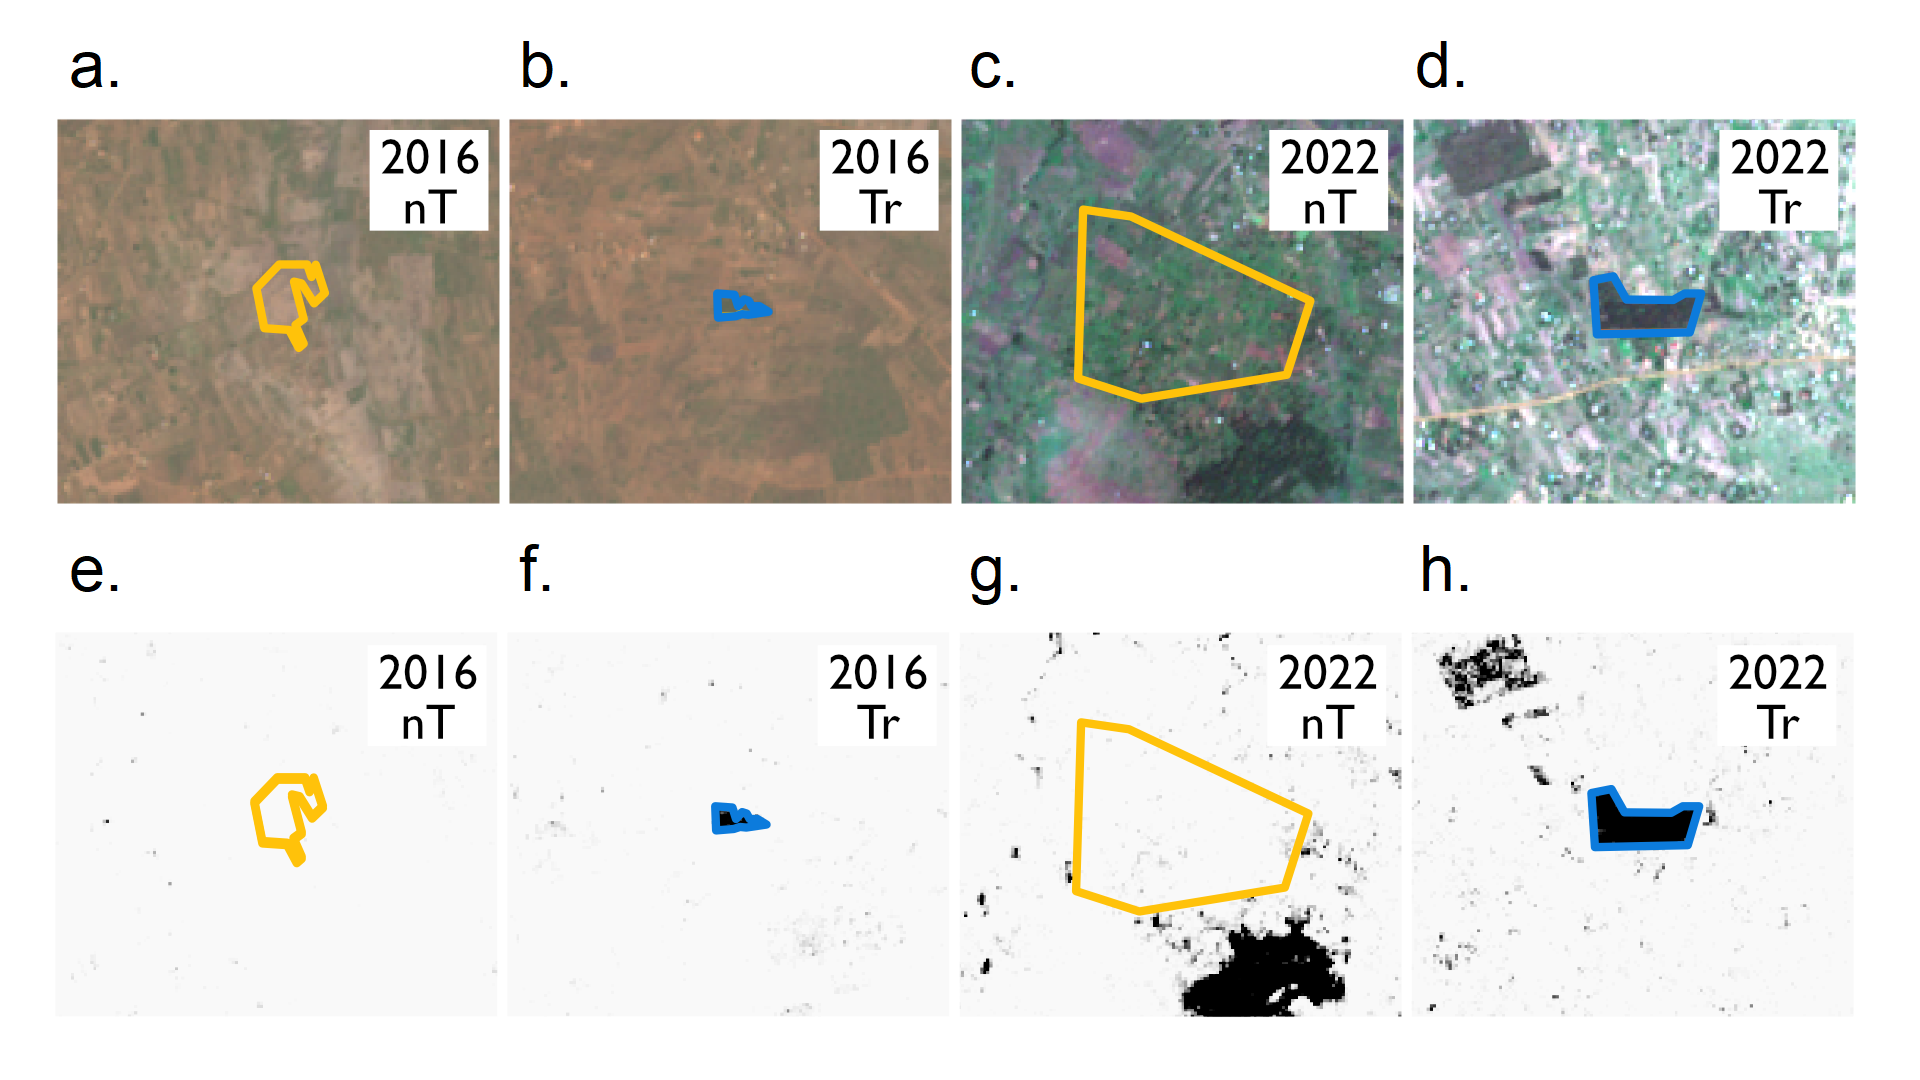
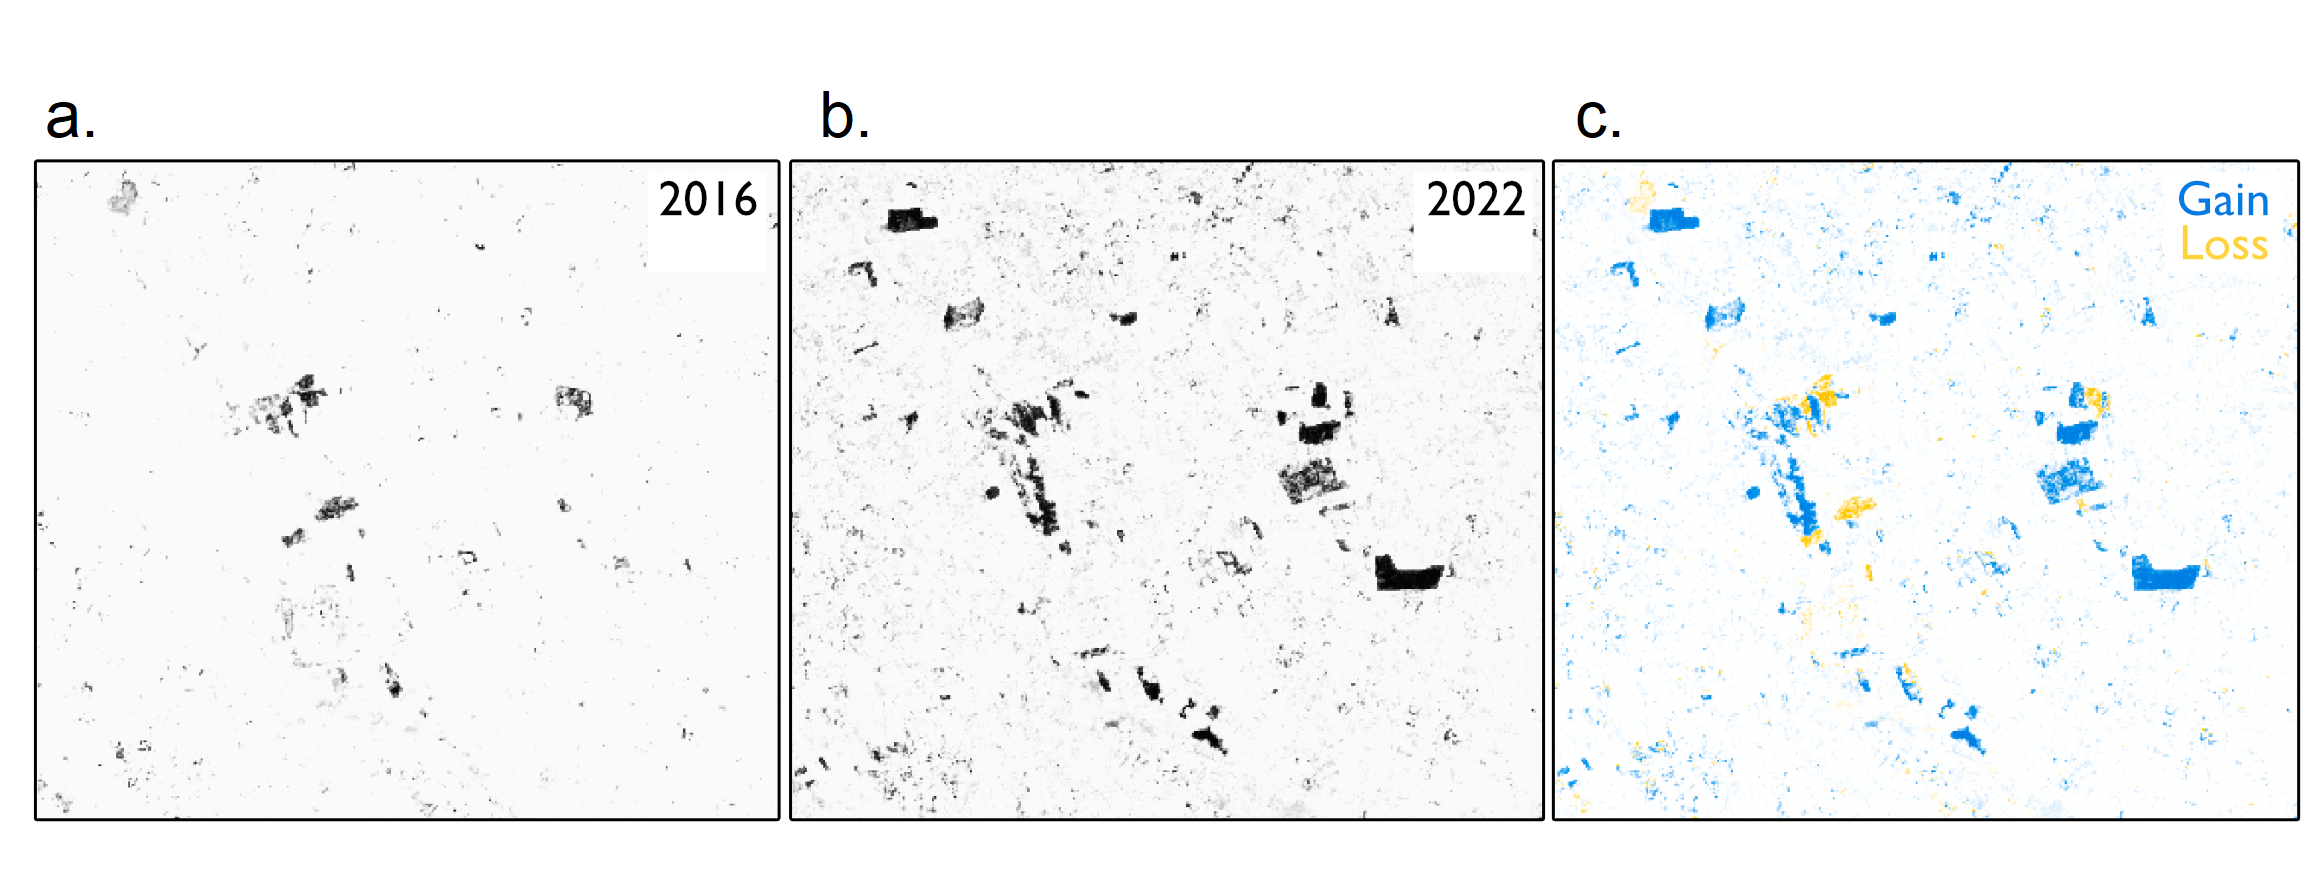
Figure 4: Predictions of the model for non-tree (background colour, white) and tree (black) for the same area in a. 2016 and b. 2022. c. shows areas of tree gain and loss between the two images and dates.
To understand the influence of the Mbale Trees Programme specifically, we compared changes in tree cover in areas surrounding nurseries, to areas understood to be away from reforestation projects. To do this we apply several buffer zones around each nursery and calculate the tree cover change for each zone. We will also explore changes to tree cover around Mbale at the district and sub-county levels.
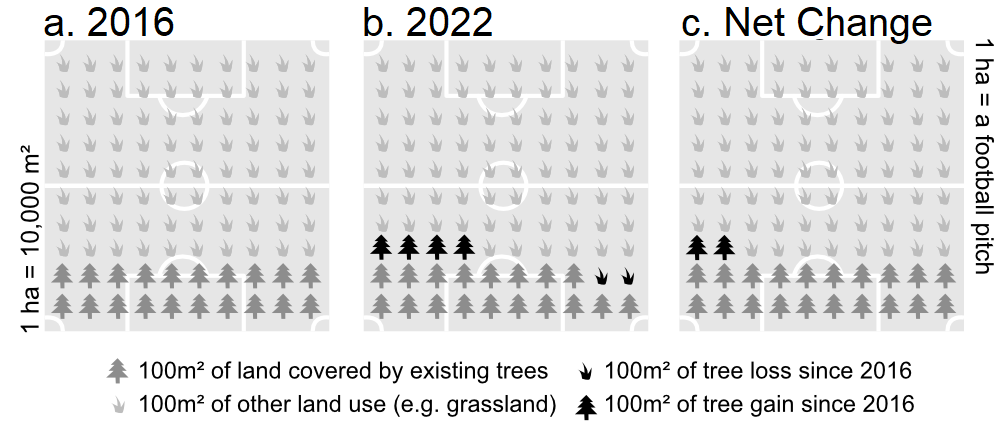
Changes in tree cover will be presented in units metres squared per ha. Another approach would be to use percentage change; however, because land cover in Mbale is mostly non-forest cover (20% forest cover according to Global Forest Watch) changes in tree cover are likely to result in small percent changes, and such values would be hard to read in the text below. Figure 5 shows a visual example of how to interpret the results, showing that a hectare is around the size of a football pitch. As 1 ha is 10,000 metres squared, the values can be changed into percentage change by dividing by 10 (for example, 50 metres squared per ha is equal to 0.5%).
Figure 5: A visual to show how to interpret the values in this analysis. 1 ha is 10,000 metres squared (around the size of one football pitch), each icon is 100 metres squared. a. An area that is already covered by 20% forest in 2016. b. In 2022 tree loss was measured to be 200 metres squared per ha, and tree gain 400 metres squared per ha. c. A net change of 200 metres squared per ha is calculated, which is the same as 2% change.
Our findings
There is variation in results between districts and sub-districts
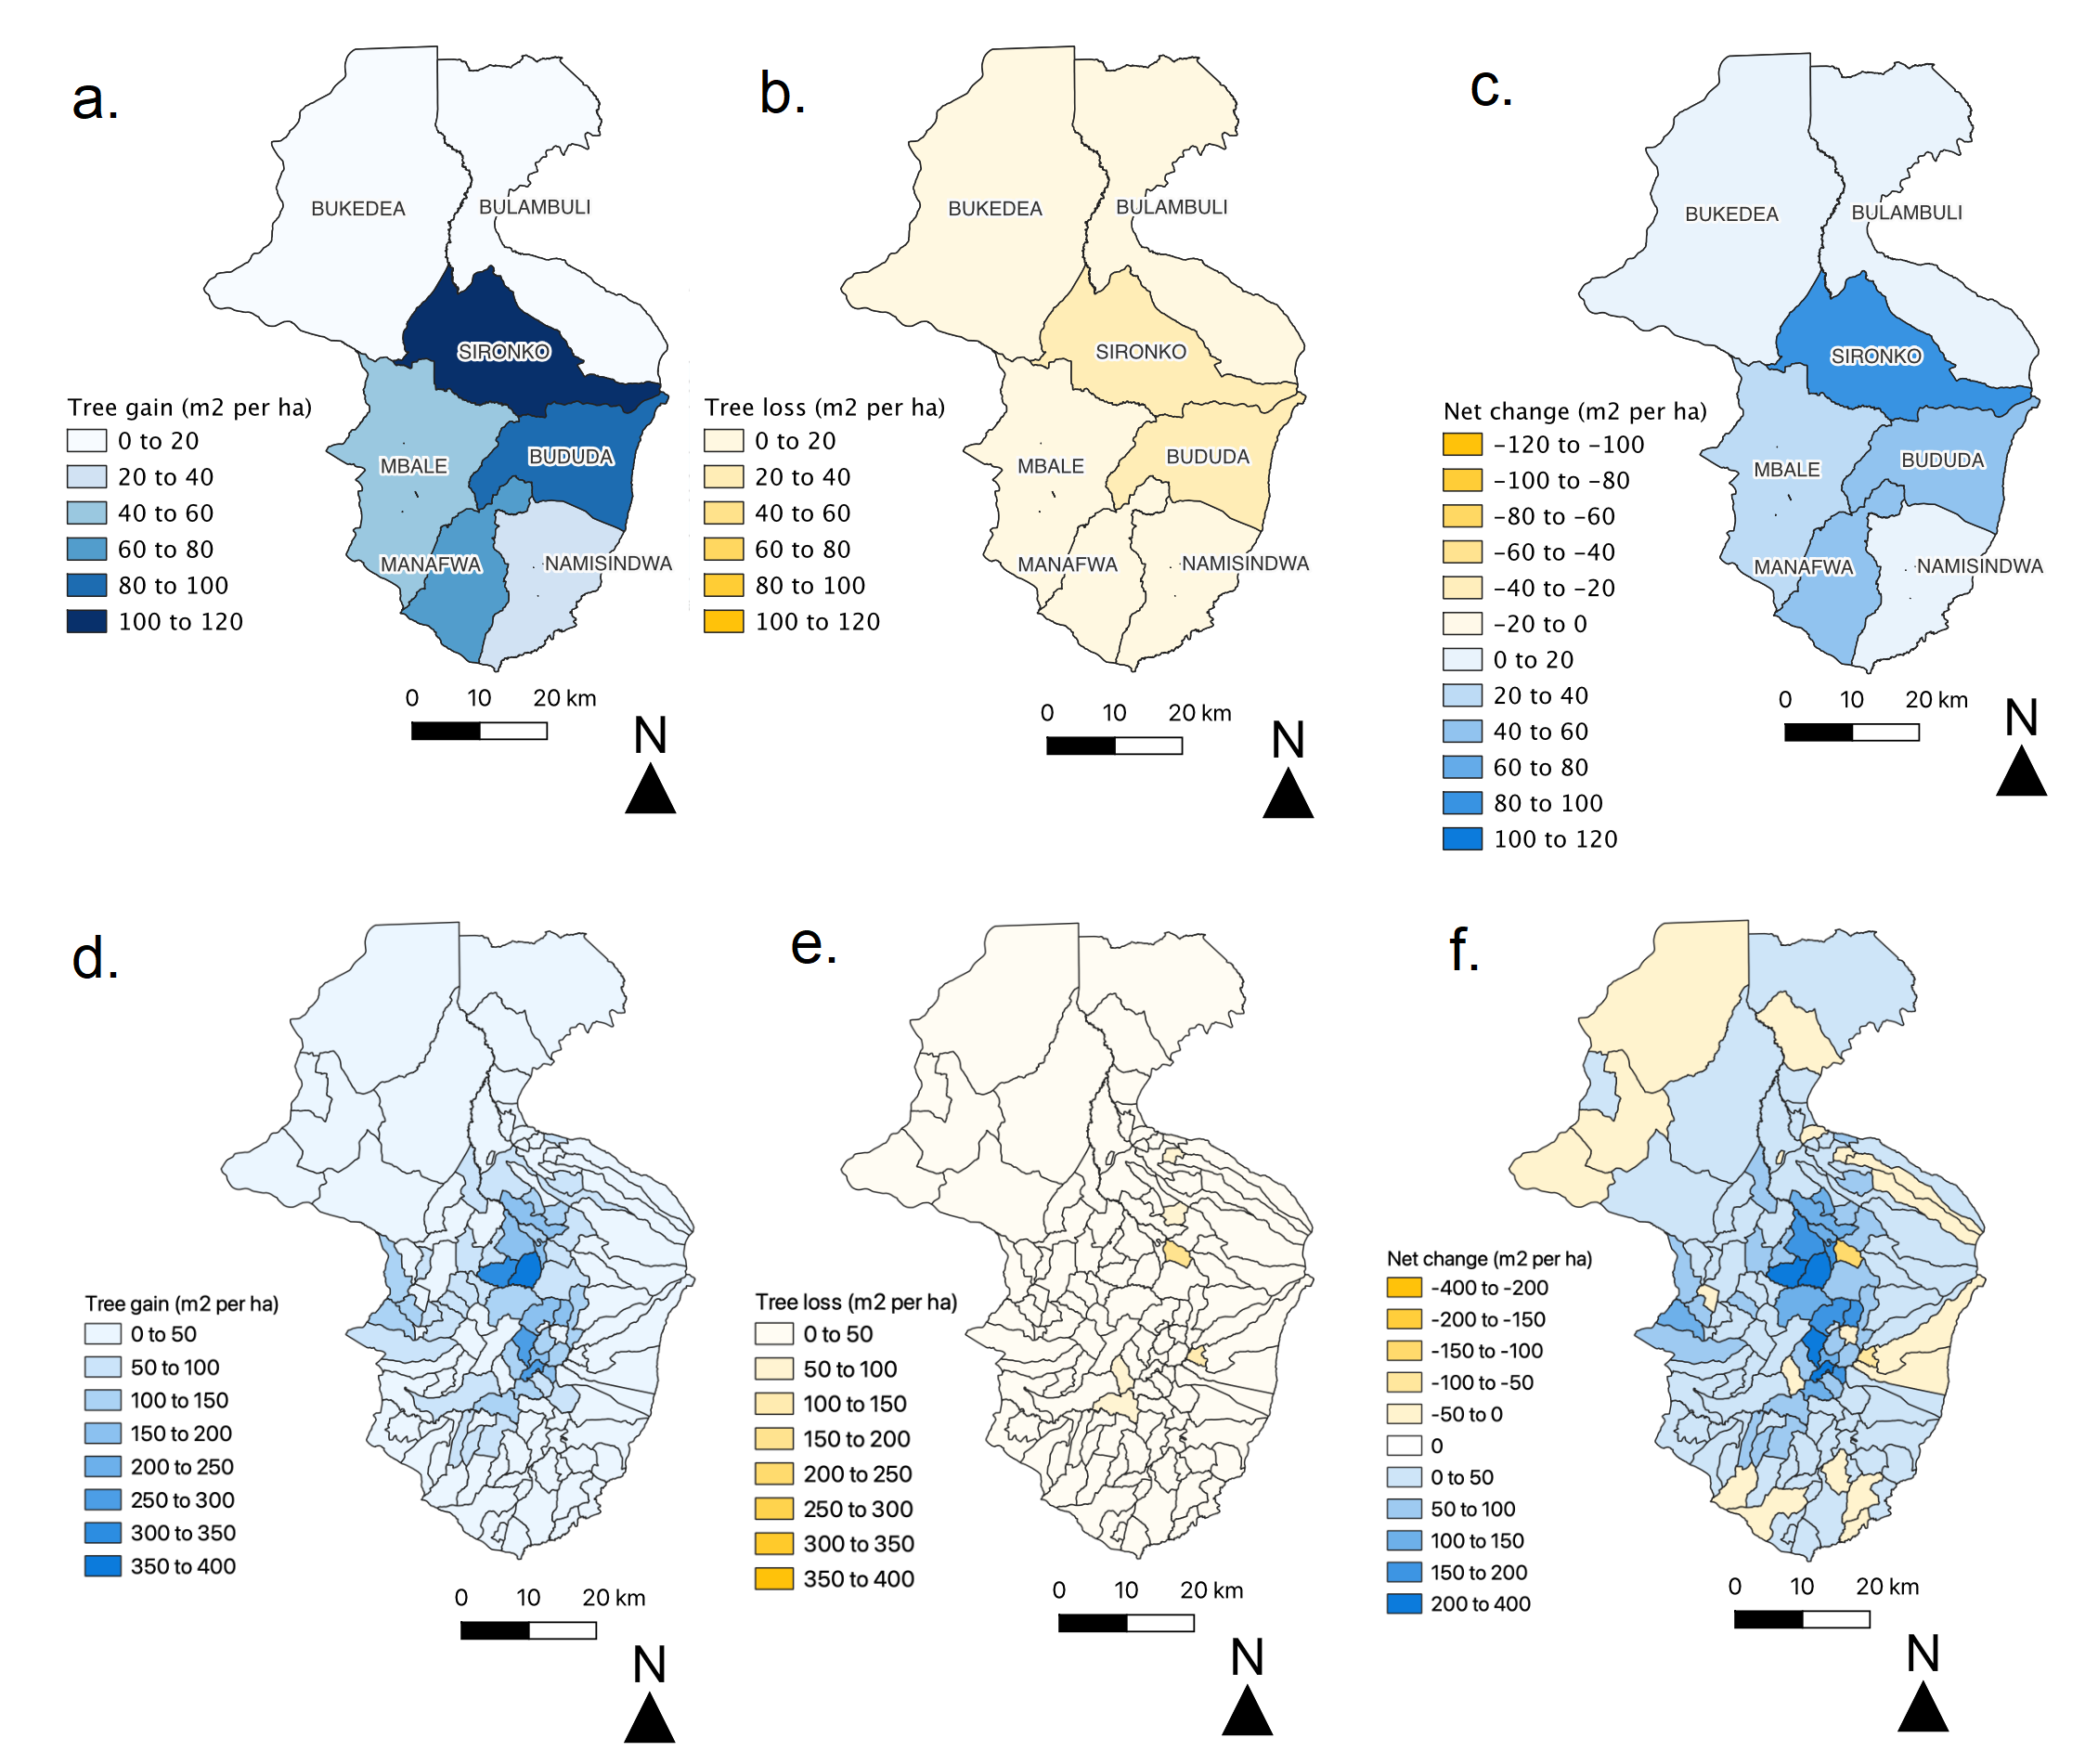
In all districts, tree cover gain is greater than tree cover loss (Figure 6a to 6c). Mbale district has a net change of 37.6 metres squared per ha (equivalent to an increase of 0.38 percentage points) – this equates to a net gain of 195 ha across the 51,780 ha district (Table 1 and Table 2). While the Mbale district has one of the largest net changes, Sironko is the district with the greatest net change (83 metres squared per ha, equivalent to an increase of 0.83 percentage points), and Bukedea the smallest (1.3 metres squared per ha).
Each district can be broken down into several counties, and sub-counties (Figure 6d to 6f). The range of tree cover gain values in each of the sub-counties is large (0 to 384 metres squared per ha), but on average it is 56 metres squared per ha. The range of tree cover loss is smaller (0 to 193 metres squared per ha), with an average of 14 metres squared per ha. The sub-county with the greatest tree loss (Busulani) and tree gain (Buteza) were both within the Sironko district. Sub-counties in the Mbale district have a smaller range for tree cover gain (5 to 131 metres squared per ha) and loss (2 to 36 metres squared per ha), with Northern Division showing the greatest tree cover gain and Industrial Division the greatest tree loss.
Figure 6: Tree gain (a,d), loss (b, e) and net change (c, f) for each district (top row: a to c) and sub county (bottom row: d to f)
Net positive change in tree cover is greater closer to nursery locations
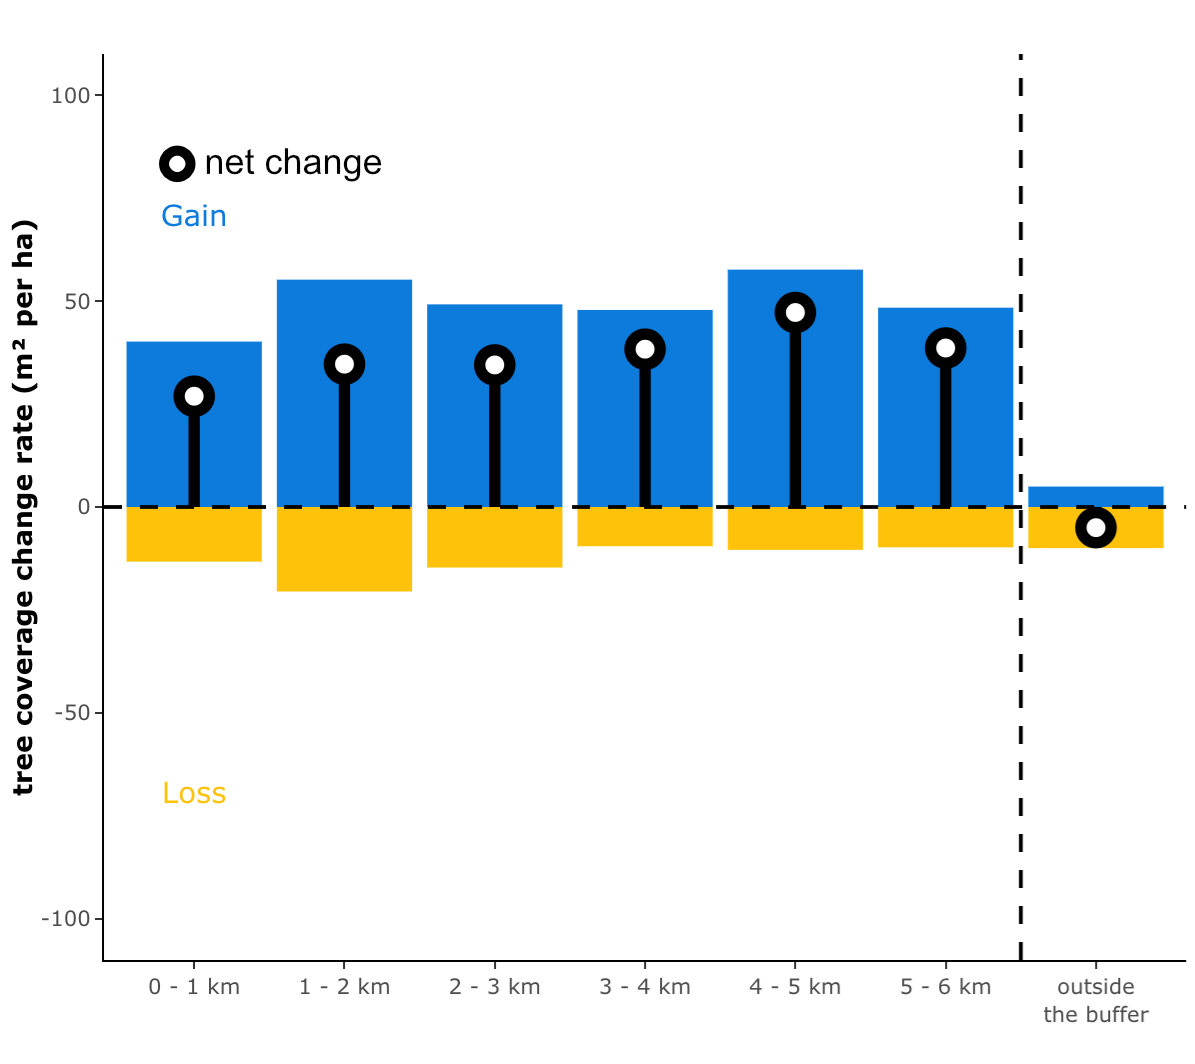
Our findings show that in the areas surrounding nurseries, tree cover gain and loss are both greater than in areas away from nurseries. However, gain is greater than loss, so the net effect is that tree cover has increased (Figure 7). Outside the 6-kilometre (km) buffer area, we found that the net change was a loss in tree cover. This trend could indicate that the programme is having a positive influence on tree cover in areas near (less than 6km from) nurseries.
Figure 7: Tree coverage change rate for buffer areas around tree planting nurseries. Circles show the net change.
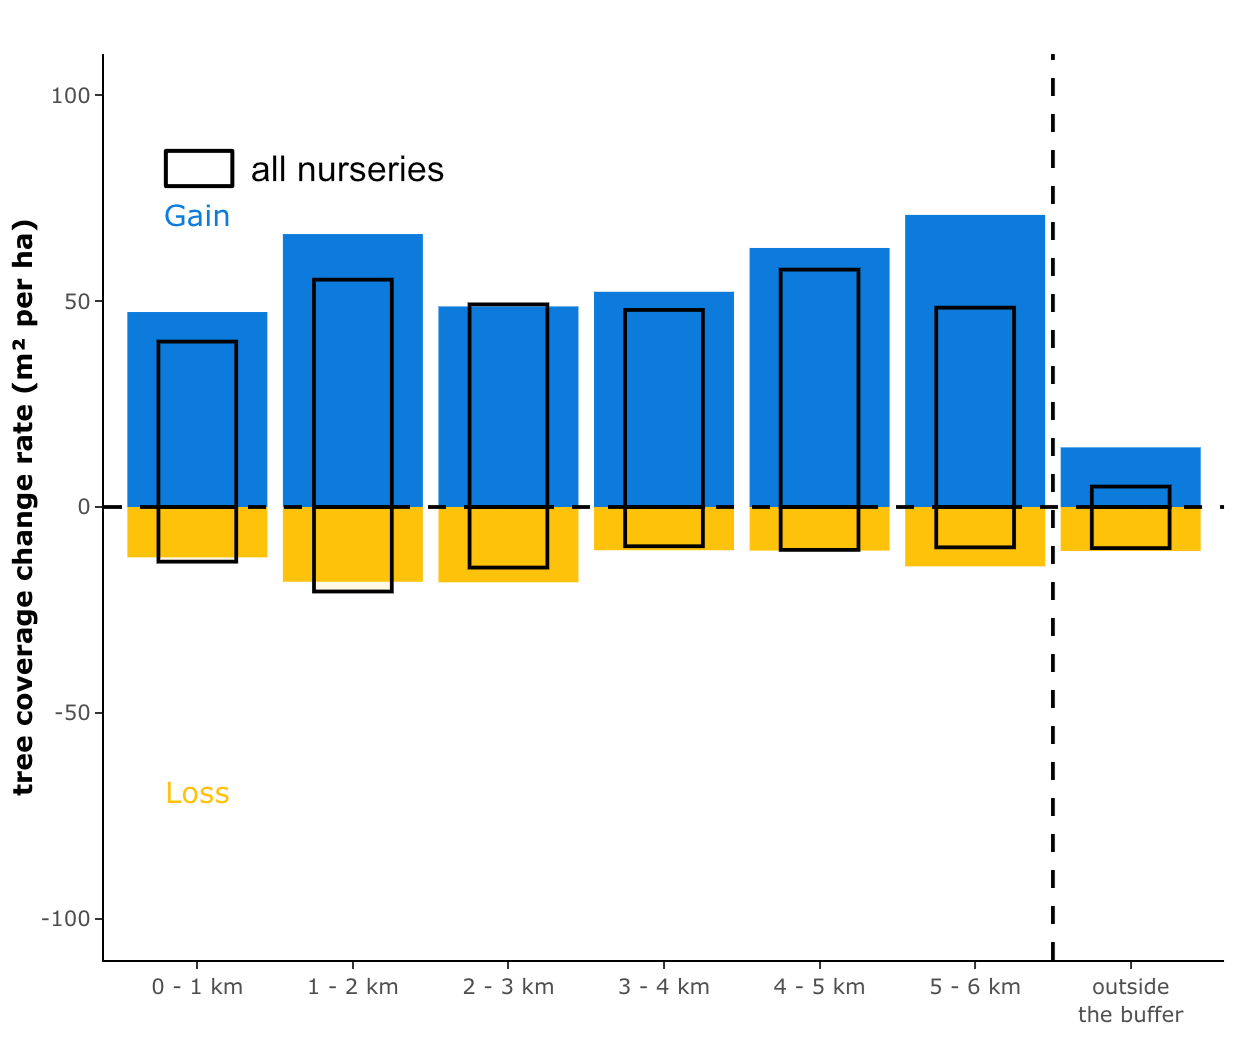
Some nurseries have been designated with “super” status, meaning they produce double the number of tree seedlings compared with other nurseries (120,000 per year compared with 60,000 per year). Comparing results for super nurseries to all nurseries, more tree cover gain is attributed to super nurseries than all nurseries (Figure 8). Tree loss values, however, are comparable to non-super nurseries (except for buffer zones less than 2km from nurseries, which are lower than all nurseries combined).
Figure 8: Tree coverage change rate for buffer areas around tree planting “super” nurseries. Black outline boxes show values for all nurseries.
Validation of method and results
We used Global Forest Watch to validate our methods and results using the Mbale district. However, as explained by Global Forest Watch, “due to variation in research methodology and date of content, tree cover, gain, and annual loss data sets cannot be compared accurately against each other. Accordingly, ‘net [difference]’ cannot be calculated by subtracting figures for tree cover gain from the annual tree cover loss data set” using Global Forest Watch.
When comparing tree loss and gain separately, between 2016 and 2021, Global Forest Watch calculates a total tree loss of 174 ha, whereas we found 73 ha between 2016 and 2022 (Table 1). Global Forest Watch does not have data for us to easily compare our tree gain data to, however, between 2000 and 2020 it estimates a tree gain of 684 ha (Table 2). Between 2016 and 2022 we found 268 ha using our method.
Table 1: Tree loss values between Global Forest Watch and our method for Mbale district, Uganda
| Method | Period | Tree loss (ha) |
| Global Forest Watch (Hansen/UMD/Google/USGS/NASA) | 2016 to 2021 | 174 |
| DSC Sentinel-2 | 2016 to 2022 | 73 |
Table 2: Tree gain values between Global Forest Watch and our method for Mbale district, Uganda
| Method | Period | Tree gain (ha) |
| Global Forest Watch (Potapov, P. et al 2022) | 2000 to 2020 | 684 |
| DSC Sentinel-2 | 2016 to 2022 | 268 |
The differences between our values and those of Global Forest Watch are likely because of the difference in data resolution, methods, and that we use two time periods, whereas Global Forest Watch uses yearly changes. We are confident that our findings are valid and our consistent methodology for tree loss and gain means net change can be calculated, which is not possible using Global Forest Watch. In the future we would aim to calculate yearly changes to further validate our tree loss findings to Global Forest Watch.
Concluding remarks
Here, the stakeholder need was to help the Welsh Government quantify the impact of the Mbale Trees Programme on tree cover change. The main finding from this work is that between 2016 and 2022, there appears to have been a positive net change in tree cover in eastern Uganda. Furthermore, we found that the greatest positive change in tree cover occurred near to Mbale Tree Programmes nursery locations. It is important to recognise that this signifies correlation – but cannot directly be used to say that the programme was definitely a contributing factor to increased tree cover, though this result has some promise. To establish this causal relationship, a comparison between known areas of tree planting through the Mbale Trees Programme should be compared with a baseline area.
Because of the resolution of Senintel-2 data (10m), we are unable to identify small areas of trees, or single-tree canopies, that may be more likely to have been planted through the programme. To account for these, higher resolution satellite images (sub-metre resolution) would be needed. In addition to this, to confidently know whether the identified trees were those planted through the programme, precise ground truth data would also be needed. These data would then also allow us to perform a more in-depth analysis too, such as success rate for different species types. In the last few years, the Welsh Government has made improvements to the field data they collect, meaning that this more detailed analysis might be possible in the future.
We thank the Welsh Government for bringing our attention to this issue and providing us with the relevant information required to complete this work. If you have any questions about this project or any of the work referenced here, please contact the Data Science Campus on datacampus@ons.gov.uk.