Counting cows in South Sudan
Tuesday 20 October 2020 is World Statistics Day and it has the theme “Connecting the world with data we can trust”. The theme will reflect on the importance of trust, authoritative data, innovation and the public good in national statistical systems.
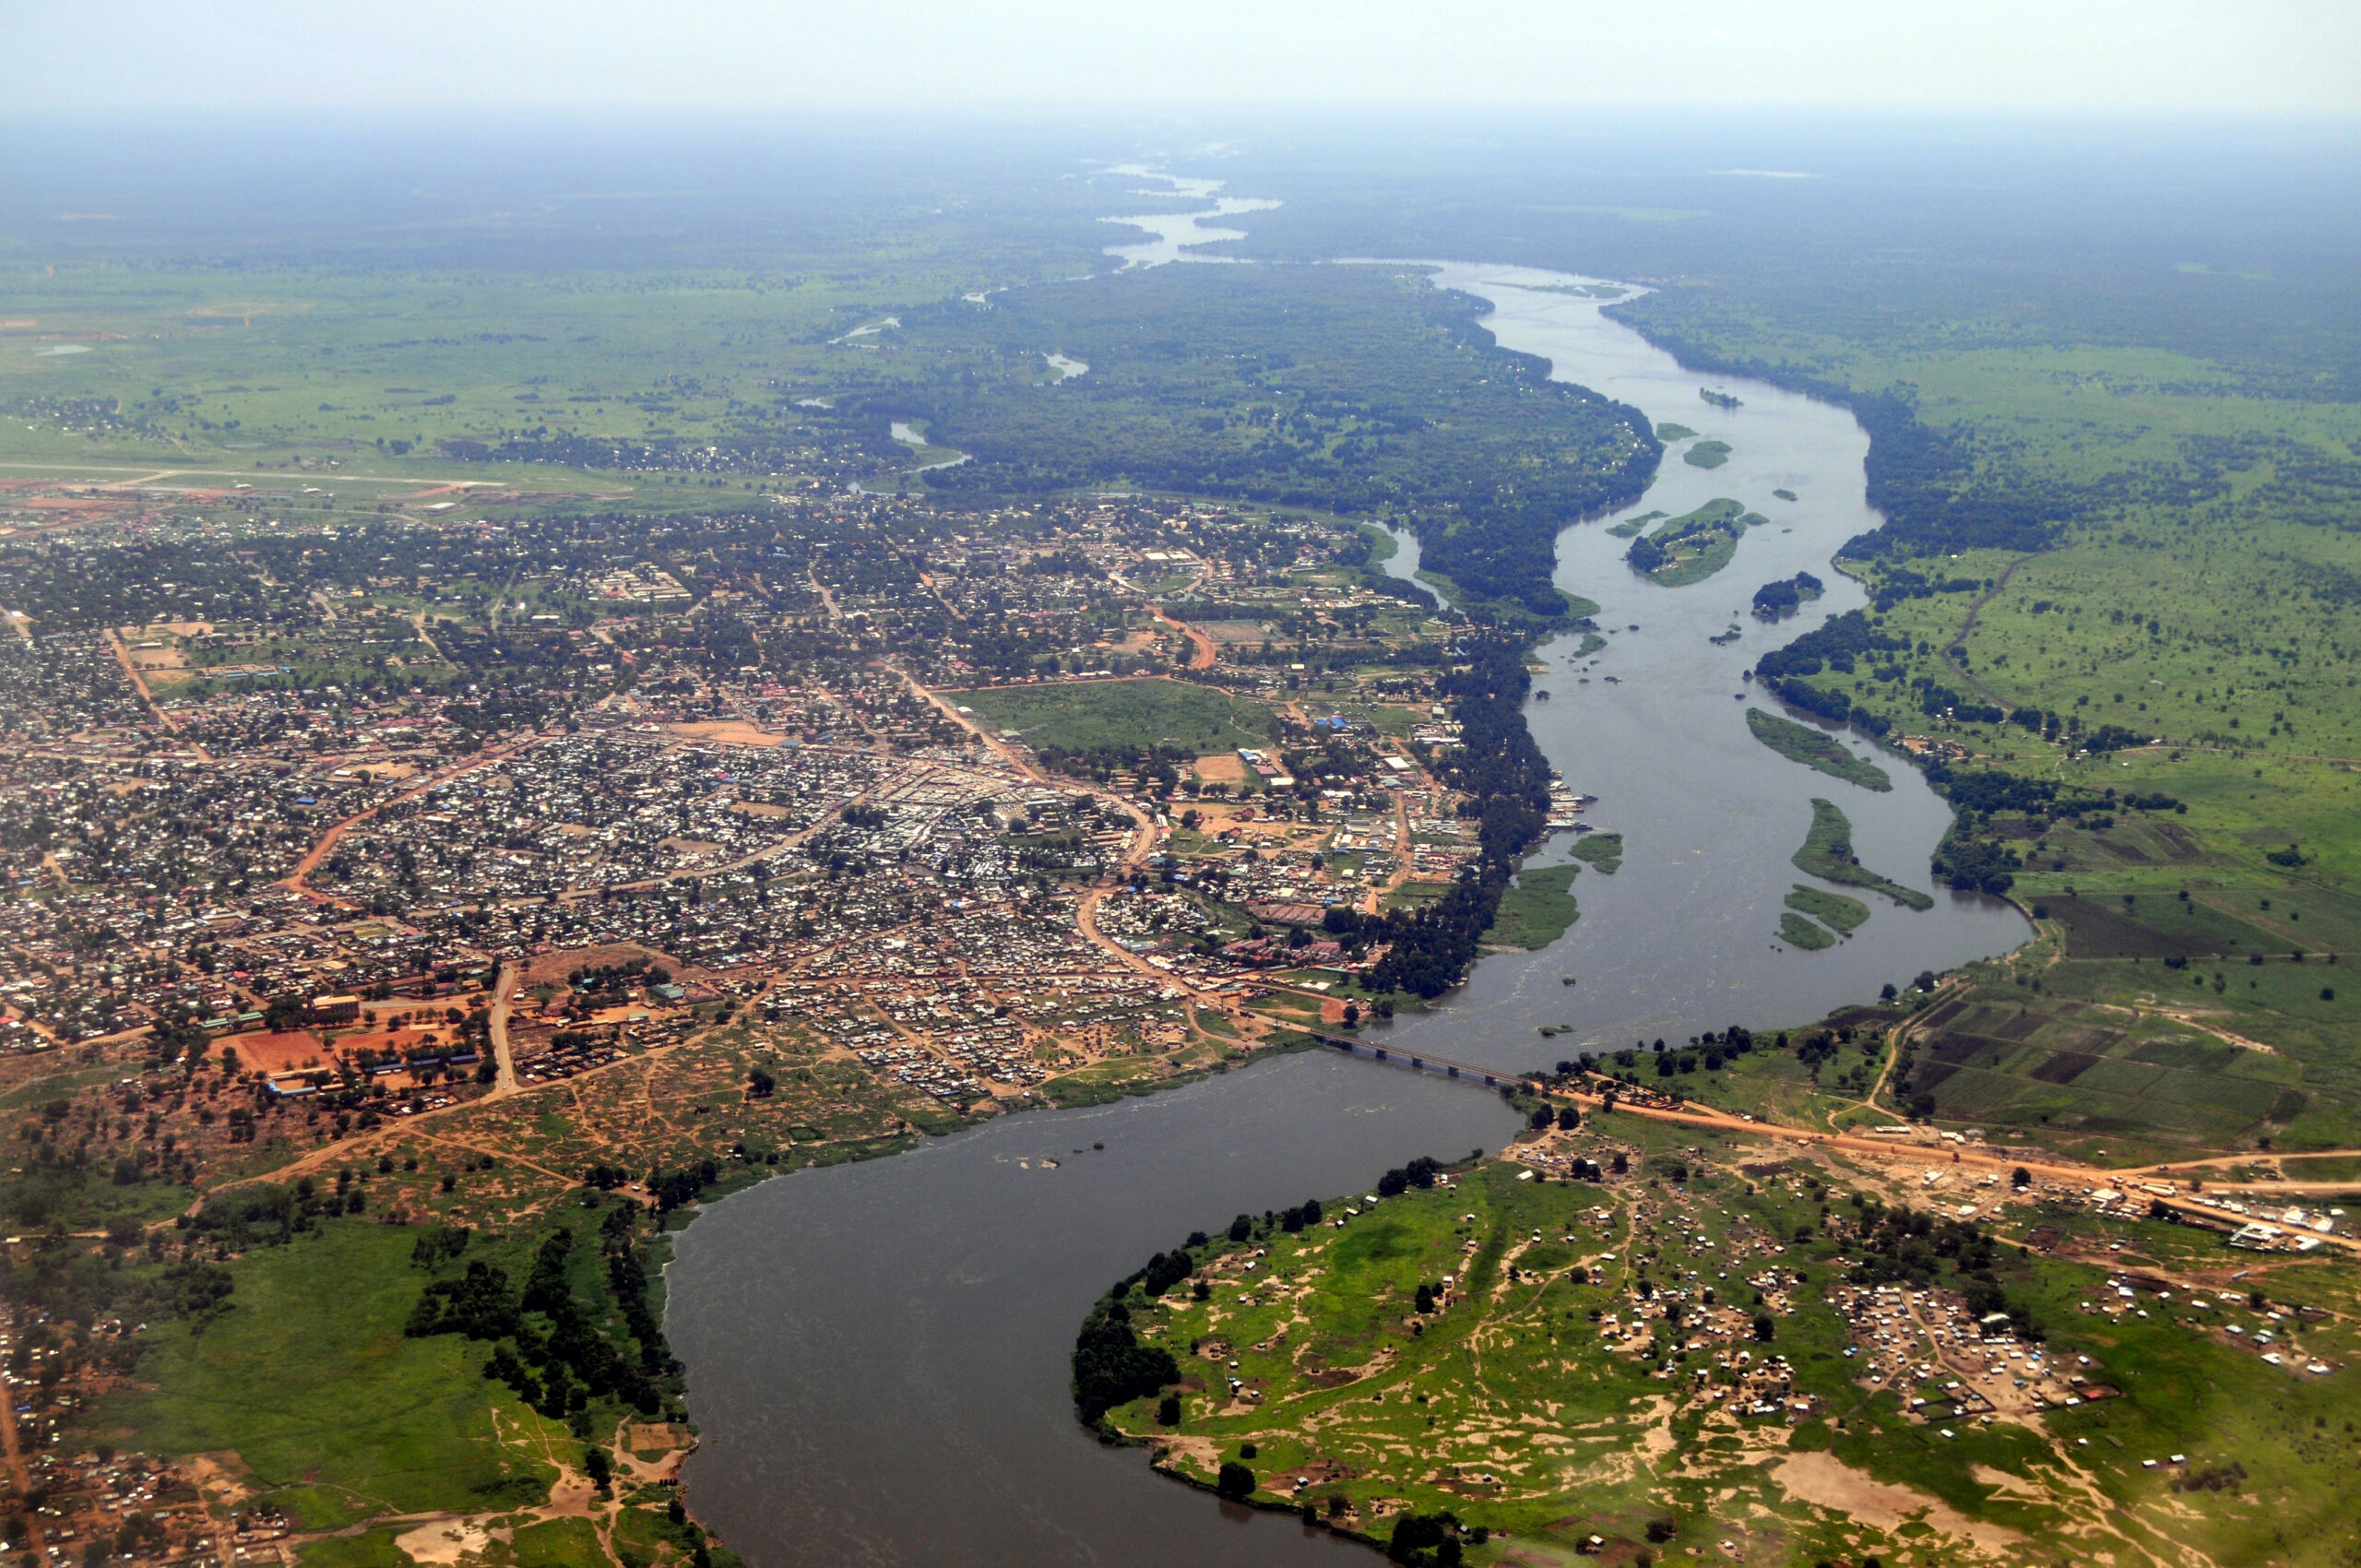
In this blog post, our Office for National Statistics (ONS) and Foreign and Commonwealth Development Office (FCDO) Data Science Hub talks about exploring an innovative way of conducting a cattle census in South Sudan using satellite imagery.
Introduction
The ONS and FCDO Data Science Hub was set up in 2019 to promote the use of data science in international development by producing analytical tools and providing training and mentoring in data science to partner organisations. The team’s work applies data science to help low- and middle-income countries work towards achieving the Sustainable Development Goals (SDGs).
One of our first projects has been to explore the possibility of conducting a cattle census in South Sudan using satellite imagery. Livestock are critical to the livelihoods of millions of South Sudanese, but the current livestock population is largely unknown as the last livestock census was conducted in the 1970s.
New cattle estimates would allow a more accurate assessment of the contribution of livestock to South Sudan’s economy. This would be useful to a range of stakeholders including the South Sudanese Government, the World Bank, and the International Monetary Fund. Other potential users include the UN Food and Agriculture Organisation (FAO), non-governmental organisations (NGOs) working in providing animal health services, and the UN Mission in South Sudan (UNMISS) who are keen to understand the role of the livestock economy in driving conflict.
The current context in South Sudan makes it difficult to conduct a traditional livestock census, therefore, the possibility of using satellite imagery to do it remotely is appealing. And, if successful, there might also be significant cost savings over the previous methods.
New methods inevitably bring new challenges. An important one in this situation is the sensitivity of the location of the cattle because of the risks of cattle raiding. So, while the methods proposed are to identify individual herds during the model design stage, the intention is to keep the final analysis at an aggregated level.
Acquiring imagery
The first step was to determine if suitable imagery could be acquired from various commercial and free suppliers. To do this, we considered the following issues:
- Coverage in South Sudan: are rural areas of South Sudan already being captured and, if not, could areas be imaged on request to the supplier? How frequently were images captured and for which times of day and periods of the year?
- Resolution of the imagery: are individual or groups of animals visible on the images? Are the cattle camps (temporary corrals) visible?
- Image access: does the imagery supplier include an API we can use to develop a pipeline to acquire analysis-ready images for our areas of interest?
- Cost: what is the cost of the imagery for both archive access and for new acquisition? What is the smallest continuous area that can be purchased?
After our initial review of the available imagery, it was clear that the best approach would be to base the analysis on cattle camps – the corrals in which the cattle are held overnight and which, particularly during the dry season, the large herds may be in for weeks at a time. The approach aims to use different resolutions of imagery for different purposes, as shown in Figure 1.
Figure 1 – Proposed method to estimate livestock numbers in South Sudan from satellite imagery
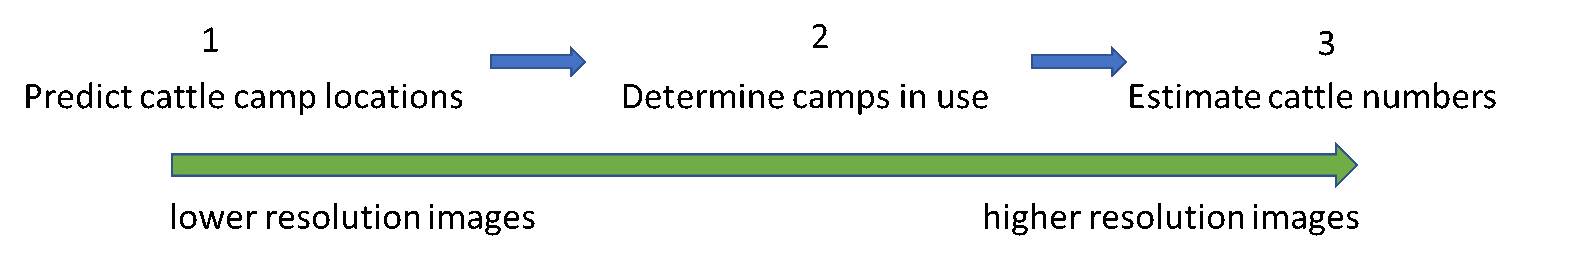
This approach has benefits in two areas: cost, and computer storage and processing. The low-resolution images are freely available, and these could be used to sift out the large areas of the country with no cattle camps. This reduces the area for which we would need to pay for expensive high-resolution images. In addition, maximising the use of lower-resolution images dramatically reduces the storage space and processing power that we needed to cover the whole country.
Sentinel 2 imagery
We began our investigation into detecting cattle camps from lower-resolution (10 metre) Sentinel 2 imagery supplied by the European Space Agency. We created a training dataset of cattle camps from two sources: an initial set of example locations of cattle camps supplied by UN FAO, and manual identification of similar sites on satellite imagery available on Google Earth. Next, we verified these sites were visible on the latest Sentinel 2 images and captured polygons to build the training dataset. From visual inspection of the Sentinel 2 imagery, it was clear that the cattle camps could be distinguished from the surrounding landscape by the bare nature and lack of vegetation.
Next, the team extracted the Sentinel 2 imagery pixel values for cattle camps and compared with sample polygons placed in the surrounding landscape. We looked at the distribution of pixel values of red, green, blue, near-infra red wavelengths. We also used derived indices indicating vegetation cover calculated from the imagery bands. Seasonality was important as the de-vegetated cattle camps have a much greater contrast with the surrounding landscape during the wet season. However, it is harder to acquire a cloud-free satellite image during the wet season, so the end of the wet season (around November) was a good compromise.
We then developed a model to predict camp locations using a simple pixel-by-pixel classification method. The main corralled area of a cattle camp is quite small (0.5 to 4 hectares), so an appropriate method was chosen considering how many 10-metre pixels comprise a camp. This produced an output that indicated the probability that each pixel was part of a cattle camp. After that, we cleaned this initial output combining large and small kernel filters to emphasise the small cattle camp areas.
When we tested the model against cattle camps and sample areas of the surrounding landscape unseen during training of the model, we found we could predict the location of cattle camps with over 90% accuracy.
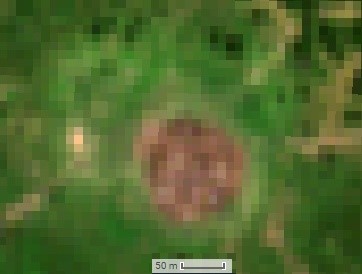
Figure 2 – Sentinel 2 10-metre resolution red, green, blue true colour visualisation of cattle camp in wet season (left) and dry season (right)
Having successfully shown we could identify the locations of cattle camps, we proceeded to the second stage: the feasibility of determining when a cattle camp is in use and when it is abandoned. We used medium three-metre resolution images from the supplier Planet. Planet re-images all of South Sudan every two to three days, so the team analysed a time series of images to see the changes in texture that we would expect to see from the disturbance by cattle when a camp is in use.
This technique shows promising results. We now hope to validate these results with ground truth data. This will involve visits to a sample of cattle camps to determine the range of dates when they were active to compare with results predicted from the satellite images.
Next steps
This final stage will require the highest-resolution satellite images (0.3 metre or 0.5 metre), such as those supplied by Maxar. But, having determined the location of active cattle camps in stages one and two, we will be able to focus our resources on requesting and purchasing images in the appropriate areas.
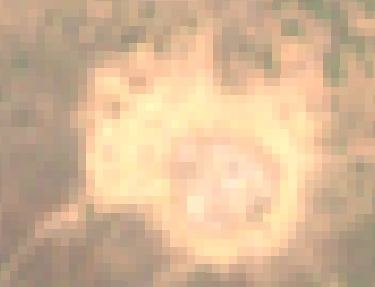
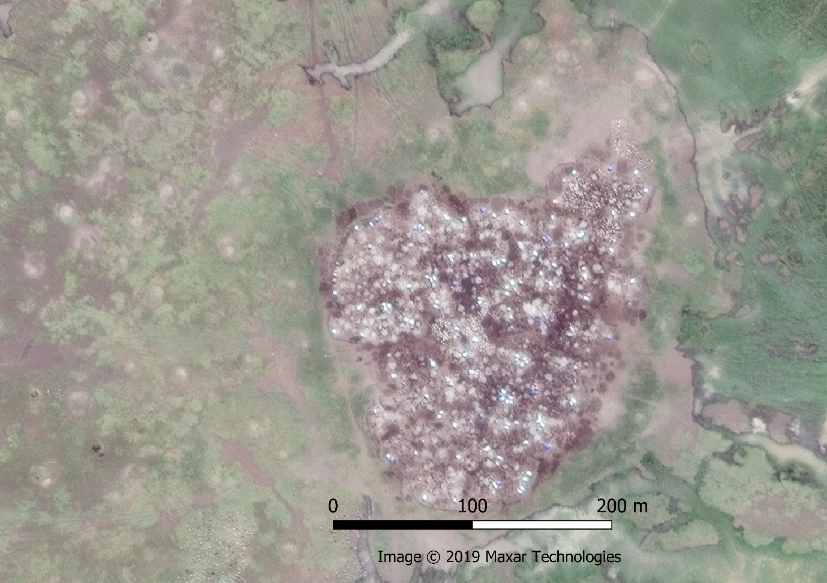
In Figure 3, it is possible to spot fire rings, structures and groups of animals. Local information provided so far indicates the camps have a consistent way of corralling the cattle, so the numbers they contain could be estimated by summing relevant areas discerned from the high-resolution images.
Figure 3 – Cattle Camp seen on pan-sharpened 0.5 metre image from Maxar showing campfires and structures in the camp and, in some locations, individual cattle
This stage will require site visits to a sample of camps to estimate counts of animals and high-resolution imagery capture over the camp. The timings of site visit and imagery capture need to be coordinated to occur as closely together as possible. By combining the features seen inside the camp from the high-resolution imagery with the sample field surveys, we plan to develop a model to estimate a count of animals.
The FCDO’s East Africa Research Hub has now allocated funding to purchase high-resolution satellite imagery and to conduct the sample field surveys for the ground truth data. This will enable us to work on the final stage of this work in early 2021.
Authors
Tom Wilson, Data Scientist, ONS FCDO Data Science Hub
Tim Harris, User Engagement Lead, ONS FCDO Data Science Hub
2 comments on “Counting cows in South Sudan”
Comments are closed.
Congratulations Tom and your team.
This is an incredible research work and very important to complement official statistics.
Quick questions:
1- Do you know how much the 0.5 meter resolution imageries that cover all comps in the country will approximately cost you?
2- Do you have plans to expand this work in other countries after South Sudan?
Hi Dominique. Thanks for your questions and interest in this work. Can you email datacampus@ons.gov.uk and we will put you in touch with Tom directly? Kind regards, Gareth