Extracting text data from business website COVID-19 notices

Coronavirus (COVID-19) and related measures have had a severe impact on the UK economy. By May 2020 the Business Impact of COVID-19 Survey (BICS) had shown that around one in four businesses had temporarily stopped trading.
Estimates of economic activity often depend on survey data. Those who respond to surveys may have different characteristics from those who do not respond. In turbulent times such as the COVID-19 pandemic, we cannot be sure whether the businesses who do not respond to surveys are still active or are not responding because they have ceased trading. Both these issues can affect the quality of those estimates.
A wide range of data sources are used by the Office for National Statistics (ONS) to better understand the state of the economy. In this work, we used text data from over 500,000 business websites to inform survey response-chasing efforts and gain insight into the impact of COVID-19.
Here we discuss analysis of a dataset, provided by private sector partner glass.ai, consisting of text related to COVID-19 extracted from UK business websites. This work represents one part of a project combining data from various sources to aid ONS business survey-response chasing efforts.
We do not present statistical outputs or draw conclusions about the wider population of UK businesses. Relevant statistical outputs based on a fortnightly survey of businesses can be found in Coronavirus and the economic impacts on the UK.
As this project relied on data from the web that is then linked to official sources, rather than a random sample, we found that some industrial sectors were under-represented. This can be further compounded by differences in how different businesses use their websites for communication. For example, construction sector websites are both under-represented in this online data collection and less likely to use their websites to communicate about COVID-19.
To build our understanding of the data source we applied several natural language processing techniques. Having applied topic modelling approaches we found some apparent topics for the COVID-19 text that conformed to our expectations about likely communications, such as announcing temporary closures or presenting government advice. We also trained a text classification approach to attempt to infer whether a text snippet was likely indicating business closure. Classifier performance was reasonable but not at a level that could be used to reliably compare sectors.
Analysis of business impacts of COVID-19 is an active area of inquiry such as the work of Nesta, Measuring the economic Impact of COVID-19 in the UK with business website data, presented at an Economic Statistics Centre of Excellence webinar. In their work, business website data are combined with Google search trends to highlight the differences in the challenges faced by different UK regions.
Data collection
Data for this project were provided by private sector partner glass.ai who have built a smart resource crawler that identifies UK business websites. Their systems are able to collect various types of business data. For this project, text related to COVID-19 was extracted from the websites of around 500,000 UK businesses. The extraction process was repeated on a monthly basis from late April 2020 to September 2020.
Text data were extracted using a set of manually defined keywords and phrases, for example: “Covid”, “lockdown”, and “government advice”. This helped to avoid picking up data that were not relevant to the project.
The keyword approach kept our data focused on COVID-19, but it does have limitations. The context of the lockdown and COVID-19 measures is often assumed so some website notices do not include obvious keywords even when the text is addressing their response to the virus.
For this project we only used data from websites that the supplier was able to link to a company registered with Companies House.
The data source consists of around 500,000 records, of which text related to COVID-19 was found for approximately 70,000.
Comparing the glass.ai population with the Business Register
It is important to note that these data are not a random sample of all UK businesses. To better understand potential sources of bias and coverage issues, we compared counts of firms by Standard Industrial Classification (SIC) 2007 and employment size band with those that we would expect to see if these data were a random sample of the population of businesses found on the Inter-Departmental Business Register (IDBR).
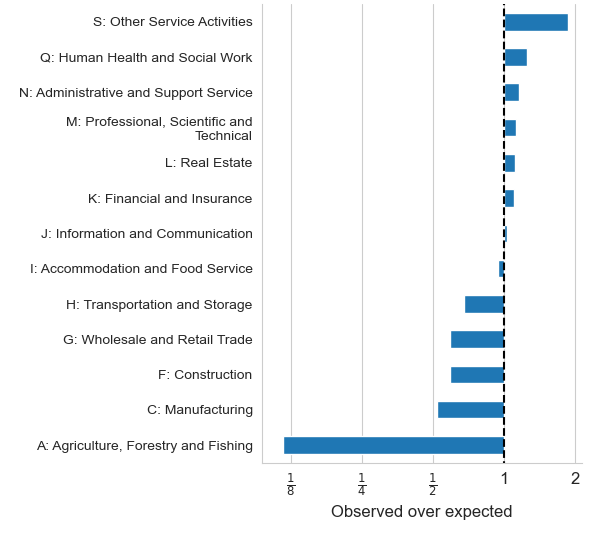
Figure 1 shows top level SIC sections where the online based data source over and under-represents. We limited the plot to those SIC sections where we would expect at least 10,000 websites in the data were it a random sample from the IDBR. The plot shows what was observed relative to what would be expected for each section. Cases where a website could link to multiple SIC sections based on reporting unit were ignored.
“Construction”, “manufacturing”, and “agriculture, forestry and fishing” are all significantly under-represented in the data. The examples of over-representation are less extreme, although businesses in “other service activities” do occur close to twice as often as would be expected if the data were from a random sample.
Figure 1: Over- and under-representation of specific Standard Industrial Classification (SIC) 2007 sections
COVID-19 notices
Different businesses use their websites in different ways, with some more likely than others to use their website for COVID-19 communication. For example, a large museum with thousands of potential visitors may frequently update their website, while a small business operating a few contracts with other businesses may not. Separating the propensity for communication from the impact would be difficult and is an issue that other researchers in this area have identified. Addressing this challenge is beyond the scope of our current work.
The limitations of coverage and differences in communications between businesses prevented us from being able to make inferences about the general population of businesses from the data.
It is also not always clear from the text on a website how severe the impact on a business is. While some notifications are unambiguous, many refer to specific impacts that would need further context to interpret. For example, closure of physical premises could effectively close off all revenue for some businesses, while others would be able to continue trading online at similar levels to before.
Ethical considerations
Collecting business data from websites does come with its own set of ethical considerations. For this project:
- data collection was targeted
- burden on websites was minimised (no deep crawls, no frequent visits)
- web etiquette was followed (for example, obeying the robots.txt file)
The ONS Web Scraping Policy covers many aspects of how we implement automated data collection from the web. Because of the urgency related to the COVID-19 pandemic, an exception to the notice period was applied following Section 5.2 of the Policy. This case was explained on the ONS website, inviting website owners to discuss any concerns they may have.
Use of websites for COVID-19 communication
Within our dataset of around 500,000 UK business websites, mentions of COVID-19 or related terms were identified in about 14% of cases. This proportion was relatively stable over time, although there were differences in terms of industry sector (see Table 1).
In Table 1 the percentage of websites in each SIC section with COVID-19 matching text are shown. Note, we only show here a selection of SIC sections with a high number of records in the late May 2020 data collection. “Manufacturing” and “information and communication” had roughly an average amount of COVID-19 matching text on websites. “Construction” (6%) was well below average while, as would be expected, “human health and social work activities” (31%) were well above average.
There are likely to be industry specific factors that influence how businesses use their websites, so differences here do not necessarily imply differences in terms of impact. Here we are only considering matching text in general, regardless of whether the text is positive (such as “business as usual”) or negative (such as “temporarily closed”).
For most of our analysis we first linked to the Inter-Departmental Business Register (IDBR); this reduced the dataset down to 360,000 websites.
Table 1: Percentage of websites within each selected Standard Industrial Classification (SIC) 2007 section with COVID-19 related text, late May 2020 data collection
| SIC section | Percentage with text matching COVID-19 keyword |
| Q: Human Health and Social Work Activities | 31 |
| P: Education | 25 |
| S: Other Service Activities | 21 |
| G: Wholesale and Retail Trade | 18 |
| I: Accommodation and Food Service Activities | 16 |
| N: Administrative and Support Service Activities | 13 |
| C: Manufacturing | 13 |
| M: Professional, Scientific and Technical Activities | 12 |
| J: Information and Communication | 11 |
| F: Construction | 6 |
COVID-19 notice language analysis
The COVID-19 related text was classified according to trading status, based on the vocabulary of the matching text. While this approach was able to score text by how likely it is that the corresponding business was closed, there were many cases of scores that did not correspond well with the underlying ground truth (defined for a subset by manual inspection and survey data).
To better understand the use of language in the snippets of text matching COVID-19 keywords, multiple techniques were applied:
- manual inspection of random samples
- counts of key terms and phrases
- automated detection of key terms and phrases
- topic modelling
- model-based classification of snippets
To get an idea of what businesses are including on their websites in relation to COVID-19, the Data Science Campus tool pyGrams was used to identify key terms and phrases in the text snippets. The pyGrams tool encapsulates several natural language processing techniques.
The top 20 key terms identified using TF-IDF (Term Frequency-Inverse Document Frequency) vectors were:
- “statement”
- “response”
- “announcement”
- “close until further”
- “covid19”
- “our response”
- “news”
- “late update”
- “stay safe”
- “guidance”
- “policy”
- “important information”
- “faq”
- “business usual”
- “service update”
- “important update”
- “we temporarily close”
- “business update”
- “lockdown”
- “all our customer”
Text is standardised before processing so, all words are lowercase, some common words like “as” or “the” are removed, and words are lemmatized, for example, “closed” can become “close”. At this level terms are mostly indicators that the text block is related to COVID-19 response.
Some key terms are more likely to indicate business closures (for example, “close until further” is likely to come from “closed until further notice”) while others are more likely to indicate continued trading (for example, “business as usual”). These are mixed in with terms that do not seem as likely to imply a positive or negative, such as “statement”, “response” or “announcement”.
There are many records without clear indicator phrases, which motivated us to try topic modelling and text classification.
We applied two standard topic models to the COVID-19 text data: Non-negative Matrix Factorisation (NMF) and Latent Dirichlet Allocation (LDA). Of the topics identified by these approaches, some seemed to fall into identifiable categories:
- closures of businesses (or premises thereof)
- deliveries
- job retention scheme
- business as usual
This is in line with manual inspection of the snippets. While these topics are reasonably well formed, using them to interpret individual records was often not clear cut. We also didn’t apply any special treatment to the keywords used to find the initial text, so the choice of keywords is likely to influence the topics discovered.
After developing our understanding of the data, we sought to train a model to classify notices according to trading status. Two separate datasets were used to train classifiers:
- Manually labelled notices (1,500)
- Trading status from BICS microdata
The intention was to provide an indication of how likely a snippet was to indicate a severe impact to the business along with an understandable explanation of why. This model provides coefficients for individual vocabulary terms, so for any output the main words or phrases leading to a classification can be presented.
In both cases the model treats the text as a bag of words and effectively scores each word based on whether it tends to be associated with business closures. The model applied was binary logistic regression (with L1 regularisation) applied to normalised TF-IDF vectors of words and word pairs present in the text. Here, L1 regularisation acts to reduce coefficients of unimportant terms to zero, which makes the explanation of the result from the model simpler.
Model performance was reasonable, with a cross-validated Area Under Curve (AUC) over 0.8, although the level of class imbalance means that it is hard to achieve a high level of precision in the classifications without dropping recall substantially. From the distribution of scores for unseen data, it was clear that there were many cases that the model was not able to score correctly. This is likely to be because of some combination of the amount of text available and ambiguous or unusual vocabulary.
To make significant improvements we would likely need to label more data, and possibly switch to a more sophisticated model that is able to go further in terms of parsing language rather than simply relying on the presence of terms or phrases.
In the aggregate the model does show general trends, but without having a clear understanding of biases in the significant number of misclassifications, it would be too much of a leap to draw wider inferences.
Discussion
Data extracted from websites has a broad range of applications and has several important benefits. For example, collection tends to be low burden and the nature of that collection allows for timely analysis. Within the ONS, there are several projects that make use of data from the web in different ways. These range from targeted collection, such as is the case for collecting price data, to more exploratory research projects, such as understanding the characteristics of high growth companies.
As part of developing our understanding of the text data extracted from business websites, we were able to assess how different businesses, from various industrial sectors, use their websites to communicate their response to COVID-19 and related measures.
Working with data extracted from websites is not without difficulties. Consideration needs to be given to how representative the data are of the wider population. In this project, linking to existing registers allowed us to quantify the extent of the relative over- and under-representation.
To extend the work done so far to be able to make inferences from a model-based classification of COVID-19 related text, there are a number of areas that would need to be addressed:
- model performance: collecting a larger training set and possibly moving to a more sophisticated model that is better able to handle language semantics
- establishing model performance by SIC, or at least assessing whether there is bias in the model (for example, if some areas use less ambiguous language); this would be helped by a better understanding of the failure modes for the model
- increase coverage of the IDBR: there are likely many companies that are not in our current dataset where it would be possible for us to pick up data for them
- looking at weighting any outputs by SIC or employment size band
- measuring any drift in the model: over the course of the pandemic, the language used and the issues addressed by businesses have changed and this is highly likely to affect model performance over time
Acknowledgements
The authors would like to thank Juan Mateos-Garcia and Alex Bishop from Nesta for their insights into working with business website data.