Using data science to help inform regional broadband investment

The Office for National Statistics (ONS) Data Science Campus has delivered a suite of tools and code to North of Tyne Combined Authority (NTCA) to support their work to prioritise broadband infrastructure improvements in the region.
Upgrading broadband infrastructure across the UK is a priority for the government, with a target set for gigabit broadband to be available nationwide by 2030. 85% of premises are expected to meet this by 2025. Local government institutions play a very important role in allocating investment for infrastructure improvement, especially when working with the private sector to identify potential interventions in areas that are more challenging to upgrade.
To help NTCA with this task, we were asked to support with visualisation and analysis of broadband data for the region. NTCA incorporates the local authorities of Newcastle upon Tyne, North Tyneside, and Northumberland. The aim of the project was to help NTCA identify current levels of connectivity at a very granular subnational level and use different tools and data to identify areas that might benefit most from interventions. Although a significant amount of data are currently openly available from the Office of Communications (Ofcom), NTCA wanted to gain additional insight from these data based on their particular policy context. For example, understanding the implications of connectivity on labour market participation, skills and rural productivity.
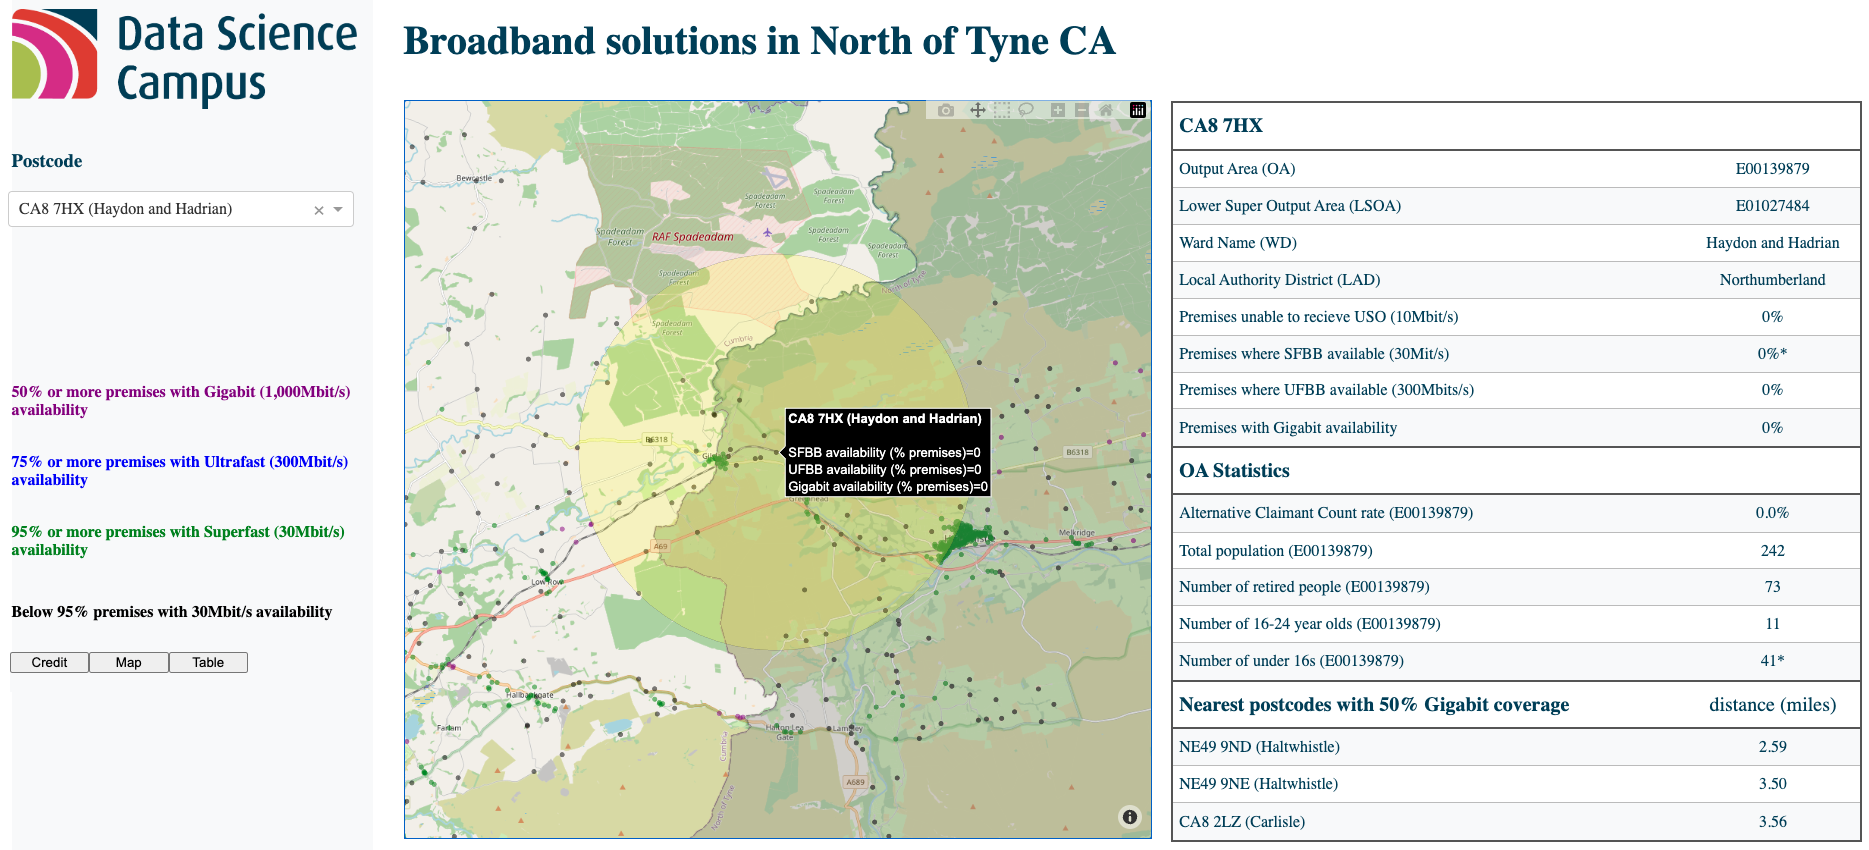
A main challenge NTCA and local institutions face is in identifying viable infrastructure solutions and installation sites (in the case of fixed-wireless access), which are important in improving households’ access to higher speeds. From the outset, 30Mbit/s per premises was agreed by NTCA as a ”minimum” acceptable download speed for citizens to fully access the opportunities in our modern, digital society. In order to inform decision-making in this area, we have provided NTCA with an interactive tool developed using Dash (Figure 1). This tool allows NTCA to search for any postcode within the combined authority area. It shows a range of broadband metrics alongside other data relating to the population in the postcode’s output area (OA). In addition to the service levels for the selected postcode (and all surrounding postcodes), the radius to the third-nearest postcode where at least 50% of premises have access to gigabit capability is highlighted (a requirement from NTCA).
Presenting the data in this way highlights areas that do not have gigabit-capable broadband but are relatively close to those that do. In addition, the tool has helped NTCA understand the impact of the Northumberland geography on the distribution of broadband access, including factors such as how rural different places are. The visualisation also helped to identify areas with relatively large numbers of premises without access to lower speeds such as 10Mbit/s (the Universal Service Obligation) and 30Mbit/s (Superfast Broadband download speeds).
Figure 1: Screenshot of the NTCA dashboard showing details for a selected postcode
To give a better picture of broadband connectivity over time, we also delivered detailed local metrics to show how broadband availability has changed in the last year. This showed significant increases in gigabit broadband availability in wards within the Newcastle upon Tyne authority. However, it also demonstrated relatively slower progress in reducing the number of premises that are limited to accessing speeds of 30Mbit/s or lower.
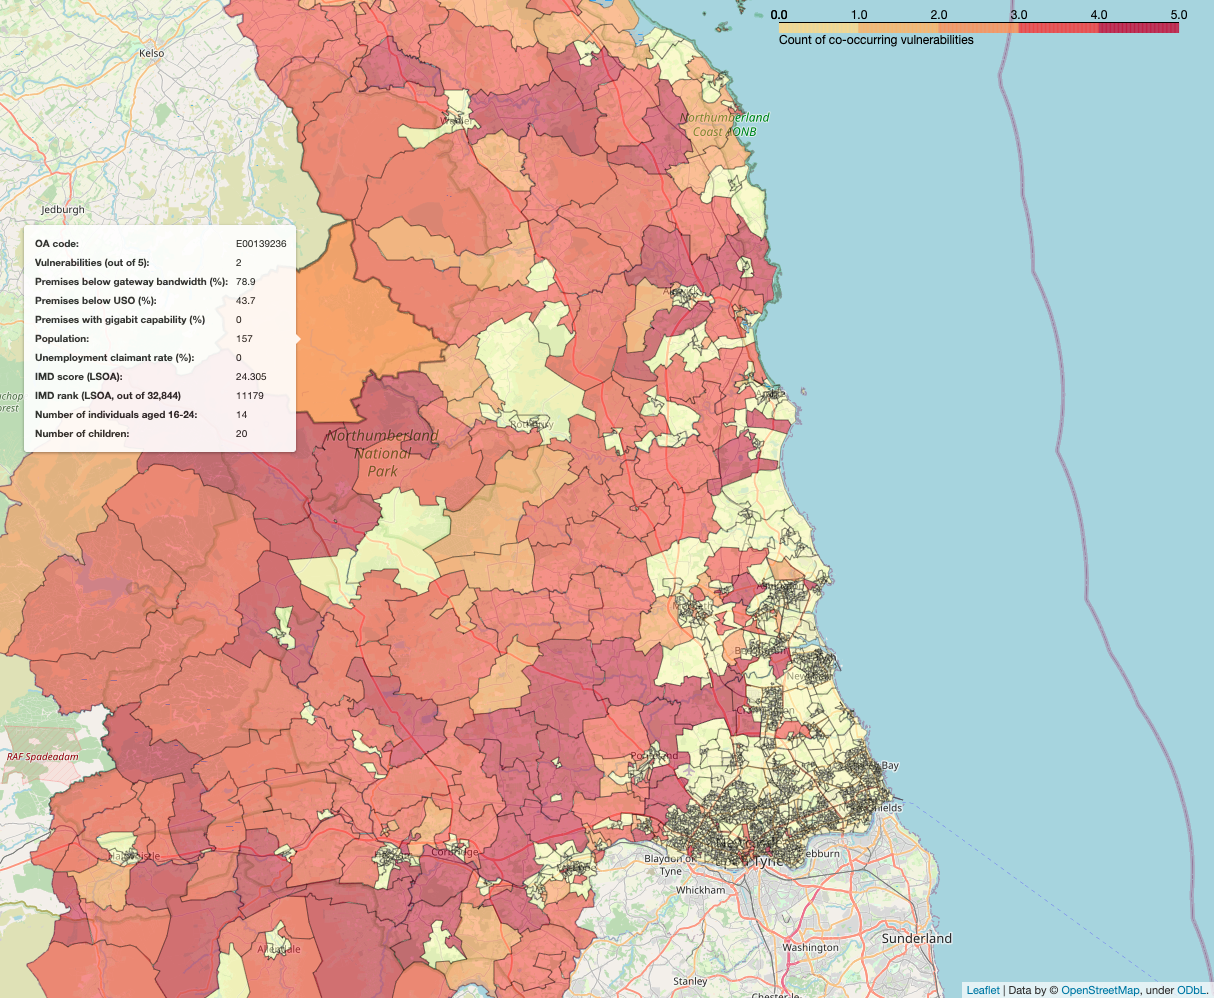
Finally, to help NTCA assess which areas might benefit the most from any interventions, we presented broadband data together with other demographic and socio-economic data that NTCA wanted to consider. These were presented in both the dashboard and a separate suite of interactive map visualisations. One of these visuals shows the co-occurrence of vulnerability indicators in areas where broadband coverage is poorest (Figure 2). We initially looked at the following five indicators:
- any premises below Universal Service Obligation (10Mbit/s)
- 10% or more premises below 30Mbit/s
- at or above national average unemployment claimant rate
- 25 or more young people (aged 16 to 25 years)
- 25 or more children (aged under 16 years)
Note: for an area to score, one or both of the top two broadband indicators must be triggered.
Figure 2: Screenshot of interactive visualisation for NTCA showing the co-occurrence of vulnerability indicators at OA level
This has provided NTCA, and its constituent local authorities, with greater insight into their areas and helped inform deployment plans. The code allows flexibility for other indicators (such as long-term ill-health or ethnicity) to be added alongside broadband service levels and we have enabled NTCA colleagues to continue to develop the code as priorities change. Both the dashboard and interactive visualisations have been adopted by NTCA as a tool to support their ongoing work around connectivity.
For further information on the project work undertaken for NTCA, or to get in touch with us about how this work might be able to support other local institutions in the UK, please email datacampus@ons.gov.uk.