Mapping HIV risk in Côte d’Ivoire, West Africa
In Côte d’Ivoire the rates of new HIV infections are steadily declining but remain high in adolescents and young people. A national priority is to understand local patterns of HIV risk in adolescents and young people, so we’re working in an international collaboration to create a map of this risk at a sub-national scale. We’re using machine learning methods to leverage the high resolution of publicly available datasets to improve the spatial resolution of HIV testing data derived from nationally representative surveys. We’ve completed some preliminary analyses, which use historical HIV testing data to explore potential approaches and highlight the difficulties associated with accurately mapping HIV risk in space. We’re working to access more up to date HIV testing data and we’ll use these preliminary analyses as a starting point to plan our next steps.
Introduction
There were estimated to be 12,000 new HIV infections per year in Cote d’Ivoire in 2019 and although overall rates are steadily declining, levels remain high in adolescents and young people. HIV risk is driven by a complex range of socio-economic factors and access to the effective testing and treatment remains a key issue.
The 2018 Côte d’Ivoire Population-based HIV Impact Assessment (CIPHIA) survey provides nationally representative estimates of HIV levels, shown in Figure 1. These data inform national policy directions but are only produced every four to five years and aren’t as useful for planning local interventions. Several small area estimation initiatives are exploring the feasibility of more routine local level estimates. These initiatives use additional data sources to improve the resolution of national estimates. For example, the United States Agency for International Development (USAID) have developed tools to extend the data from Demographic and Health Surveys (DHS) and the UNAIDS Spectrum modelling initiative has been adapted to feed sub-national estimates for a range of key HIV indicators into their dashboard.
Figure 1: Nationally representative HIV prevalence estimates for Cote D’Ivoire
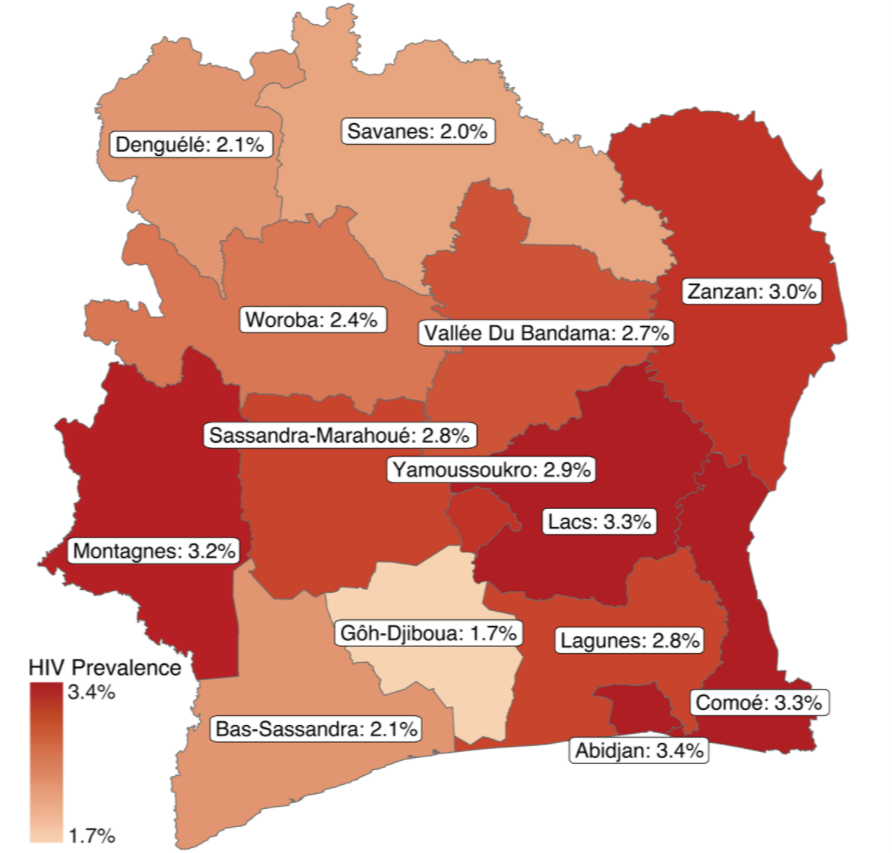
Source: CIPHIA summary sheet
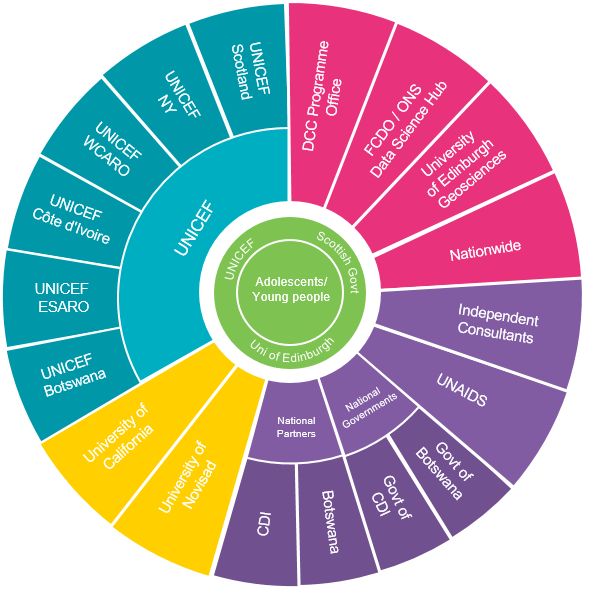
Our project, as part of the Data for Children Collaborative with UNICEF, aims to combine national HIV surveys with high resolution, publicly available data, to target local interventions more effectively. We’re working with people around the world, with representatives from UNICEF, The Data Lab, Scottish Government, the Ministry of Health in Côte d’Ivoire and many more organisations, shown in Figure 2.
Figure 2: Key organisations involved in our collaborative network
Our aim was to build on the USAID and Spectrum initiatives and use machine learning techniques to generate high resolution maps of HIV risk in adolescents.
Machine learning methods make fewer assumptions about the relationships between predictors and HIV risk than traditional small area estimation approaches, are generally faster and can handle bigger, more complex datasets. We are currently working with members of the National Program for the Fight Against HIV (PNLS) to access the 2018 CIPHIA data, which should be available soon. While we establish the data sharing agreements, we’ve based our preliminary analyses on historic HIV testing data from the DHS survey conducted in 2012 to explore the types of data and methods that we can use to model HIV risk.
Overview
The CIPHIA survey data are not publicly available yet (a timeline is available), so we have based our initial exploration and modelling on the DHS survey completed in 2012. The DHS program gathers HIV testing data alongside a range of socio-economic indicators such as education levels, health status and indicators of wealth. We explored a range of publicly available datasets to identify potential predictor variables. The DHS HIV testing and public data were mapped onto a common spatial grid and fed into a Random Forest machine learning framework. Our initial modelling outputs had very limited predictive power. In this blog we consider our next steps. We also reflect on how to apply what we’ve learnt so far in our current and future projects.
Data
The DHS program gathers HIV testing data alongside a range of socio-economic indicators such as education levels, health status and indicators of wealth. These surveys have a similar hierarchical structure to the PHIA surveys, where census enumeration areas are selected based on their population size and then a set number of households are randomly chosen. Random displacement procedures are used to anonymise the spatial data for each survey. We used the rdhs R package to load the DHS data into R and explore it.
An initial selection of publicly available spatial datasets was collated to provide indicators that were potentially associated with HIV prevalence. These are shown in Table 1. Travel time surfaces were used to calculate travel times to health and education facilities, urban centres, and electricity grid components. Future work will draw upon these data and additional sources to capture as broader range of socio-economic indicators as possible. In addition, it’s important to highlight that we have selected more recent data sources to derive potential risk indicators from (when compared to the DHS survey from 2012) since future analyses will use the CIPHIA data from 2018. We are assuming that the impact of the temporal gap will be limited for our preliminary analyses.
Table 1: Publicly available datasets used to produce potential HIV risk indicators
| Name | Resolution | Owner | Year |
| Demographic & Health Survey (DHS) | 9,686 households | USAID | 2012 |
| High resolution population density maps | 30 metre | 2019 | |
| Public sector health facility locations | 98,745 facilities across 50 Sub Saharan countries. | WHO | 2019 |
| Education facility locations | 2,094 facilities across Côte d’Ivoire | Humanitarian Data Exchange | 2020 |
| Urban centre locations | 1 kilometre – global | Global Human Settlement | 2020 |
| Predicted electricity grid | Medium voltage grid | 2019 | |
| Global landcover maps | 20 degree | Copernicus Land Monitoring Service | 2019 |
| Travel time friction surfaces | 10 kilometre | Malaria Atlas project | 2020 |
Defining a uniform grid
Given the Côte d’Ivoire country boundary, we created a uniform 10 kilometres times 10 kilometres spatial grid using the sf R package. The grid is shown in Figure 3. The DHS HIV testing and public data were mapped onto the grid to create our response (HIV prevalence) and predictor variables, as shown in Figure 4. We generated two dummy variables by drawing randomly from uniform and exponential distributions (a summary of the predictor variables can be found in Table 2 in the appendix).
Figure 3: Uniform 10km x 10km spatial grid.
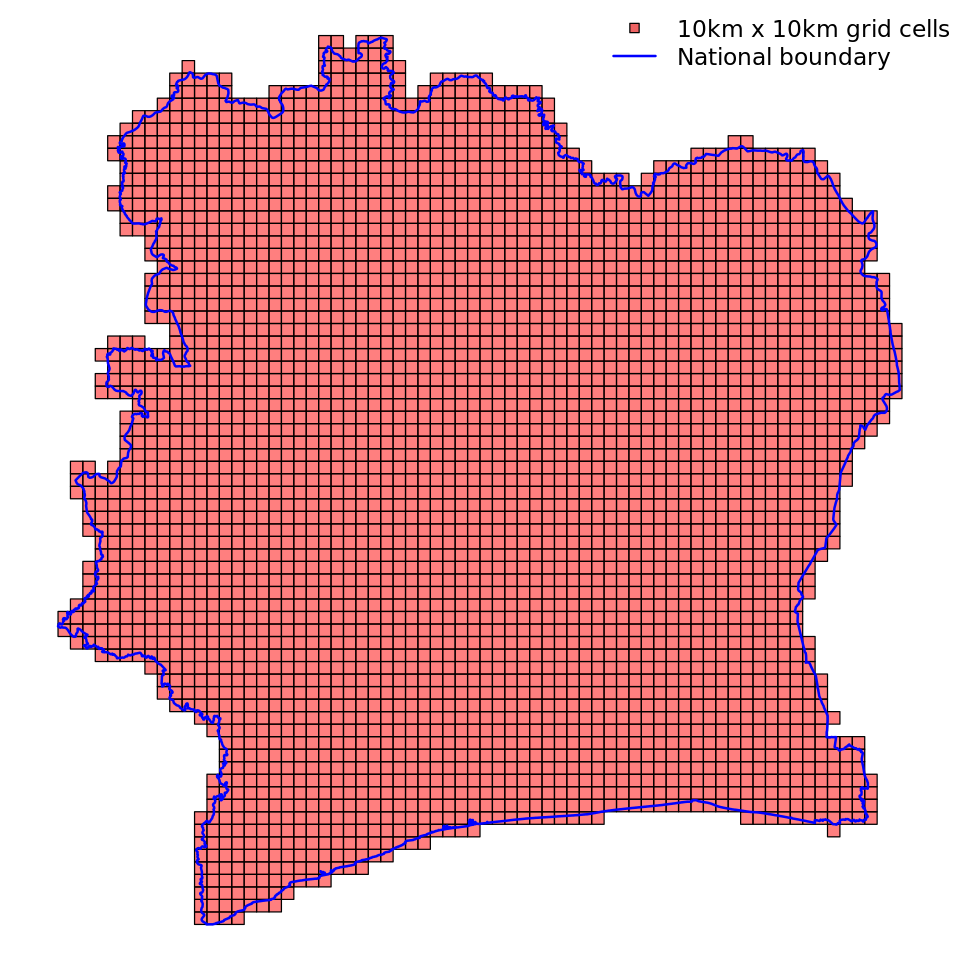
Source: Côte d’Ivoire national boundary (blue) sourced from GADM.
Figure 4: HIV prevalence and open data mapped onto grid (TTW: Travel Time by Walking).
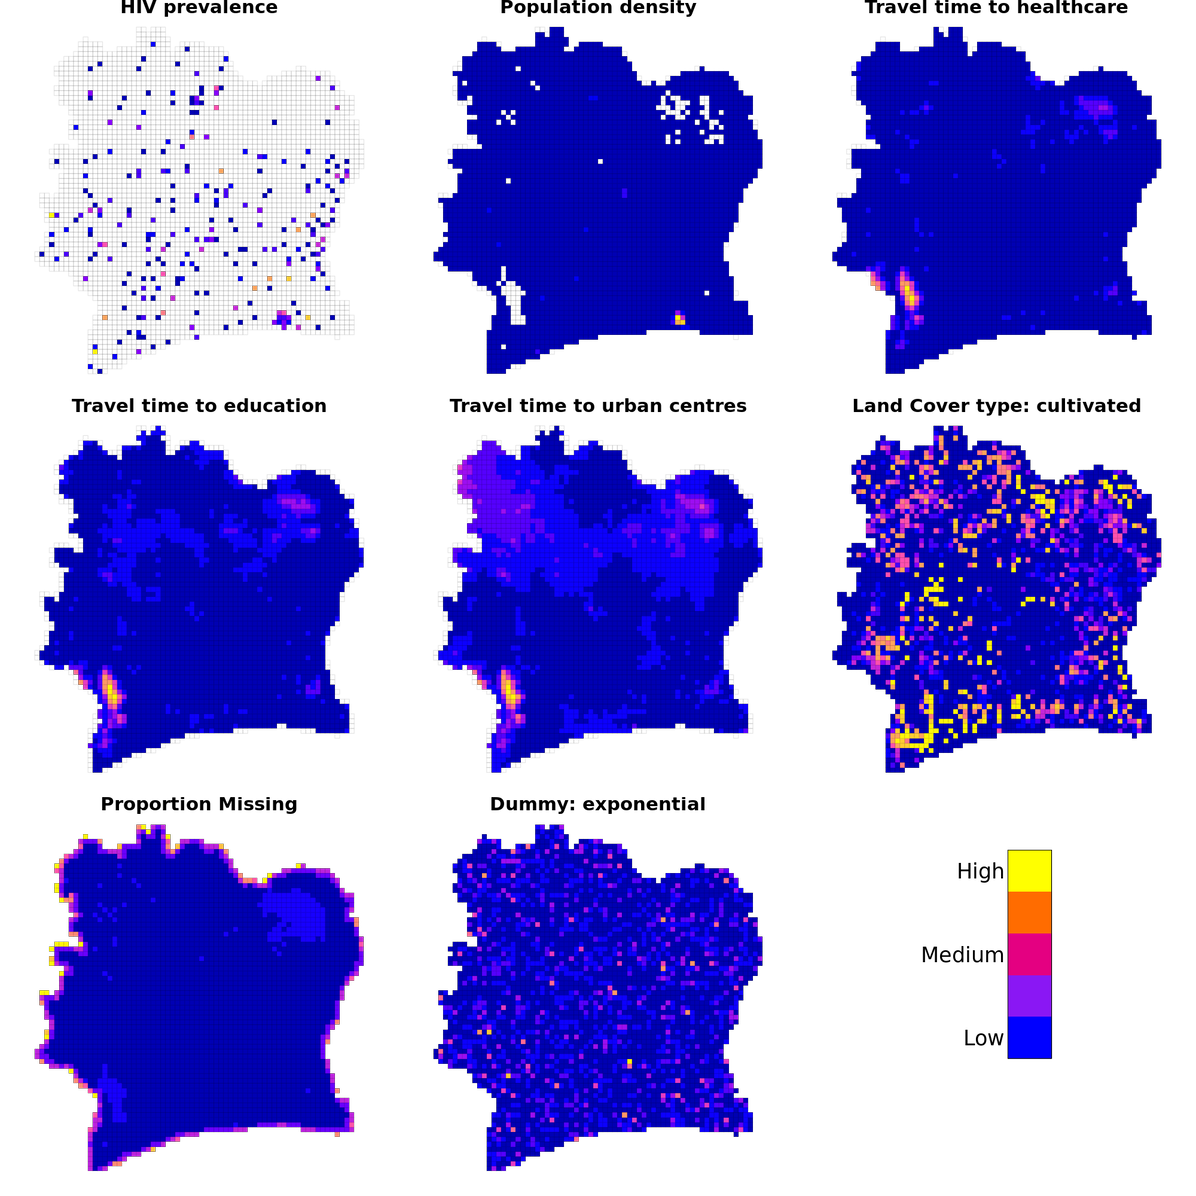
Note that only a sample of predictor variables are shown (summary of all predictors can be found in Table 2 in the appendix).
Source: HIV prevalence was derived from the DHS 2012 survey and open data sources are described in Table 1.
Modelling on the grid
The Random Forest Spatial Interpolation (RFSI) framework was selected for these initial analyses from the ranger R package. RFSI extends the standard Random Forest framework by including observations of, and distances to, the nearest n sampled locations, as shown in Figure 4. We selected 25 as the number of nearest neighbours to consider in our preliminary analyses. Nearest neighbours were identified for each grid cell using the travel times based on motor vehicles. The impact of varying the number of nearest neighbours will be investigated in further research but it has been found to be limited as long as the value isn’t too small. Future work will also the examine the impact of identifying nearest neighbours using different measures of distance, such as Euclidian distance or travel time based on walking.
Figure 5: The Random Forest Spatial Interpolation (RFSI) framework
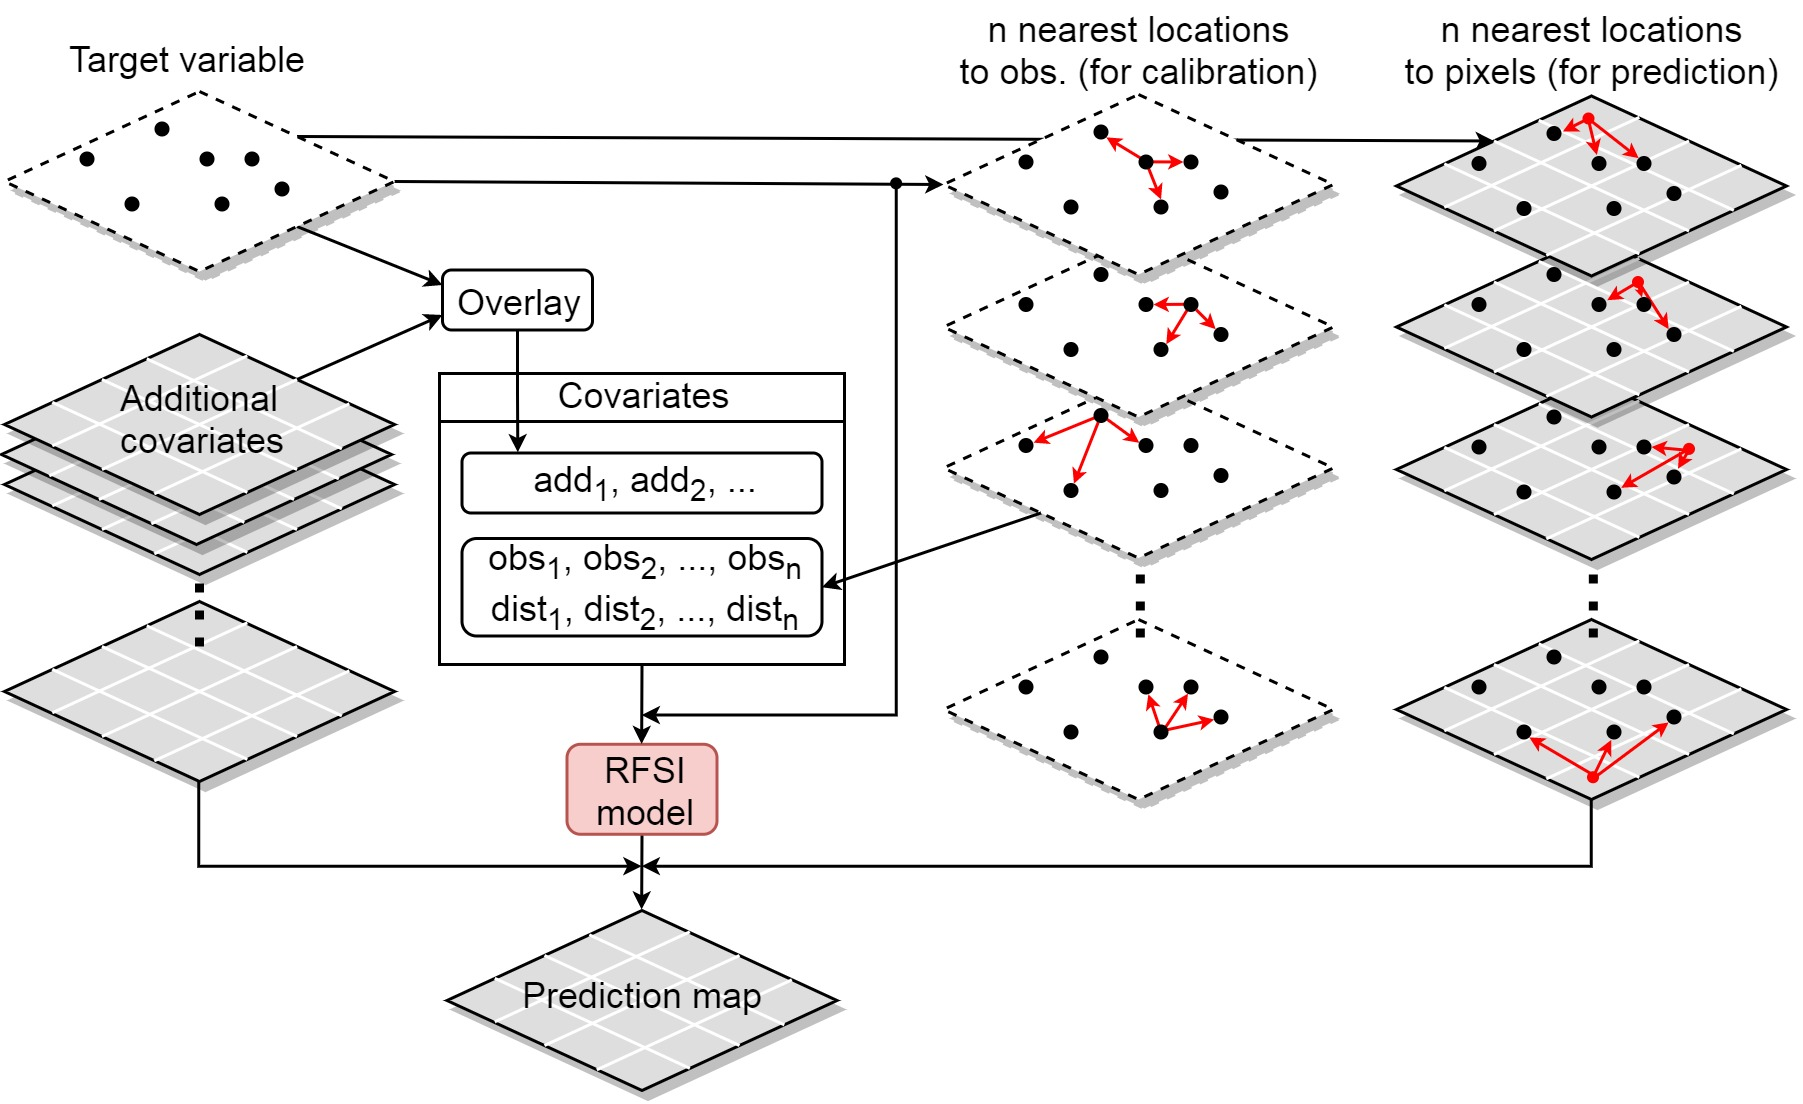
Source: Figure is taken directly from Sekulić et al. 2020 Random Forest Spatial Interpolation.
Figure 6: Actual and predicted HIV prevalence for each cell on uniform grid where HIV testing data were available from the Demographic and Health Survey 2012 data
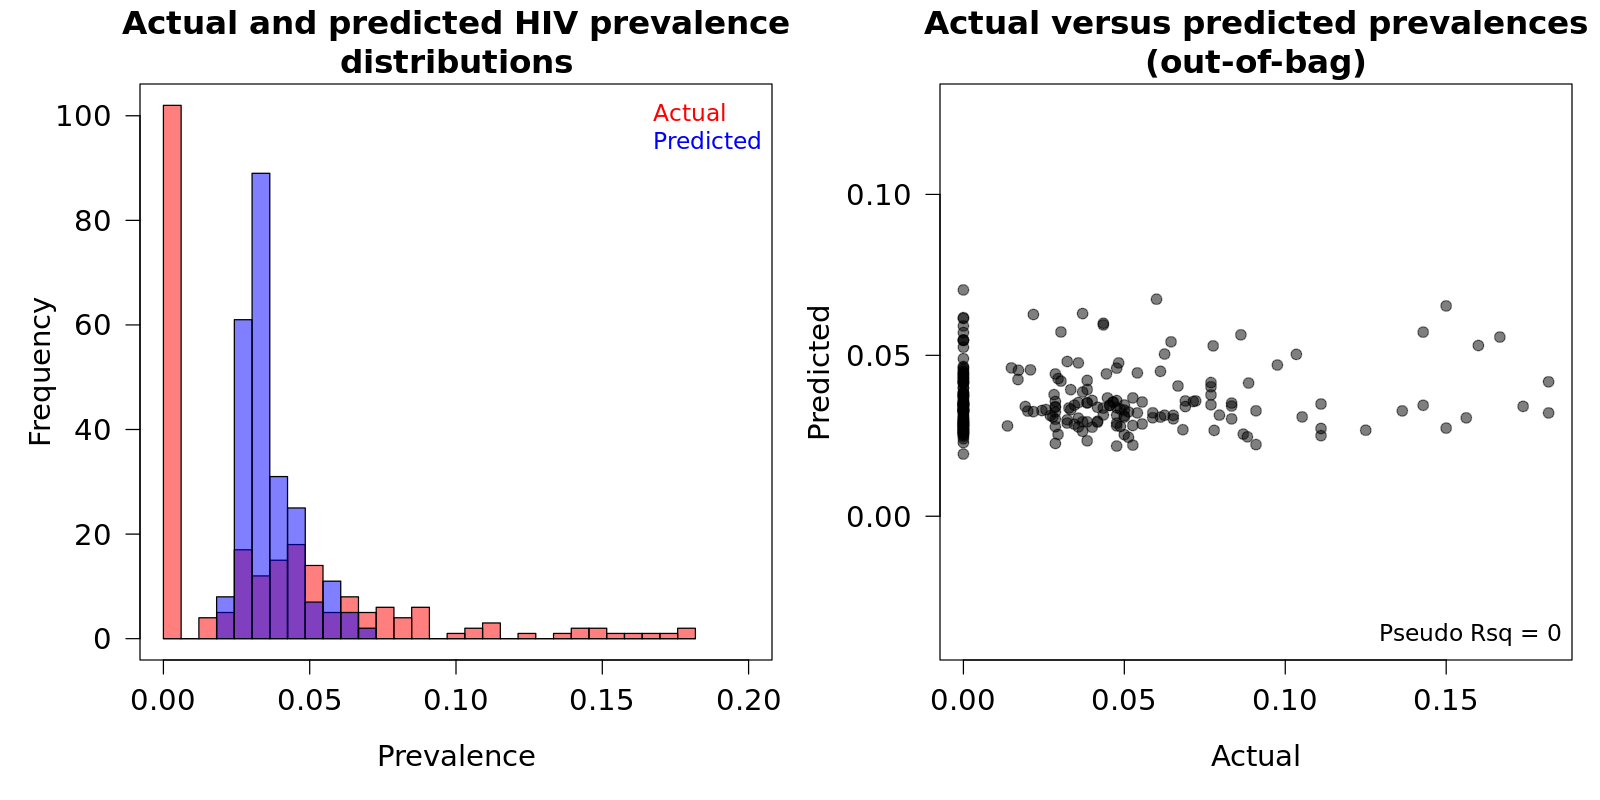
Source: Demographic and Health Survey (DHS) 2012
A hyper grid was constructed to identify the optimal parameters for the Random Forest model using the grid cells where HIV prevalence estimates were available (n=239). With the optimal parameters identified, a final model was constructed and used to predict the HIV prevalence in the grid cells where testing data were not available (n=2,727). As Figure 6 and Figure 7 demonstrate, the prevalence distribution was skewed and zero-inflated and the constructed model could not accurately predict HIV prevalence. The majority of grid cells across Côte d’Ivoire had broad prediction bounds, with the difference between the lower 2.5% and upper 97.5% bounds on the predictions being large, relative to the median predictions (Figure 7).
Figure 7: HIV predictions (Left) and uncertainty range (Right) using the Random Forest Spatial Interpolation framework.
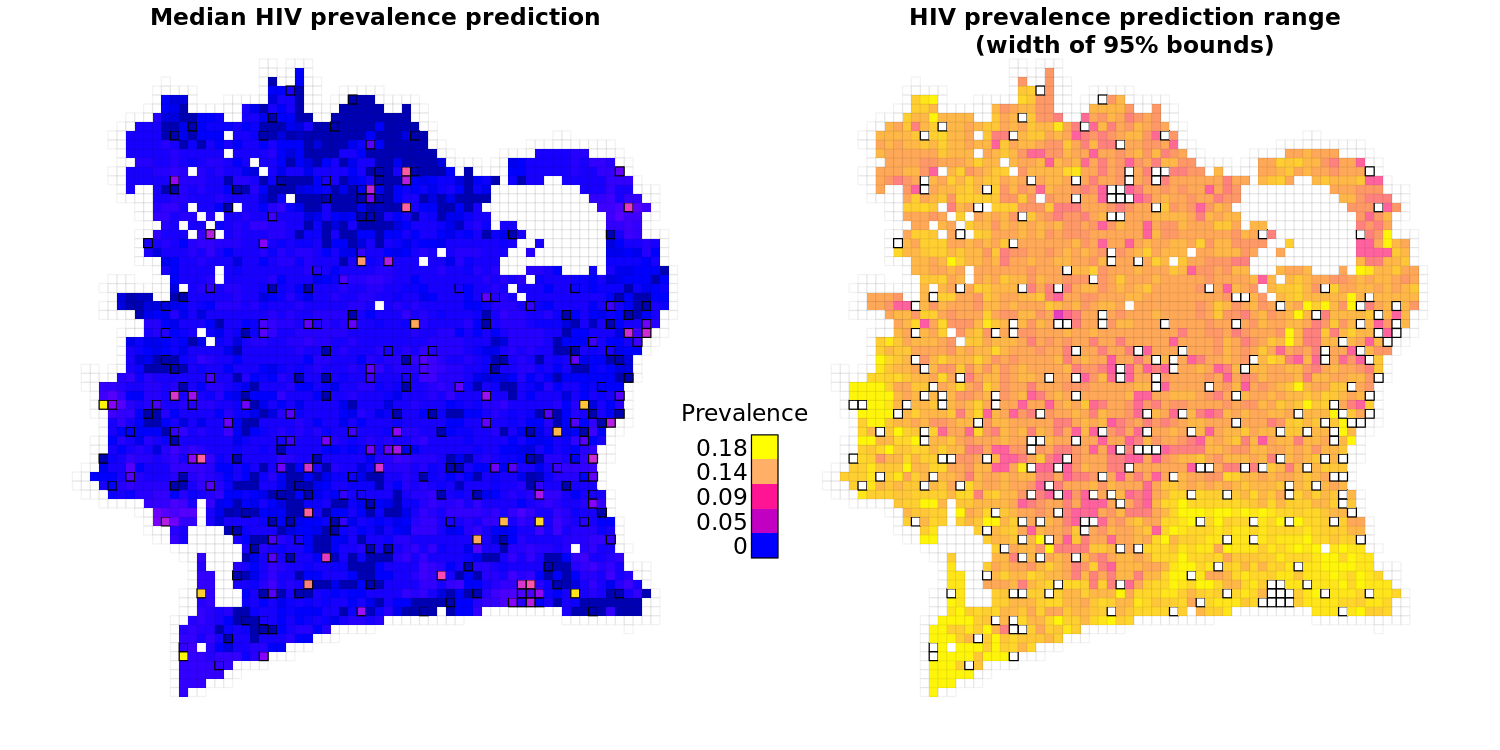
Grid cells with a black border (appearing raised) are cells where estimates of HIV prevalence weren’t predicted but derived from the Demographic and Health Survey data.
Key Learning
Our preliminary results suggest there isn’t a strong relationship between our initial set of predictors and HIV prevalence estimates from the DHS survey. While there are limitations to our approach, it is known that HIV prevalence is difficult to predict spatially particularly in low prevalence settings, as shown in the DHS modelling advice. These difficulties arise from HIV being a long-term disease driven by complex socio-economic factors. Our models could be improved by incorporating predictors that better capture aspects of human behaviour. Previous research demonstrated strong links between predictors derived from mobile phone data and prevalence.
Our team work on a diverse range of data science projects around the world. It is important with each project to consider how to apply what we’ve learnt in other settings. For example, the RFSI framework is a powerful tool that has an application to many small area estimation initiatives. The data we outlined in Table 1 has a broad range of potential applications:
- DHS surveys provide socio economic indicators for countries around the world; recently teams have used these data to understand COVID-19 risk factors and inform vaccination campaigns
- High-resolution Facebook population density maps are critical for targeting interventions and understanding the impacts of crises and are used for a range of data science research
- Travel time surfaces are critical for understanding accessibility; recent research used these data to map access to healthcare globally
- Facebook data for good have released their code for generating the electricity grid predictions that could be used to build these maps for countries all around the world
Next steps
Our preliminary analyses help us to understand whether it is possible to use machine learning techniques to map HIV risk in Côte d’Ivoire. We’ve initially used DHS data and are working to access the CIPHIA data for a more up-to-date measure of HIV prevalence. In addition, we are currently considering:
- using methods to handle the zero-inflated HIV prevalence distribution, such as over/under sampling zero/non-zero values in the HIV testing data or splitting the model to model zero and non-zero values separately
- sourcing additional predictor variables, for example by using data from mobile phone networks, social media platforms and antenatal clinics
- targeting models to specifically consider adolescents – we’ve kept all individuals in our preliminary models to maximise the data available
- exploring varying the number of nearest neighbours in the RFSI framework
- exploring a range of other modelling approaches such as support vector machines and neural networks
Conclusions
While our initial results weren’t what we had hoped, we have set out several next steps for continuing the project and improving our predictions. In addition, we’ve found that our approaches could potentially be applied in other contexts.
We’ll provide updates on the future progress of this work. If you have any questions or would like further information then please contact Joseph Crispell, data scientist at the ONS-FCDO data science hub.
Appendix
Table 2: Summary of initial selection of predictor variables used in preliminary modelling the Random Forest Spatial Interpolation framework.
| Variable | Type | Description | Motivation |
| Dummy variable – exponential | continuous | A random variable drawn from exponential distribution | Included to inform investigations into the informativeness of different variables |
| Dummy variable – uniform | continuous | A random variable drawn from uniform distribution | Included to inform investigations into the informativeness of different variables |
| Land cover type | factor | Discrete land cover type classifications from Copernicus Land Monitoring Service | Land use patterns likely to be linked to socio-economic status of different areas |
| Population density of adolescents | continuous | Population density estimates from Facebook data for good initiatives | Population density linked to social connectedness patterns |
| Total population density | continuous | Population density estimates (15-24yo) from Facebook data for good initiatives | Population density linked to social connectedness patterns |
| Travel times to other grid cells (walking and by motor vehicle) | continuous | Travel times to all other grid cells by motor vehicle | Connectedness across country may be linked to HIV spread |
| Travel times to education facilities (walking and by motor vehicle) | continuous | Travel times to education facilities by motor vehicle | Access to education could be linked to success of interventions |
| Travel times to electricity grid components (walking and by motor vehicle) | continuous | Travel times to nearest electricity grid infrastructure by motor vehicle | The availability of electricity is an indicator of socio-economic status that may be linked to HIV risk |
| Travel times to healthcare facilities (walking and by motor vehicle) | continuous | Travel times to health facilities by motor vehicle | Access to health facilities could be linked to success of interventions |
| Travel times to urban centres (walking and by motor vehicle) | continuous | Travel times to urban centres by motor vehicle | The degree of connectedness to urban centres (>10,000 population size) could be linked to HIV risk |