Technical report: Predicting cattle camp locations in South Sudan from Sentinel 2 satellite imagery
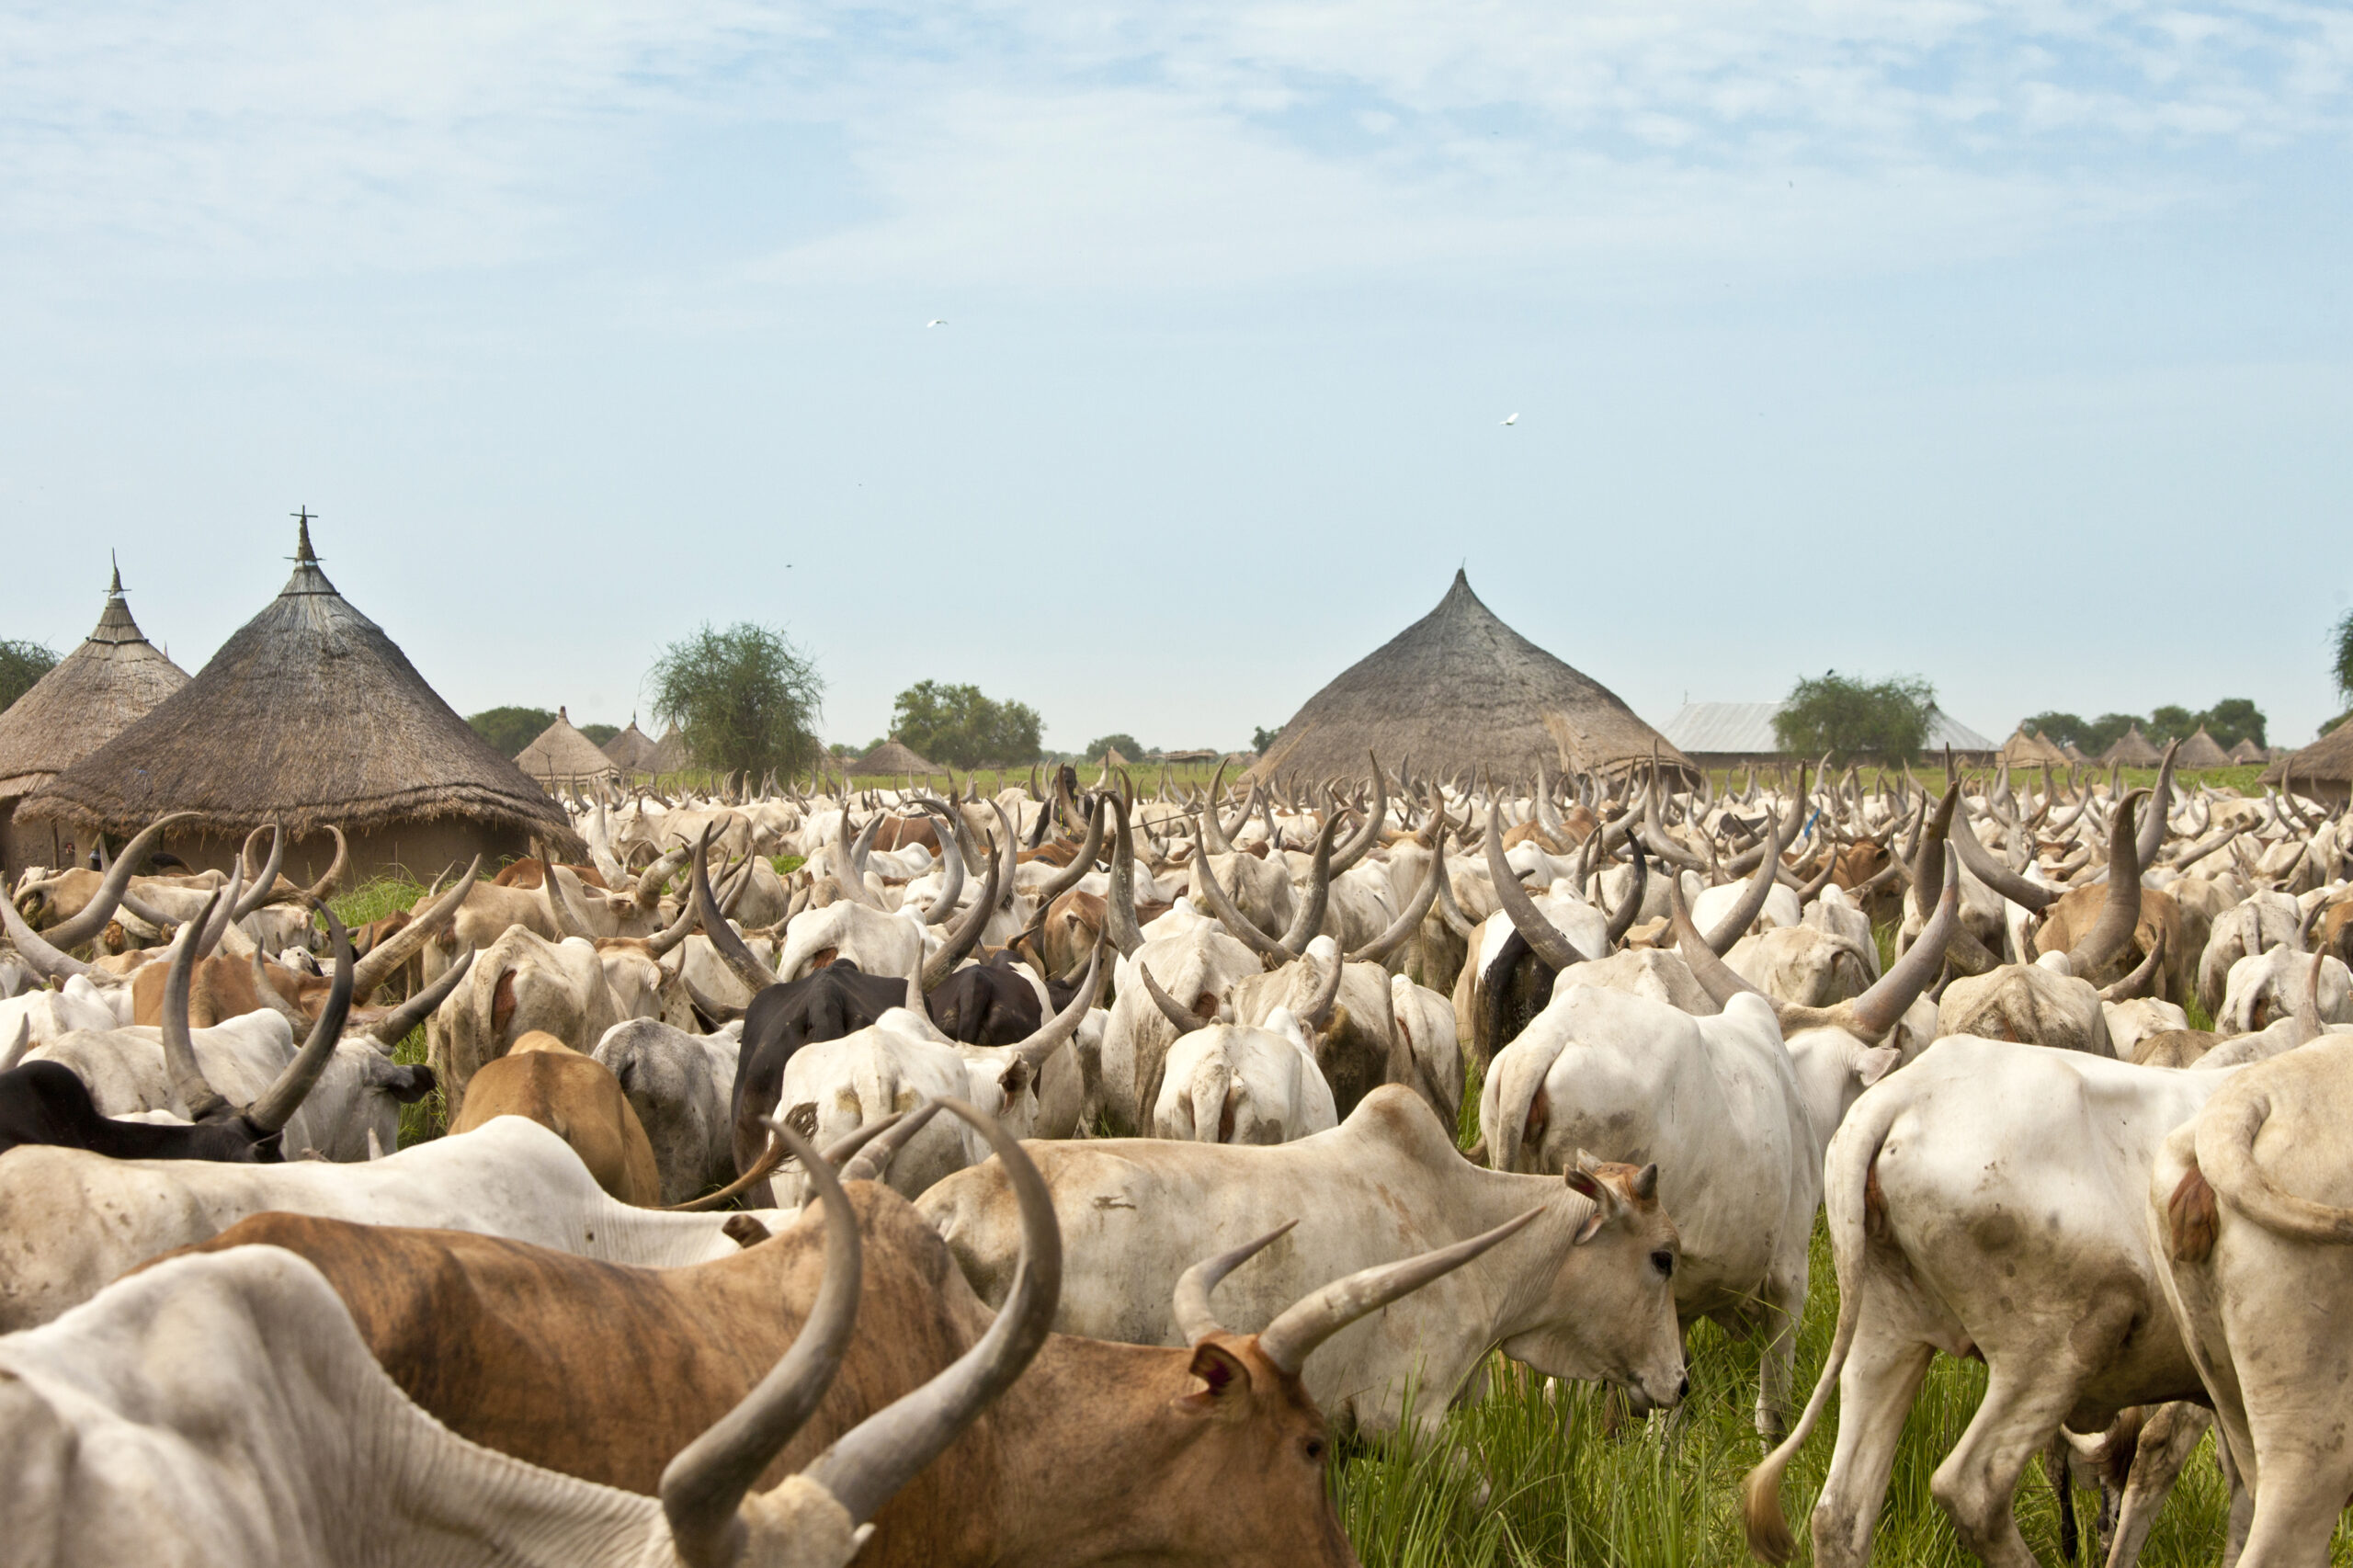
Cattle are central to many people’s livelihoods in South Sudan, but there are very few recent data on the number of animals and their geographic distribution. Security risks from outbreaks of conflict and sensitivity of animal owners in sharing information because of the risk of cattle raiding make it difficult to gather data on the ground.
In our previous work, Counting cows in South Sudan, we assessed the feasibility of carrying out a cattle census across South Sudan using satellite imagery, to overcome the difficulties of counting cattle on the ground. Here, we update this work with an improvement to the predictions of the locations of cattle camps by using a UNET (convolutional neural network) model. In comparison to our previous methods to predict cattle camp locations, the UNET method can better distinguish cattle camps from similar landscape features seen on Sentinel 2 satellite images, such as dried riverbeds. Therefore, the UNET approach is more applicable at a landscape scale when used to identify cattle camps across whole regions of South Sudan.
Agriculture and forestry represents approximately 10% of GDP in South Sudan in 2020 as estimated by the World Bank, which is likely an underestimate given the difficulties estimating livestock numbers that motivate our work. Predicted cattle camp locations can inform the Government of South Sudan and other organisations working to support and develop cattle farming in the country, such as the United Nations Food and Agricultural Organisation (UN FAO). A map of cattle camp locations could inform animal vaccination campaigns and help understand geographic variations in cattle management practices across South Sudan. Once automated, cattle camp maps could be generated from new satellite images over time, meaning more would be known about temporal variations in cattle herding migrations, both seasonally and between years
The revised cattle camp mapping process will improve understanding of geographic and seasonal patterns of livestock management in South Sudan. These processes can also be applied to other use cases aiming to automate the mapping of small, visually distinct, features across large areas using open-source satellite imagery.
In this article, we review the work that was done previously to classify cattle camps from Sentinel 2 satellite imagery at the pixel level. We then discuss one limitation of the previous method and how a convolutional neural network, and specifically a UNET model, can address this limitation. We then evaluate both the original pixel classifier and UNET method in predicting cattle camps across an area near Bor in South Sudan. Finally, we conclude on an outstanding need to know the precise use case for the cattle camp predictions to adjust the methods to meet those needs. We also describe the uncertainty in evaluating the predictions against a visual interpretation of Sentinel 2 imagery alone and some potential next steps to improve the UNET method.
Table of contents
- Introduction
- Cattle camps in South Sudan on satellite images
- Findings from the first phase of the project
- Scaling the initial method and false positive predictions
- Introducing a convolutional neural network UNET approach
- Data preparation and deployment of UNET method
- Prediction improvements of UNET method – visual assessment
- Prediction improvements of UNET method - metrics
- Conclusion and suggestions for future work
1. Introduction
We first investigated the feasibility of conducting a cattle census in South Sudan using satellite imagery between October 2019 and April 2020. Our initial findings were summarized in Counting cows in South Sudan.
Our initial study showed potential in developing a cattle population estimation method based on cattle camps, using multiple resolutions of satellite imagery in combination to estimate cattle numbers inside a camp.
During the first phase of the project, information from the UK’s Foreign, Commonwealth and Development Office (FCDO) and United Nations Food and Agriculture Organisation (UN FAO) contacts in South Sudan informed us that during the dry season (November to March), livestock owners typically migrate with their animals to be nearer to sources of water. At these times, several owners keep their cattle together in communal camps overnight for safety. These dry season cattle camps were found to be distinctive features when observed on freely available, frequently captured, imagery from the European Space Agency’s Sentinel 2 satellite. Exploratory analysis during the first phase of the project demonstrated that machine learning algorithms could be developed to detect cattle camps from Sentinel imagery with a good level of accuracy.
Further exploratory work continuing from our first phase found our methods were susceptible to confusing cattle camps with similar landscape features seen on Sentinel 2 satellite images such as dried riverbeds. The current blog post describes an exploration of new methods, based on convolutional neural networks, that can better distinguish cattle camps from similar landscape features.
A map of cattle camp locations for a specific point in time is considered an important starting point for deriving an animal population estimate. It would be a useful product for better understanding cattle farming in South Sudan and planning for veterinary services. However, because of security risks and the potential for cattle raiding, a full map of cattle camp locations cannot be made available publicly in the results.
2. Cattle camps in South Sudan on satellite images
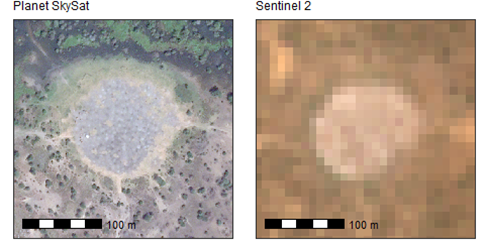
Figure 1 compares the appearance of a camp on Sentinel 2 compared with a higher resolution commercial satellite (Planet SkySat).
Although much less detail can be seen inside the cattle camp on Sentinel 2, the Sentinel 2 imagery was the best choice for the initial task of locating cattle camps because:
- Sentinel 2 imagery is freely available and new images are captured covering all South Sudan every 5 to 10 days
- Sentinel 2 is higher resolution (10 metres per pixel) than other open-imagery data sources currently available, so cattle camps appear as distinct features
- it is relatively simple to scale an analysis to run at a regional or national level at 10-metre resolution when compared with higher resolution imagery sources where much more processing effort would be required
Figure 1: Comparing the appearance of a cattle camp on 0.5 metre resolution Planet SkySat (2020-12-18) (left) vs 10-metre resolution Sentinel 2 (Feb-March 2021 composite) (right)
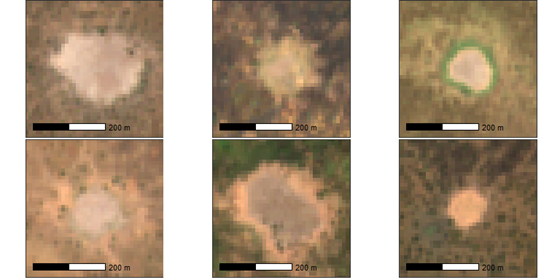
To understand if a process could be developed using Sentinel 2 imagery, several cattle camps were examined visually. As can be seen in Figure 2, camps on Sentinel 2 imagery are generally noted to be:
- rounded in shape
- low in vegetation cover
- about one to four hectares in size
- often brighter in appearance than surrounding ground, even de-vegetated ground
The initial visual exploration of Sentinel 2 images from the dry seasons of 2019 and 2020 found most camps shared these properties. Contacts at the UN FAO informed us that camps are used in the dry season particularly in the Jongalei and Lakes regions of South Sudan.
Figure 2: The appearance of a sample of cattle camps on 10-metre resolution Sentinel 2
3. Findings from the first phase of the project
In the first phase of the project, cattle camp predictions were made from Sentinel 2 using simple pixel-by-pixel supervised classifications using Support Vector Machines (SVM) that were later replaced with more efficient Random Forest algorithms that provided comparable results faster.
To do the pixel-by-pixel classification, training data were created by visually interpreting an image and manually digitising polygons representing the boundaries of a cattle camp and a sample of non-camp areas.
Next, code was written to extract the image pixels from the training polygons and reshape the data into a 2-d structure, where each row is one pixel, and each column is the colour or wavelength value for that pixel (red, green, blue, and near infra-red). The normalised difference vegetation index (NDVI) was calculated as the normalised difference between near infra-red and red pixel values. The NDVI shows how likely it is that a pixel contains green vegetation and this was a useful derived feature used in the pixel-by-pixel camp classifications.
With the image pixel data structured in this way, a machine learning algorithm could be used to find the best separation between cattle camp and non-cattle camp pixels. In our previous work, the SVM and Random Forest machine learning algorithms were able to do this very successfully when validating against 25% of the training polygons held back for testing.
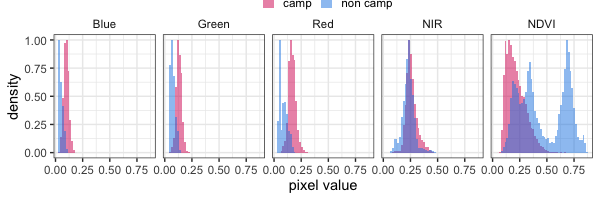
As can be seen in Figure 3, pixels generally have higher red, green, and blue values (visually we can see they are brighter) inside the cattle camp. The reflection of near infra-red light when compared with red light is relatively low inside the camp, but higher outside the camp, as seen in the values for the normalised difference vegetation index (NDVI) histogram.
In the first phase of the project, the tests showed that using Sentinel 2 images, cattle camps can typically be distinguished from the surrounding landscape simply using these wavelength-based pixel properties. However, it is important to note that these methods are only learning to separate pixels based on their individual properties, such as colour and brightness, not the shapes formed by groups of pixels together.
Figure 3: Histogram (0-1 scaled) of Sentinel pixel values for blue, green, red, near-infra-red (NIR) and normalised vegetation index (NDVI) for camp and non-camp training polygons
4. Scaling the initial method and false positive predictions
When using the pixel-by-pixel method to classify a full image, post-classification cleaning was done to improve the quality of predictions. This cleaning involved passing successive kernel filters over the classified image and relying on the fact that cattle camps were 0.5 to 10 hectares in size to discount large, de-vegetated patches of land that were not cattle camps.
With these steps added to the process, the pixel-by-pixel classification method worked well over the extents tested in the first phase of the project. The advantage of this simple approach was that it was quite fast and an image of 100 km by 100 km could be classified, cleaned, and predictions converted to shapefile, in a couple of minutes using a standard laptop.
We initially reported use of a Support Vector Machines (SVM) classifier, but this was later replaced with a Random Forest method, which was faster when making predictions over larger extents and had similar accuracy.
As predictions were tested across more regions and larger extents of South Sudan in the second phase of work we describe here, it was clear that there were times where false positive classifications could not be avoided with the pixel-by-pixel method. An example of this is shown in Figure 4. Land surrounding dried-out riverbeds were one of the most common locations where false positive classifications were seen. This could be de-vegetated land not being under water for part of the year and has a bright colour once dried out.
As the example in Figure 4 shows, it was clear that the shapes of the misclassified segments near the dried riverbed were not rounded as is typical of cattle camps. Therefore, to reduce the number of false positives, a classification method that could consider pixels as part of larger features was required. A method was needed to discern the rounded, compact shape of cattle camps from other de-vegetated patches of ground with more irregular shapes.
Figure 4: A dried riverbed on Sentinel 2 (left) and the false positive predictions made in this location pixel-by-pixel classifications (right)
5. Introducing a convolutional neural network UNET approach
A convolutional neural network (CNN) is a type of artificial neural network (ANN) particularly suited to computer vision applications because of some key properties.
- The input to a CNN is a typical image array structure of two dimensions of pixels repeated for each channel (for example blue, green, red). Therefore, unlike the pixel-by-pixel method described above, no flattening of the image pixel arrays to one row per pixel is required in preparing the data for a CNN.
- Convolutional layers in a CNN consist of filters that within an image when training a model, which is useful for detecting the natural shape of features repeated across a landscape, for example the compact, rounded shape of a cattle camp.
- Hierarchies of spatial features can be learned, thanks to successive convolutional layers, which condense activity from the layer below into combined features, and pooling layers, which filter activity from the layer below into the strongest features.
When applied to detecting cattle camps from satellite imagery, there are different methods by which a CNN could be used to make predictions.
- After splitting the satellite image into regularly sized tiles, each tile could be classified based on what it contains. For example, predicting if a cattle camp is or is not present in each image tile. This method could be described as whole image classification.
- A CNN could be constructed and trained to detect the location of a specific feature such as a cattle camp and place the best fitting bounding box around its extent. This method is known as object detection.
- A CNN could be designed to predict whether each pixel in the input image is part of a specific feature class such as a cattle camp. For cattle camps, this method could be used to generate outputs like the pixel-by-pixel classification method. It is known as semantic segmentation in computer vision, usually implemented by what is called a fully convolutional network (FCN).
Depending on which of the methods is chosen, the architecture of the CNN model and the format of the labelled training data feeding into the model will vary.
In the case of the cattle camp classifications, semantic segmentation is most appropriate because:
- Semantic segmentation allows the boundaries of cattle camps to be extracted as a spatial dataset. An example of this spatial output is shown by red outlines around the predicted pixels above a particular threshold in Figure 5. The derived polygon shown in Figure 5 by a red outline would easily allow areas of camps to be estimated and could be using in mapping applications.
- The existing training data used in the pixel-by-pixel method were also a suitable starting point for creating the masks used for training a semantic segmentation model.
- Semantic segmentation was also the method that produced outputs that were most easily comparable with the original pixel-by-pixel method for evaluating the improvements of these methods.
Figure 5: A Sentinel 2 “red green blue” image of a cattle camp (left) with prediction image and derived boundary in red from Random Forest (centre) and UNET (right)

A popular FCN semantic segmentation implementation is found in the UNET architecture, first used in medical image segmentation as described by Ronneberger, Fischer and Brox (2015). UNET models have been used successfully in satellite imagery classifications previously, for example Google’s project to classify building footprints for all of Africa. As it is widely used, many examples of how to construct a UNET are available, making it a good choice to test cattle camp predictions from Sentinel 2 images. As the UNET was the method we chose to use, we will refer to the approach as UNET for the remainder of this report, and the previous pixel-by-pixel method as Random Forest.
The structure of a UNET model can be divided into the encoding stage (repeatedly down-scaling the image so that a hierarchy of shapes and features is learned) and the decoding stage (up-scaling so that a prediction is output per input image pixel). The architecture used in the encoding stage of a UNET is like a general CNN architecture and therefore it is possible to make use of widely available pre-trained CNN models in the encoding stage.
In the cattle camp detection task, making use of a pre-trained model was important, as only 156 example camps were available for the training data in the Bor region of South Sudan that was tested. Training a UNET model from this small cattle camp dataset alone would mean the resulting model would not generalise very well. We used the MobileNetV2 pre-trained model. MobileNetV2 is a fast, lightweight, model with fewer parameters than other pre-trained models available with Keras (a popular open-source neural network library) Data sources used to test UNET and Random Forest methods.
To test the improvements of the UNET in predicting cattle camps, a Sentinel 2 composite image from dry season 2020 was chosen. This image was 120 kilometres by 70 kilometres near Bor in South Sudan and falling either side of the Nile. Exact details of the data used for the test are as follows:
- A Sentinel 2 temporal median composite image from 1 February 2020 to 31 March 2020 with cloud cover removed. Bands available in the image were blue, green, red, near infrared, and derived NDVI (normalized difference between infrared and red), although only blue, green, and red bands were used for the UNET method.
- 156 polygons stored in a shapefile spatial dataset, representing the boundaries of cattle camps identified and captured by visual interpretation of Sentinel 2 imagery and checked against Google Earth base imagery.
6. Data preparation and deployment of UNET method
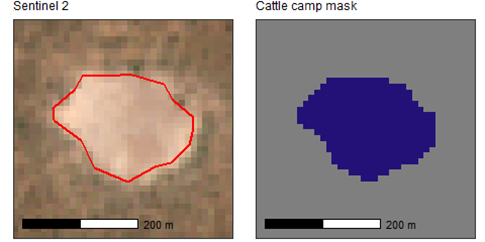
As was the case when using the pixel-by-pixel classification methods previously, the classifications performed on the Sentinel 2 images using the UNET model were binary classifications. The aim was to predict for each pixel whether an input image was part of a cattle camp. To train the UNET, the labelled cattle camps were binary images, with values of 1 for cattle camp areas, and 0 for non-cattle camp areas, as shown in Figure 6.
Figure 6: Shapefile polygon mapped for a cattle camp (left) used to create UNET training mask (right, non-camp pixels in grey, camp pixels in blue)
The UNET model input layer expects input image arrays of consistent dimensions (by number of pixels). Individual Sentinel 2 satellite images have many more pixels in each spatial dimension than would typically be fed into these models as they continuously image over land at 10-metre resolution. The processing pipeline divided Sentinel 2 images into large image tiles covering an area of 50 kilometres by 50 kilometres. Each image tile was then processed as windows of 64 pixels by 64 pixels (each pixel on Sentinel 2 is about 10 metres on the ground, so the windows covered 640 metres by 640 metres).
The scaling of the image pixel values needed to be correctly configured before feeding them into the UNET. The MobileNetV2 pre-trained model expects pixel values of a range negative 1 to 1. Unlike regular photos, raw satellite images are not natively stored in an 8-bit (values of 0 to 255) format, as a greater depth of information is captured by the Sentinel 2 sensor. Preparing the Sentinel 2 pixel values for input to the CNN involved clipping the values to a typical visual range and then adjusting the minimum and maximum scaling to between negative 1 and 1.
Unlike the pixel-by-pixel method, only the visible light (blue, green, red) image channels were used for the UNET. This was because the pre-trained MobileNetV2 only expected these three channels, but, as the histograms in Figure 3 show, blue, green, and red channels distinguish camp from non-camp pixels more than near-infrared, so it was not considered an issue. We expected that the UNET would learn the shape and size of the cattle camp features, which are visible on blue, green, and red channels without requiring the derived NDVI values representing vegetation cover.
7. Prediction improvements of UNET method – visual assessment
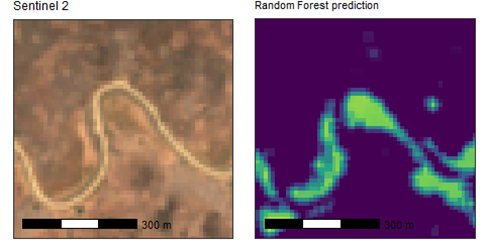
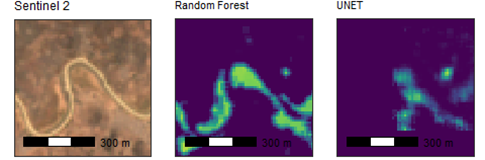
The UNET performance was evaluated by both a visual inspection and using different measures of performance in comparison with the Random Forest approach. When visually examining the predictions of the UNET method, compared with the Random Forest method, it was observed that there were fewer misclassifications for dried riverbeds. This is one of the most common locations for false-positive predictions with the Random Forest approach, as discussed above. An example of this improvement is shown in Figure 7 where the UNET made no false positive predictions.
Figure 7: A dried riverbed on Sentinel 2 (left) and the false positive predictions made in this location from pixel-by-pixel classifications (middle) and the correct negative prediction made for all this area by the UNET model (right)
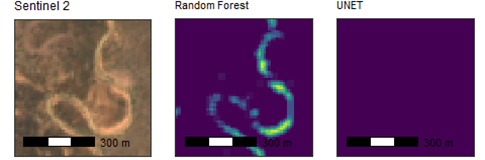
However, false positives were not eliminated entirely. Figure 8 shows the same area as shown earlier in Figure 4, where although the UNET gives fewer false positive predictions and they are of lower probability (less bright in the prediction image), they do still exist.
Figure 8: A dried riverbed on Sentinel 2 (left) and the false positive predictions made in this location by pixel-by-pixel classifications (right)
To eliminate false positive prediction for dried riverbeds , more sampling and training of the model on non-cattle camp locations would be required. However, given the level of detail on the ground observable with Sentinel 2, there is a limit to how well even the human eye could discern cattle camps from de-vegetated patches of ground.
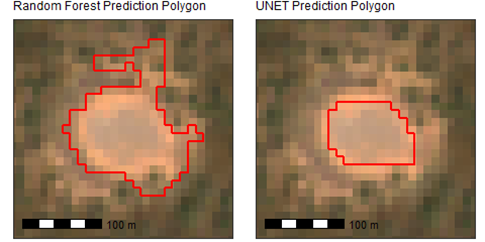
We also considered how well the boundaries of the cattle camps were delineated. The UNET mapped features with tidier boundaries than the Random Forest approach, as the example in Figure 9 shows.
Figure 9: Sentinel 2 image of a cattle camp with the predicted cattle camp boundary in red derived from the Random Forest method (left) and the UNET method (right)
8. Prediction improvements of UNET method - metrics
As well as conducting a visual assessment of the results, we evaluated the performance of each method objectively using standard performance metrics. Deciding on the most suitable method of evaluation depended on whether simply predicting the occurrence of a cattle camp was sufficient, or whether it was also important to accurately predict each camp’s extent or boundary.
Predicting the extent of a camp was used for the results shown here, as a more challenging test of the models. This assessment was done by comparing a binary image of training data captured by visual interpretation (0 for background, 1 for cattle camp) to the model’s predictions over the same area. Table 1 shows the results for the Random Forest and UNET methods for an area of 120 km by 70 km near Bor in South Sudan.
This is a brief description of each metric shown in Table 1 and what the result shows.
- Precision Is the rate of true positive predictions compared with false positive. In this test, both methods have a high rate of false positive predictions, but the UNET model is making fewer false positive predictions at less than half the rate of the Random Forest.
- Recall Is the rate of true positive predictions compared with false negative. In this test, the Random Forest has a slightly higher recall (0.734 compared with 0.526), meaning it has fewer false negatives compared with the UNET.
- Jaccard (intersect over union) This is a metric commonly used to evaluate image segmentation performance. More false positives or false negatives would lower this score. The UNET has more than two times the Jaccard value of the Random Forest, an indication that it is performing better than the Random Forest overall.
- Dice This is another metric commonly used to evaluate image segmentation performance and is the same as the F1 score (a metric often used in general machine learning performance assessments). The Dice score for the UNET (0.220) compared with Random Forest (0.102) is another indication of better overall performance in predicting cattle camp extents in this location.
Table 1: Performance measures for Random Forest and UNET methods for cattle camp classifications near Bor, South Sudan. Each score ranges from 0 to 1 with higher values better
| Precision | Recall | Jaccard | Dice | |
| Random Forest | 0.055 | 0.734 | 0.054 | 0.102 |
| UNET | 0.139 | 0.526 | 0.124 | 0.220 |
The values for the performance measures shown in Table 1 are low for both the Random Forest and UNET methods when it would be hoped that all values would be closer to 1. An acceptable threshold to aim for with each measure would require further exploration when the exact regions of application in South Sudan are known. It is important to note that these results are using the more demanding performance measure of matching the extent of a cattle camp at the pixel level, rather than simply an intersection of an instance of a camp as a whole feature. The relatively low values for these metrics also reflect the imbalanced nature of this classification problem when applied at a landscape scale. In the training data image used when producing these results, only 0.02% of pixels in the training image are part of a cattle camp. If instead only small windows around known camps had been used for this performance test, then the false positive rate would have been lower as there would have been less area over which false positive predictions could have been made and subsequently the Precision, Jaccard and Dice metrics would have been higher. Using the full image and testing at the landscape level is potentially a more realistic application, although local user knowledge when applying these processes in production might mean only a subset of the full image area would be used for predicting cattle camps.
The metrics as shown in Table 1 must be considered in relation to the use case. When providing predicted cattle camp locations, it could be that false positives are a much worse problem than false negatives. For example, a false positive prediction could mean mistakenly sending a team providing animal health services to make a dangerous journey in a hostile location. If this was the case, a higher precision would be preferable over a higher recall and based on these results, the UNET would be favoured over Random Forest. However, if instead the cattle camp predictions from Sentinel 2 are only a preliminary stage in a process that will subsequently be refined with local knowledge or analysis of other data sources, then the model making fewer false negative predictions and having a higher recall might be preferred (the Random Forest approach, in this test).
There is potential to adjust either method, particularly the post-prediction image filtering and thresholding to optimise the results for a chosen use case.
9. Conclusion and suggestions for future work
We have summarised the technical work that was carried out during the second phase of the counting cattle project to improve predictions of cattle camp locations and their extents. As has been discussed, the UNET method developed during this phase showed improvements over the original Random Forest method in reducing false positive predictions with more than double the precision and dice metric values in the test of cattle camp predictions in the area near Bor in South Sudan.
However, the higher false negative rate we found from the UNET compared with the Random Forest shows the UNET method is more reliant on the quantity of training examples available to train the model than the simpler Random Forest method. To improve predictions further, more training example camps, and windows of non-cattle camp areas are needed. To generate more training data in future, the cattle camp training images could be augmented by taking images of the same camp in different years, as well as augmenting them artificially by randomly rotating, flipping, and possibly by altering their brightness.
The UNET method requires more computer processing power to train the model and to make predictions over large areas than the Random Forest method. Another potential disadvantage is the specific pre-processing pipeline required in preparing satellite imagery for the UNET, for example, specific ranges to which the pixel values must be scaled and the requirement to divide large images into relatively small, consistently sized windows. The Random Forest method is more flexible in its requirements, however now we have developed a Sentinel 2 image UNET pre-processing pipeline, we hope to make use of it in other projects.
During this second phase of work, the occasional ambiguity in identifying cattle camps from regular bare patches of ground in 10-metre Sentinel 2 imagery was evident. If a human is unsure whether a feature seen on the image is a cattle camp, a UNET or any advanced machine vision method will probably have the same problem. Our continued research has highlighted issues that might make an impact on success in predicting cattle camp locations from satellite imagery each year, for example flooding and varying migration patterns because of outbreaks of conflict. This was the case in spring 2021 when UN FAO informed us that cattle camps in use in 2020 and 2019 were not being used and this meant the Sentinel 2 images in 2021 showed cattle camps as less distinctive features. By continuing to work with the UN FAO we also learned of regions of South Sudan where dry-season cattle camps are not used.
Local knowledge of those using the predictions may be able to quickly eliminate areas of false positive predictions where there is uncertainty on the Sentinel imagery. Both Random Forest and UNET methods would eventually be refined based on how the cattle camp predictions are going to be used. This could include planning operations on the ground or as the first stage in an analysis process using different datasets or other sources of satellite imagery in combination, as was previously proposed.
Despite these considerations, the process was developed using free, frequently captured Sentinel 2 satellite imagery covering all South Sudan. It has the potential to provide very useful information to organisations wanting to better understand cattle farming patterns, particularly in the Lakes and Jongalei regions of the country.
Our methods might be applicable to other use cases and can be deployed in future projects. Re-usable components include the UNET and Random Forest classification methods that are suited to mapping the extent of small distinct features over a landscape, the pre-processing pipeline to prepare Sentinel images for training a UNET, and the process to make predictions from a trained UNET model at regional or national scale.