Predicting the Energy Performance Certificates (EPC) of properties

Improving the energy efficiency of homes is important for meeting the government’s net-zero target and helps households respond to higher energy prices. As a result, policymakers need accurate data on the current energy efficiency rating of properties; however, this is difficult to obtain because many properties still lack an official certification of energy efficiency.
The Department for Business, Energy and Industrial Strategy (BEIS) asked the Data Science Campus to see if machine learning techniques could be used to predict the energy efficiency of properties that do not have an official score. We tested several models and datasets to do this, and found we were able to predict over half (57%) of properties within 5 points of a 100-point Standard Assessment Procedure (SAP) score, and over 9 in 10 (93%) properties within 15 points.
The work we have undertaken has potential to provide more granular data and can help identify small geographic areas where properties have lower energy efficiency ratings.
Our results showed that including properties with missing scores would lower median energy efficiency scores across most of the UK (based on Lower Layer Super Output Areas or LSOAs), but particularly in rural areas and inner-city regions. Our work gave a more complete picture of the energy efficiency of housing, to help inform BEIS’s work on tackling fuel poverty.
However, there were limitations to the work. The models hit a ceiling in terms of how well it could predict the energy efficiency of a property based on a 100-point rating, and there was evidence that the model overpredicted low scores and underpredicted very high scores.
Table of contents
1. Background
The typical way of understanding the energy efficiency of a property is by looking at Energy Performance Certificates (EPCs). An EPC gives a property a Standard Assessment Procedure (SAP) score, and depending on the SAP score, a property is placed into one of seven bands from A to G, with properties in band A being the most energy efficient and properties in band G being the least energy efficient (Figure 1).
Figure 1: Standard Assessment Procedure (SAP) scores are classified into energy efficiency bands for ease of comparison between properties.
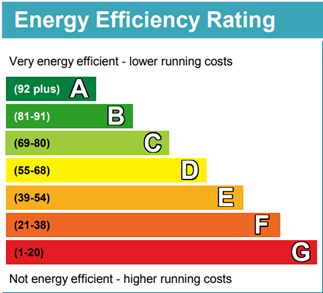
Source: Energy Performance Certificate template
The median energy efficiency score for dwellings in England that have had an EPC was 66 (band D) in 2021. However, only slightly more than half of domestic properties are in possession of an EPC, and for national monitoring of energy efficiency it was important to estimate what the EPC rating might be for these missing properties.
We were approached by the Department for Business, Energy and Industrial Strategy (BEIS) to explore if machine learning could accurately predict SAP scores for all individual properties in England using administrative data. This would build on existing work that explored the physical characteristics of housing that were good predictors of energy efficiency ratings, and data sources that might be helpful.
2. Approach
We identified property characteristics that were most strongly associated with the SAP score, sourced administrative data that could provide information on these characteristics, and subsequently trained and evaluated a selection of machine models that could be used to predict energy efficiency.
SAP scores represent the amount of energy a property consumes to maintain a defined level of comfort (such as a certain level of lighting and heating). As such, attributes like the size of a property, the insulation in the property, and the efficiency of any heating elements or lighting fixtures, all have a clearly defined effect on the property’s SAP score.
Many of these attributes are captured in the EPC data. We built a model, which confirmed the choice of the most influential characteristics. From this, we were able to identify several features that we wanted to find reliable sources of data on, including:
- total floor area of the property
- if the property was primarily heated by electricity or gas
- the type of property (for example, self-contained non-purpose-built flats, mid-terrace houses)
- the build age of the property
- the type of insulation (if any) in the property’s floors, walls and roof
- the condition of the property’s roof and external walls
3. Data
The data sourced and used in the selection of models came from several sources.
Council Tax Valuation Data
This contained information on a wide range of property attributes that were ultimately used in the final models. The main limitation of the dataset was the accuracy of the collected data, as this was often collected from outside the property and some values were based on assumptions made that could have impacted data quality.
For example, all properties were assumed to have central heating unless known otherwise, and the floor area of properties in this dataset often differed to the EPC data. Council Tax valuations are also not performed regularly for all properties and so some records will be out of date.
Land Registry Price Paid Data
The property sale price was used as a proxy for the general condition of a property.
Tenancy Deposit Protection Scheme
Variables on the rental amount and whether the property was rented out were used as a proxy for the general condition of the property. It is important to note that these data were only available for 2 million properties, about half the total number of rented properties in England.
Energy Company Obligation (ECO) Scheme
This contained data on newly installed energy efficiency measures for some properties and was powerful for predicting energy efficiency for those properties. However, it only had a small coverage, with information only available for 2 million properties.
Central Fit Register (CFR) Feed-in-Tariff Scheme
This contained similar variables to the ECO dataset but was again limited by the relatively low coverage of properties (around 800,000).
National Energy Efficiency Data (NEED) Framework: consumption data
This gave us an indicator as to whether a property was heated with gas or electricity at a given point in time, identified as a useful feature for predicting energy efficiency.
EPC data
As our target variable was EPC rating, we could not directly use this data source to make predictions. But we were able to calculate median SAP scores of the nearest seven properties with similar attributes that possessed an EPC, which was very powerful in the model.
Socio-demographic and meteorological data
These various data sources provided some limited information on the surrounding area, but many of the differences between areas seemed to be implicitly captured by including the median SAP scores of neighbouring properties in the model.
These datasets were all linked by the Unique Property Reference Number (UPRN) of each property, where needed, using our in-house solution for address matching.
4. Method
The joined data had many features with different distributions and often with distant outlier values. We took specific machine learning feature engineering steps to render the diverse datasets into a single comparable feature table (Figure 2). We performed robust scaling on all numeric features and clipped their values to a lower bound of the 0.5 percentile value and an upper bound of the 99.5 percentile value. We also performed one-hot-encoding on all categoric features. Any features that had a value of the same value for over 99.5% of properties were deemed uninformative and removed.
The model was trained on a random sample of about 630,000 properties. Properties in Bromley, County Durham, East Riding of Yorkshire, Lambeth and Milton Keynes were excluded from the training data and reserved for the final test set used to evaluate the final model. These locations were selected because the properties in these areas combined were broadly representative of England’s overall housing stock in terms of property size, age, type and Council Tax band, as well as having a relatively balanced proportion of the population in each Index of Multiple Deprivation (IMD) decile.
Figure 2: The ML feature engineering process detects and dynamically handles different feature types to generate a purely numeric features array that will work with ML algorithms.
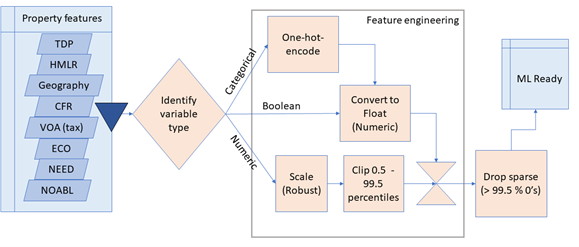
We used an XGBoost regression model, chosen because it performed well and because it would be able to model complex interactions between features. We also conducted some experiments using a Multi-Layer Perceptron neural network model, which after tuning gave very similar results to our XGBoost model, reassuring us that the chosen model was able to encompass the complexity of the data.
The primary metric was the proportion of properties correctly predicted to within 5 points of their true SAP score. In addition, we tracked the R-squared value of the model (the proportion of variance in SAP score our model could explain), the mean absolute error of the model’s predicted scores, and the model’s classification precision and recall (the proportion of properties assigned to each band that belonged to that band and the proportion of properties in each band that were correctly assigned to that band, respectively).
The project progressed iteratively; we built a model with a given set of data sources, evaluated the performance, explored potential bias, identified which input features were most useful, and determined whether we required additional data sources to improve the model’s performance.
5. Results
Our best model predicted over half (57%) of properties within 5 points of their true SAP score and over 9 in 10 (93%) properties within 15 points of their true SAP score. By contrast, a model trained with features from EPC data could predict over two-thirds (67%) of properties within 5 points of their true SAP score. This gives an indication of the importance of internal build details that are available in the EPC data (for example, the type of insulation in the property).
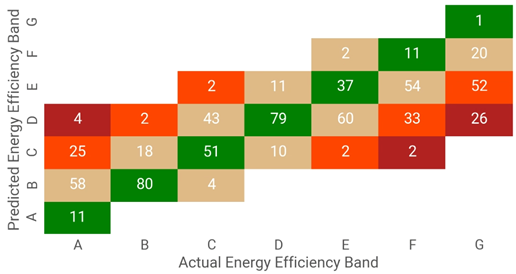
The model tended to overpredict low scores and underpredict very high scores (Figure 3). More specifically, the model was more likely to overestimate the efficiency rating of low efficiency (band E, F and G) properties and mis-classify some low-C rated properties as high-D – the latter was an important consideration given the government’s focus on getting properties to an EPC rating of C and above in the UK.
Figure 3: Predicted vs actual Energy Efficiency bands for the XGBoost Regression model. The model predicts efficiency scores, these are translated to the efficiency bands they would be classed as. Values shown are percent, summing vertically for each actual band. Colour indicates rank distance from true (green) classification. Most F and G properties especially tend to be predicted to have higher energy efficiency than actual.
We were able to use the predictions generated by our model to update estimates of the median SAP score of areas (LSOAs, Lower Layer Super Output Areas) across England, allowing us to gain a better understanding of how energy efficiency scores differ across the country when properties with missing information are included.
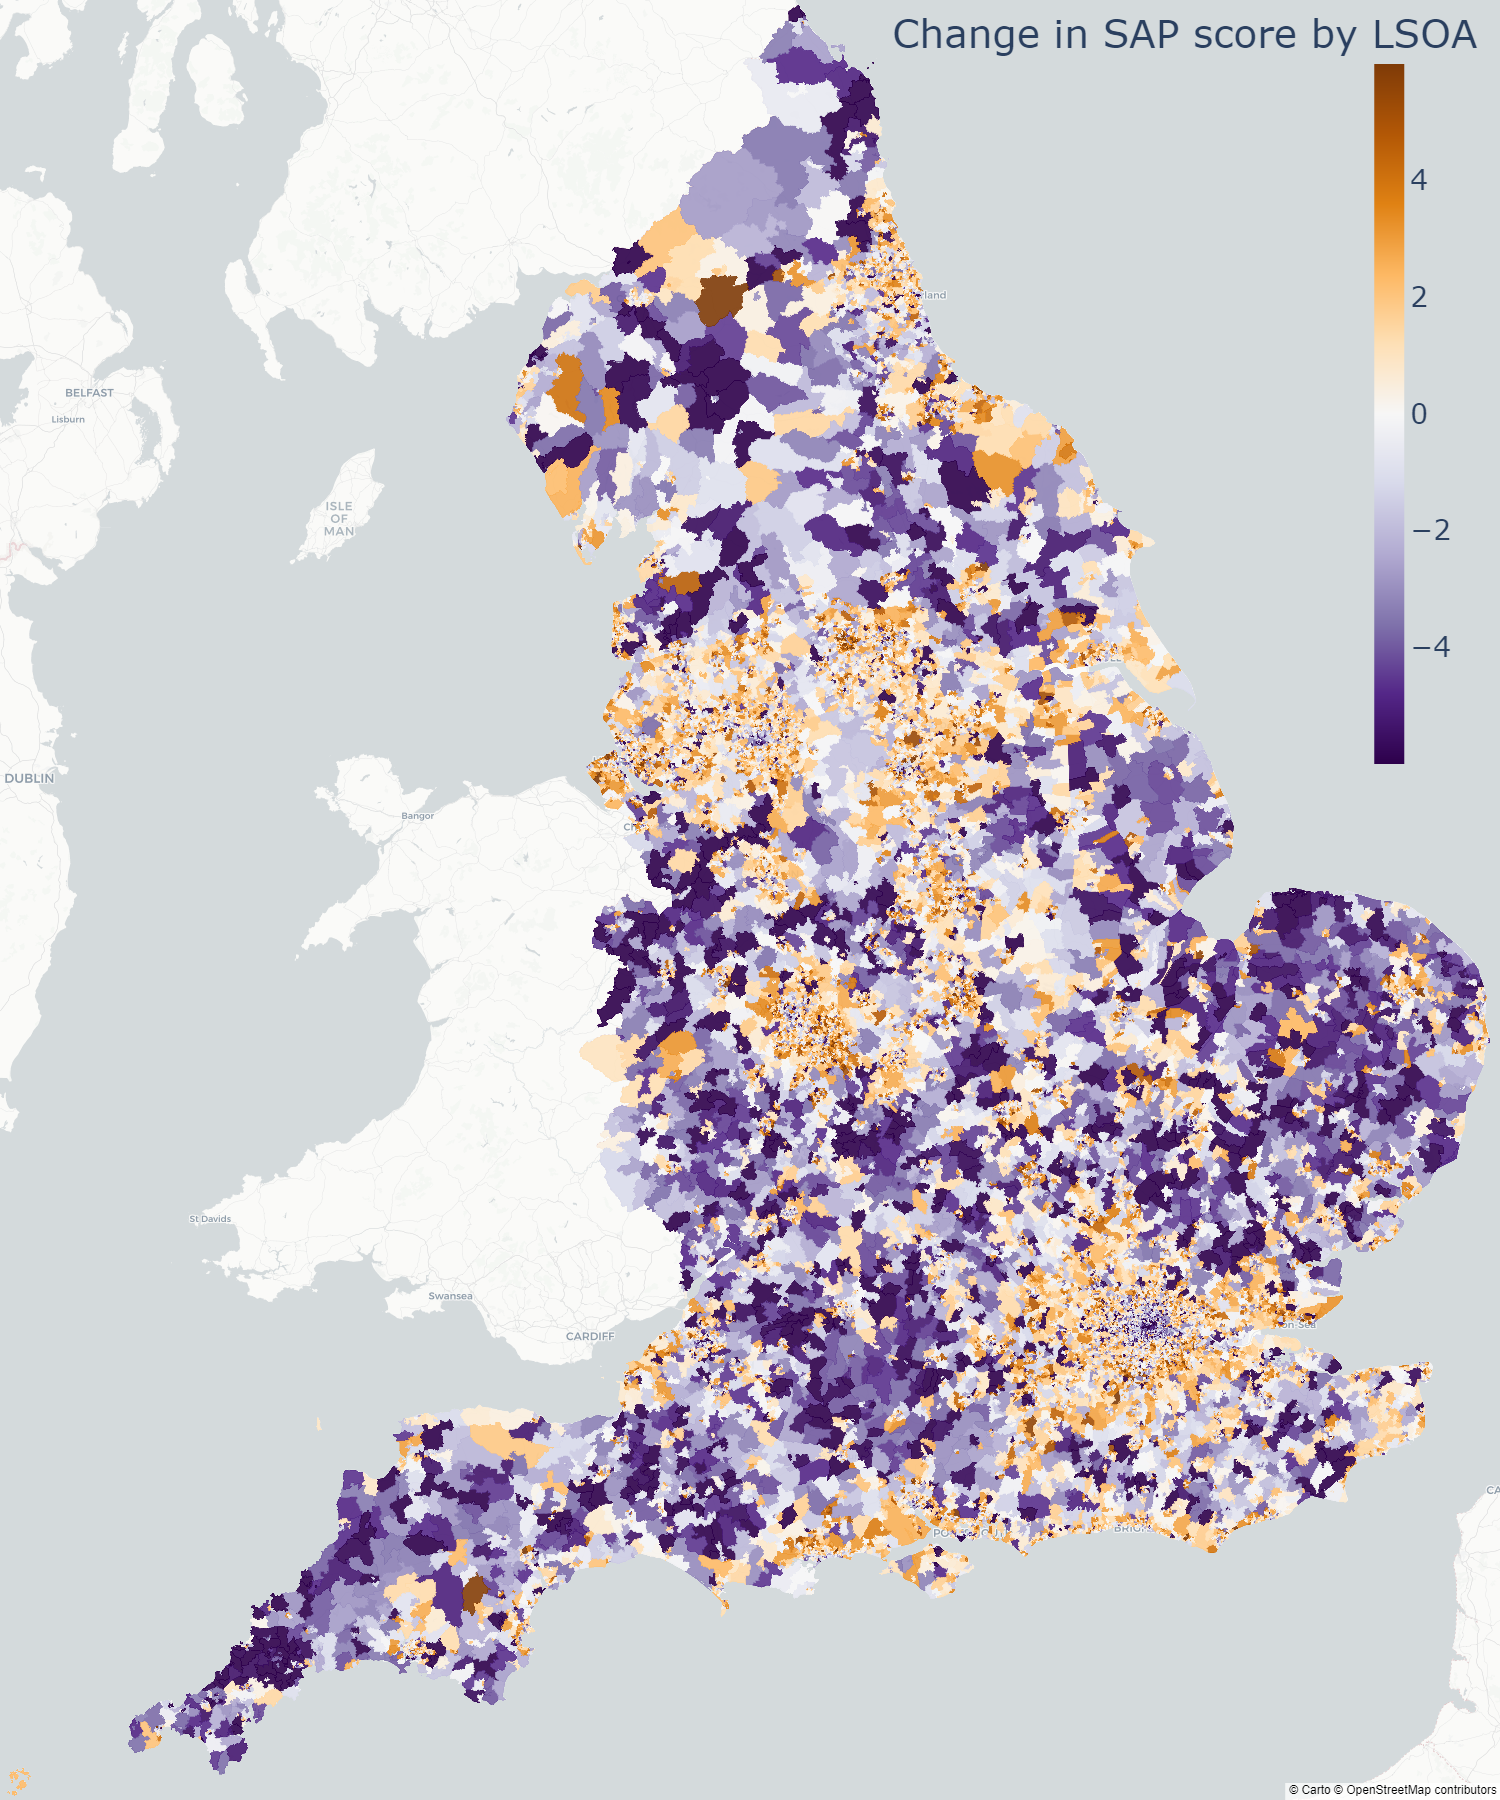
Figure 4 shows the change in median SAP score for small areas when the predicted scores of properties without EPCs are included.
It shows that considering only properties that possess an EPC rating will give a higher median energy efficiency score for the housing stock in England. Most areas see a drop in median SAP score (purple areas) when accounting for properties without an EPC. This is in line with expectations, as all new builds are required to have an EPC, and a property requires an EPC rating in band D or above to be let.
We also see that rural areas are likely to see a larger decrease in median SAP score (darker purple), while areas around towns and cities are more likely to have an unchanged median SAP score (likely because of having a higher proportion of properties with an EPC), or even a slight increase in SAP score (orange areas). However, inner-city regions also tend to see a decrease in SAP score.
Figure 4: The difference between the median SAP score when considering only properties with an EPC in an area, and the median SAP score in that area when we use our model’s predictions to also include a SAP score for properties without an EPC, for LSOAs in England. Purples are negative shifts, orange are positive.
6. Conclusion
By using admin data, we were able to broadly predict the energy efficiency of properties and the model could be used to identify some energy-inefficient properties. However, it overpredicted low scores and underpredicted very high scores and so results should be treated with caution.
The model helped us better understand the energy efficiency of houses without EPCs. It highlighted that area estimates of energy efficiency ratings relying solely on data from EPCs are likely to be overestimates, particularly in rural areas and inner-city regions. A potential further use case would be identifying small geographic areas dominated by lower efficiency housing.
The model could be improved with better data on property build characteristics like insulation type, but to our knowledge this can only be obtained from EPC data as they are typically obtained by physical inspection of the property.
7. More information on data sources
Council Tax valuation data
Data from the Valuation Office Agency (VOA) of property details used to assign properties to the correct Council Tax band. The dataset contains many physical characteristics of properties used to determine Council Tax bands, such as floor area, number of rooms, property type and if the property has central heating. Many of the physical characteristics available from this dataset were shown to be important features in predicting energy efficiency and so this dataset was particularly useful for the model.
The main limitation of this dataset was the accuracy of the collected data, The data are often collected from outside the property and often assumptions are made, for example, all properties were assumed to have central heating unless known otherwise, and the floor area of properties in this dataset were often quite different to the floor area for the same property as recorded in the EPC data. Council Tax valuations are also not performed regularly for all properties, so the records for some properties are very old and may no longer accurately represent the property.
Land Registry Price Paid data
Data from His Majesty’s Land Registry (HMLR) of the price paid on all property sales since 1990. Our intent in using this dataset was to use the property sale price as a proxy for the general condition of a property, which is something that may affect energy efficiency but is hard to measure with the other datasets available to us.
Tenancy Deposit Protection scheme
Data from the Department for Levelling Up, Housing and Communities (DLUHC) on the rent amounts, as well as other data about length of tenancy and number of tenants. This dataset was used in a similar way to the HMLR Price Paid data by using the rent amount as a proxy for property condition, as well as acting for a flag to indicate that a property was being rented out. Because of data issues, we only had information on around 2 million properties, which is about half of the total number of rented properties in England, limiting its use somewhat.
Energy Company Obligation (ECO) scheme
Data from the Department for Business, Energy and Industrial Strategy (BEIS) of energy efficiency installation measures, such as new boilers or insulation that energy companies installed in properties as part of the ECO scheme. This dataset contains data on the type of measure installed at a property and was incredibly powerful for predicting energy efficiency for those properties contained within it. The main limitation is that it only contains data for about 2 million properties and so provides no information for most of the housing stock.
National Energy Efficiency Data (NEED) framework
Data from BEIS of the electricity and gas consumption of all domestic properties. We avoided including the level of consumption in our model, as the model was intended to identify energy inefficient properties to address fuel poverty. Consumption would be artificially low in properties suffering from fuel poverty and so including these data would introduce dangerous bias to the model. However, the dataset could be used to create an indicator as to whether a property was heated with gas, which we had identified as a useful feature for predicting energy efficiency.
Central Fit Register (CFR) Feed-in-Tariff scheme
Data from BEIS of renewable energy source installation. This dataset was useful in a similar way to the ECO dataset but was again limited by the relatively low number of properties included (around 800,000).
Socio-demographic data
Various data sources from Office for National Statistics (ONS) statistics relating to the demographics and surroundings of local areas. These included rural-urban classifications of an area, population density, the proportion of the population aged older than 65 and younger than 16 years, and deprivation statistics from the Index of Multiple Deprivation (IMD). These statistics were aggregated at Lower layer Super Output Area (LSOA) level, an ONS statistical area averaging around 650 households, providing some limited information on the surrounding area.
Meteorological data
Since local temperatures and weather feed into SAP scores, we included data from the Met Office at local authority district (LAD) level from which the number of days the temperature dropped below zero degrees Celsius was derived and estimated windspeed at a property’s location roughly extrapolated from the Numerical Objective Analysis Boundary Layer (NOABL) wind speed database, which gives wind speed at points on a 1 kilometre square grid. The low resolution of these data sources limited their usefulness to the model.
EPC data
Data from DLUHC of the features recorded in EPCs. While we could not use this data directly as we were trying to predict SAP scores for properties without EPCs, we were able to use these data to create a feature for all properties that calculated the median SAP score of the closest seven similar properties that possessed an EPC. This feature proved very powerful.