Employing data science to analyse the use of preferential tariffs in free trade agreements
Preference utilisation rates (PURs) measure the extent to which UK businesses make use of the zero or reduced tariffs available via free trade agreements (FTAs). Their study has recently become a high priority for trade analysts, including in government organisations around the world. Moreover, after the UK’s exit from the European Union (EU), the UK has sought to replicate the effects of trade agreements that applied to it when it was member of the EU, to ensure continuity of trade. As PURs can be used as performance indicators for trade agreements, they could offer valuable insights to UK trade policymakers.
In this work, we study the take-up of preferential tariffs by UK businesses between 2009 and 2019 and examine their trends and patterns. To achieve this, we build a database which combines enterprise-level characteristics, transaction-level trade data and customs tariffs. We draw our insights with the aid of an advanced data science system, comprising statistical and machine learning techniques, that we developed for the needs of this study. Our system predicts utilisation of preference tariffs using information on trade transactions and firm characteristics. Our findings present evidence of business use of FTAs and could assist government policy and operational decision-making.
1. Introduction
Tariffs are taxes placed by governments on imports or exports of goods. They constitute a source of revenue, but they are also used to regulate foreign trade to protect domestic industries. All member countries of the World Trade Organization (WTO) have agreed to apply specific tariffs to their trading partners that are also WTO members. These tariffs form the scheme of most favoured nation (MFN) tariffs, which are the normal non-discriminatory tariffs charged on imports.
Several countries or states often form economic partnerships. These partnerships can take different forms, like FTAs and customs unions. In certain economic partnerships, like the EU’s customs union, goods trade is tariff-free among its members. In other economic partnerships, such as free trade agreements (FTAs), preferential tariffs are available for the signatories of an agreement and:
- preferential tariffs on some products may be set at zero
- preferential tariffs on other products are fractions of MFN tariffs
- some products do not benefit from a preferential tariff at all and so continue to be traded at MFN tariff levels
- preferential tariffs differ between partners and agreements
Unlike a customs union, further conditions often apply for transactions to receive preferential tariff treatment. For example, they may need to satisfy “rules of origin” requirements.
As of 1 January 2021, the UK is not in a customs union with the EU and EU trade agreements no longer apply. The UK has sought to replicate the effects of trading agreements that previously applied to it to ensure continuity for UK business. As preference utilisation rates (PURs) can be used as performance indicators for trade agreements, they could offer valuable insights to UK trade policymakers. In this work, we studied the performance of trade agreements available to the UK during the period from 2009 to 2019, by exploring the utilisation of preferential tariffs, available because of FTAs, by businesses between the UK and several countries of interest. Because of data availability, our study covered UK imports only and not UK exports.
Our work explored:
- what the key trends, patterns and discontinuities in PURs are over time and across agreements, sectors, UK regions, business types and sizes
- how PURs vary by any other relevant explanatory variable(s)
- how well variation in UK import PURs is explained by hypotheses proposed in the extant literature and by findings from empirical research in other country contexts. If the UK context differs in important ways from the literature and other country contexts, why is this?
- what subset of PURs are unusually low and not explained by hypotheses in extant literature and what might explain these unusually low PURs. Subsets could include certain agreements, time periods, business types, sizes, sectors and UK regions
To answer these questions, we developed an advanced data science system, which produces descriptive and predictive statistics to provide insights on the utilisation of preferential tariffs. Our system predicts utilisation of preference tariffs using information on trade transactions (for instance, product type, transaction) and firm characteristics (such as firm size, turnover). It uses both classical modelling techniques, such as logistic regression and modern machine learning algorithms, like random forests and gradient-boosted trees.
2. Literature Review
There are several recent studies on the utilisation of preferential rates, covering the key research areas.
One of the most popular areas in the literature is the study of how preference margins affect the uptake of preferential tariffs. Clearly, the main incentive for the usage of preferential tariffs is the reduction in duties. So an increase of the preference margin should result in an increase of the probability of preference utilisation. However, there are costs associated with the usage of preferences that could relate, for instance, to rules of origin and various procedures related to a shipment. Consequently, preferential tariffs may not be used unless the potential duty savings are high enough to overcome the procedure costs. Therefore, the transaction value is another important factor that should be studied in the analysis of the usage of preferential tariffs.
Several studies report that there is a positive relation between the preference margin and the utilisation of preferences. These include:
- New evidence on preference utilization (Keck, Alexander & Lendle, Andreas, 2012)
- The Utilization of Trade Preferences for Developing Countries in the Agri-food Sector (Bureau, J.-C., Chakir, R. and Gallezot, J., 2007)
- Rules of Origin for Preferential Trading Arrangements. Implications for the ASEAN Free Trade Area of EU and US Experience (Cadot, O. and de Melo, J. 2007)
- Determinants on Utilization of the Korea – ASEAN Free Trade Agreement: Margin Effect, Scale Effect, and RoO Effect (Hayakawa, K, Kim, H. and Lee, H.H. 2014)
- EU Exports and Uptake of Preferences: A First Analysis (Nilsson, L. 2015)
- Which Factors Determine the Utilization of Preferential Tariff Rates? (Lukaszuk, P. and Legge, S. 2019)
Additionally, some of this research also finds that an increase in transaction value results in an increase of the use of preferential tariffs. Indeed, for transactions of high value it may be beneficial to utilise preferences, even though the preference margin is low (Hayakawa, K, 2013). On the contrary, (Lukaszuk, P. and Legge, S. 2019) report that, when the preference margin increases, the use of preferences declines. Finally, no definite relation between preference margins and uptake of preferential tariffs can be identified in the analysis by the National Board of Trade Sweden in 2019.
We mentioned earlier that there may be procedure costs related to shipments, which could discourage the utilisation of preferential tariffs. These costs are studied in:
- The Utilization of Trade Preferences for Developing Countries in the Agri-food Sector (Bureau, J.-C., Chakir, R. & Gallezot, J., 2007)
- Preference Erosion and Multilateral Trade Liberalization (Francois,J., Hoekman, B. and Manchin, M., 2006)
- Preference Utilization and Tariff Reduction in EU Imports from ACP Countries (Manchin, M., 2006)
- How Restrictive Are ASEAN’s Rules of Origin? (Cadot, O. and Ing, L.Y., 2014)
The authors investigate whether there is a threshold in the duty reduction, under which traders have no incentive to utilise preferential tariffs, because procedure costs overtake the potential savings. They report that this threshold is likely to fall between a two to six percentage point difference between most favoured nation (MFN) and preferential tariffs. Note that these studies explore the procedure costs as a proportion of the transaction value. However, additional fixed administrative costs often exist (Keck, Alexander & Lendle, Andreas, 2012) and (Hakobyan, S., 2015).
Researchers have also investigated whether firm characteristics, such as size, could play a role in the utilisation of preferential tariffs. Explorations of the effect of firm size (Takahashi, K. and Urata, S., 2008) and (Takahashi, K. and Urata, S., 2010) report that large companies are more likely to utilise preferences. On the other hand, some research suggests that it does not affect the take-up of preferential tariffs (Wignaraja, G., 2014). More recently, the role of firm size has been studied indirectly where the results imply that its effect is unclear.
It is also argued that there may exist a variation in the utilisation of preferential tariffs at the transaction level (Wignaraja, G., 2014). However, this problem is difficult to explore because not many databases with transaction-level data are available. Investigations into the utilisation of preferential tariffs at the transaction level including the National Board of Trade Sweden’s “A transaction-level analysis of the EU–South Korea free trade agreement” plus recent research on whether to not to use trade preferences (Albert, C. and Nilsson, L., 2019).
Finally, wider research suggests other reasons for non-utilisation of preferential tariffs, such as businesses not always being aware that relevant free trade agreements (FTAs) are in effect, or what the specific procedures are to benefit from their preferential tariffs. Businesses may also believe processes will be too complex or confusing and hence opt to trade on non-preferential terms (without accessing the FTA’s benefits) instead. As this type of information is not captured in our transaction-level dataset, we were unable to explore this further in this study.
3. Methodology
Data
We studied preference utilisation rates (PURs) using transaction level data, addressing a research gap highlighted in (Wignaraja, G., 2014). Additionally, we explored the effect of several important factors, such as preference margins and value of transactions in the take-up of preferences, while we also investigated the effect of firm size.
Several studies have used traditional trade statistics, which are based on the imported products, their quantities and values. The advantage of using transaction-level data is that they include additional information, such as company identification, product type, value and frequency. They also hold information regarding the customs procedures that the importers utilised. We extract transaction-level data from the HM Revenue and Customs Trade in Goods database (HMRC TiG), which collects the UK’s international trade data.
To conduct analysis at the company level, we use the Office for National Statistics’ (ONS’) Inter-Departmental Business Register (IDBR), which is a comprehensive list of UK businesses used by the government for statistical purposes. This database includes approximately 2.7 million businesses from all sectors of the economy.
Our analysis covers the period from 2009 to 2019 and includes transactions from all countries of origin which are recorded in HM Revenue and Customs (HMRC) TiG.
Data science system
At a high level, our system consisted of two parts:
- data engineering, which links the transaction-level data to the company level data and then applies a series of filters to produce the final database. This is used to output descriptive statistics and will form the basis for the predictive analysis.
- machine learning, which takes as input the database produced by the data engineering part and utilises several algorithms to provide the predictive analysis.
We linked the HMRC TiG database to the IDBR, creating a combined database (known as TiG+IDBR). It combines transaction-level data with business characteristics and allows us to provide useful insights at a company level. This includes analysis of the utilisation of preferential tariffs by business size and UK region that the companies are based in.
The second step is to identify the transactions that are eligible for preferential tariffs, as these are required for the estimation of preference utilisation rates, based on the definition given in. We achieve this by utilising the International Trade Centre’s Market Access Map (MAcMap), a database that provides information such as customs tariffs, tariff rate quotas, regulatory requirements and preferential tariffs that apply, for each product. We first linked our TiG+IDBR database to MAcMap by matching the commodity code from TiG+IDBR to the product code from MAcMap at the 10-digit commodity level. Then, we removed all transactions not eligible for preferential tariffs by dropping transactions that do not have a corresponding preferential tariff rate in MAcMap based on the year, country and commodity code. We also removed transactions with values of less than £135 which are generally exempt from customs duties. Finally, following the methodology from, we refine our database by applying filters based on customs procedure codes (CPCs). Specifically, we focus on two CPCs: direct imports and custom warehousing, which make up most imports. We filter out a few transactions such as those for home use, or for temporary admission procedures.
The main goal of our system’s machine learning pipeline is to predict whether a transaction, eligible for preferential tariffs, would claim the preferential rate of duty. The prediction is based on several features, such as firm characteristics (for example size and turnover), transaction value and expected savings. This analysis will help us draw insights regarding the factors that could influence the utilisation of preferential tariffs. We solved a binary classification problem, where each data point in our analysis database, corresponding to a transaction, is assigned to one of the two classes depending on whether the transaction utilises preferential tariffs or not. The main concept of predictive analysis is to build a model, using a subset of the data points of the input database and then make predictions on the remaining subset of the database.
In our study, we aimed to replicate variables used in a recent study by the National Board of Trade Sweden. Furthermore, we extended analysis to some additional variables available, such as UK region, and whether the tariffs available were ad-valorem (AV) duties (levied on the transactional value of the import), or non-ad-valorem (NAV) duties (levied on weight, size or quantity of import).
The stages of the initial modelling process were:
- Feature engineering. We created simplified variables for annual business transactions, CPC type, MFN tariff type and preferential tariff type, for example, whether the tariff had an AV or NAV duty.
- Identifying correlated variables.We checked the chosen variables for collinearity to prevent problems with the Logistic Regression model, using a correlation matrix. This analysis unsurprisingly demonstrated that the MFN and preferential tariff types were correlated, so we combined the variables into a new one. The resulting duty type variable had one of four values, representing the possible permutations of duty types applied across the available two tariffs.
- Handling class imbalance. The dataset was imbalanced in the number of transactions that utilised a preferential tariff. We opted to address class imbalance though boosting the minority class, which in our case was transactions that did not use a preferential tariff. This method allowed us to retain as much real data as possible in the majority class. We used the Synthetic Minority Oversampling Technique (SMOTE) to generate additional data for the minority class, which provided new data points with very similar distributions of variables as the real minority data. It is important to note that synthetic data was only used to support the training machine learning models, and not used to test any of the models.
- Data processing. The data required further transformation in preparation for PySpark machine learning functions. For categorical variables, we applied label encoding to represent the values as integers, followed by one-hot encoding to remove relationships within a categorical variable induced by the label encoding. A single vector was assembled, which represented all the features used for analysis, with the classifier label remaining separate. Each feature was finally normalised to reduce the influence of outliers. This process was conducted each time the underlying dataset was changed, for instance whether we included synthetic data or applied feature selection.
- Classification machine learning models: We opted to explore three modelling methodologies:
- logistic regression
- random forests (RFs)
- gradient boosted trees (GBTs)
For the logistic regression model, we made use of the model’s weight balancing capabilities and therefore did not use the synthetic data. We found that the gradient boosted trees and random forest models were the most promising in terms of accuracy metrics, therefore we pursued these model types for model refinement. The logistic regression model performed poorly at correctly identifying transactions that used a preferential tariff, an unexpected result.
Model validation and tuning
We tested the stability of the random forest and gradient boosted tree models with stratified k-fold cross-validation. We used five folds for our analysis. First, we split the data into five equal subsets, with consistent weightings of transactions that used preferential tariffs, and used these to generate the five folds each with a distinct test subset. We ensured no synthetic data would “bleed” into the test data by performing the SMOTE process on the training data in each fold.
The cross-validation process showed the models were consistent and generalised to different test data. For both models, the accuracy results were consistent across folds with low variance. The cross-validation process also confirmed that the models were better at accurately predicting the minority class (no preferential tariff used).
Limitations
The modelling was constrained by the availability of matched data across the three datasets, and therefore the analysis is only representative of the data we were able to match, rather than of all transactions.
We have defined a transaction as being eligible for a preferential tariff if the transaction’s product code, country of origin and year match a preferential tariff from our source. This is a simplification that does not consider regulatory requirements.
The exact tariffs and potential savings used in analysis are estimates and should be treated with caution. Tariff data is complex; different tariffs may apply depending on factors such as the weight of goods and quotas. For NAV duties, the data provided estimated AV equivalent rates, which again may not accurately reflect the exact tariff due on any given transaction. For simplification, we opted to use AV equivalent rates in place of NAV duties, and average rates where there were multiple possible tariffs under the same trade agreement.
The data covered the period 2009 to 2019 for non-EU countries only so it does not represent trade following the end of the EU transition period in December 2020 or the impact of the coronavirus (COVID-19). Therefore, the machine learning models’ predictive capabilities for future trade may be impacted.
Finally, the impact of tariff rate quotas (TRQs) could not be analysed because of data limitations. TRQs allow a set quantity of a product over a defined time period (for example, one year) to be imported at lower import duty rates than regular MFN rates. Once the quota for lower duty rates has been filled, any more transactions must occur at a higher tariff rate until the start of the next period. The transaction data analysed in this report did not provide any information on TRQ imports so this could not be measured.
4. Descriptive statistics
This chapter gives an overview of our findings of tariff utilisation and how they vary across various factors in our exploratory analysis. We explore the preference utilisation rate (PUR) and other metrics across factors such as business size, industry, products being imported and the country of origin of goods. This will give us a broad understanding of the dataset’s characteristics including any emerging patterns that will not only generate insight but also inform the modelling stages.
Note that, where applicable, values are inflation adjusted with 2019 as the base year.
Definitions
Preference margin
The preference margin metric is central to our analysis. It is the reduction in the most favoured nation (MFN) import tariff by a preferential tariff, with the latter being almost always lower than the former. More specifically, it is defined as:
Preference margin = most favoured nation (MFN) import tariff – preferential import tariff
Preference utilisation rate
To quantify the utilisation of preferential rates, our primary measure will be the preference utilisation rate (PUR) as defined in the National Board of Trade Sweden papers:
Preference utilisation rate (PUR) = total transaction value of preferential imports/total transaction value of preference-eligible imports
Preference savings rate
The PUR gives us a ratio of imports utilising the preferential tariffs in terms of their transactional value (before duties), however, it does not give any information of the potential duty savings to businesses by the preference margin. The National Board of Trade Sweden papers also capture duty savings by calculating the preference savings rate which is defined as:
Preference savings rate (PSR) = total duty savings/total potential duty savings
Here, duty savings are the estimated savings realised by businesses in their import transactions, with potential duty savings defined as the estimated savings if all transactions utilised a preferential tariff. This is a useful metric which captures the utilisation rate of preferential tariffs as well as the actual and possible savings due to the preference margin.
Why we focus on preference utilisation rate
While the PSR provides some benefits above the PUR, we will primarily be using the PUR for the descriptive statistics because:
- for certain strands of this project, we compare the micro-data findings on preference utilisation with results from aggregate data from the EU. The aggregate data only allows the calculation of the PUR
- as some breakdowns show, the PUR and PSR provide similar ratios with the PSR usually being slightly higher and therefore conclusions with both metrics are not significantly different
- while we can identify which transactions have used a preferential tariff and their transaction value in the micro-data, we do not have information on the actual import tariff duty that was used. We make an estimation of which tariff duties should be used (based on the year, country of origin and product code) to derive the fields necessary for the PSR and other stages of the analysis, but they are estimations. With the PUR, there are no such caveats
Firm size
In our work we often break down our results by firm size, to investigate whether it plays a role in the utilisation of preferential tariffs. Our classification is based on, where firms are separated into categories based on the number of their employees. These are:
- micro
- small
- medium
- large
- extra-large
We merged the large and extra-large categories as there were very few datapoints falling into the extra-large category as shown in Table 1.
Table 1: Firm size classification based on the number of employees
| Firm size | Number of employees [31] | Number of employees (our work) |
| Micro | 1-9 | 1-9 |
| Small | 10-49 | 10-49 |
| Medium | 50-249 | 50-249 |
| Large | 250-999 | 250+ |
| Extra-large | 999+ | – |
Firm turnover
We investigated how firm turnover impacts the utilisation of preferential tariffs. Here, we use the reporting unit turnover variable from the IDBR database.
Tariff utilisation across business size
One of the key advantages of using micro-data is the examination of business characteristics and behaviour in tariff utilisation. We looked at utilisation and other metrics across the size of businesses. Our business size categorisation is based upon the number of employees of the business in the year of the import transaction.
A common assumption is that smaller companies are less likely to use preferential tariffs within free trade agreements, but our analysis shows that smaller businesses, may operate these tariffs more efficiently than larger ones. Figure 1 shows the PUR across the business size for the period from 2009 to 2019. Overall, we found that relative utilisation of preferential tariffs is high across firms of all sizes, which is consistent with the findings reported in.
Figure 1: Preference Utilisation across business size (%)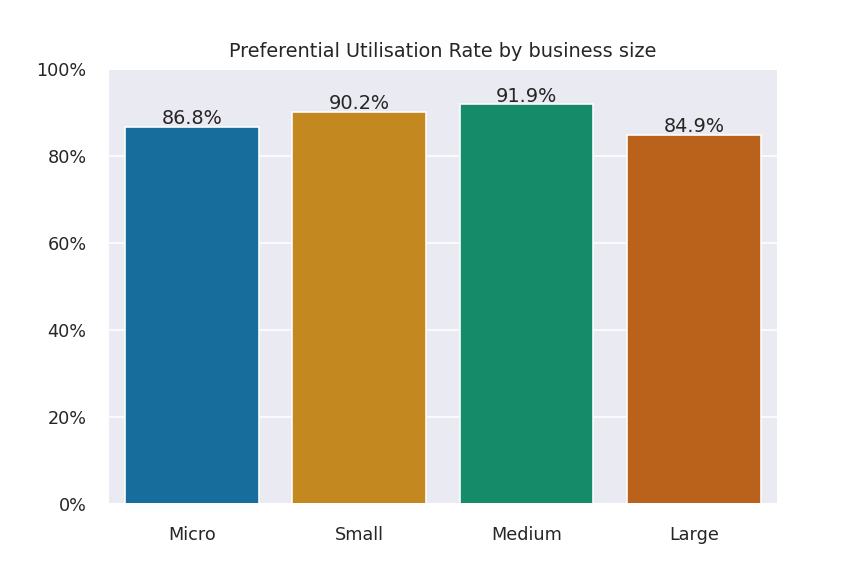 A similar picture is seen for the PSR (88% for micro. 92% for small, 95% for medium, and 88% for large). Note that the data contains just over 50,000 unique businesses across the 10-year period with micro businesses making up more than half of all businesses. The Annex provides more details on the business breakdown. Small (90.2%) and medium (91.9%) businesses are the most efficient utilisers of preferential rates for their imports, with micro (86.8%) and large (84.9%) businesses following behind.
It is useful to understand the utilisation rate across the business sizes, but where are the bulk of duty savings (and therefore import transactions) being made? Figure 2 shows the total duty savings across these business sizes.
Figure 2: Estimated duty savings across business size (£)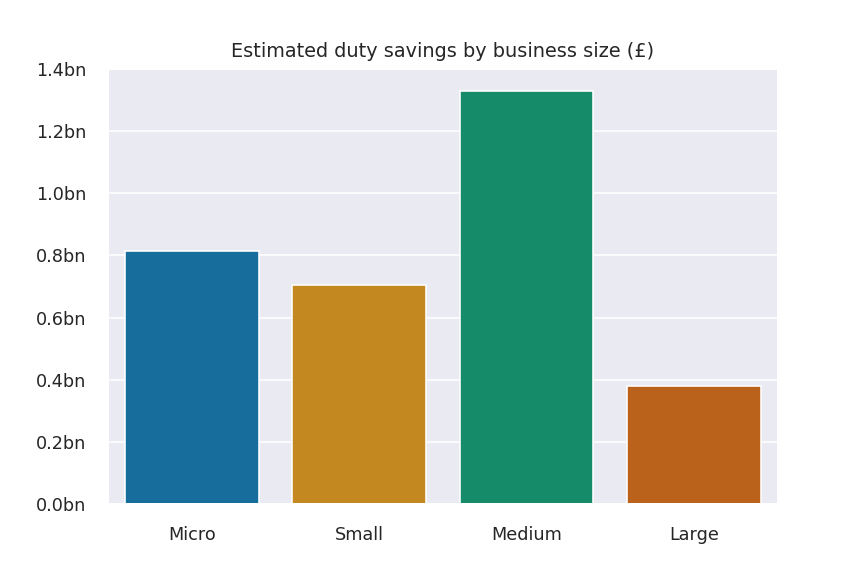 The majority of import transaction value is from medium businesses who represent 12% of all businesses in the data. They also see the greatest duty savings from using preferential rates. This is followed by micro businesses (56%) and then small (29%). Large businesses (3%) see the least duty savings.
Note that the figures shown here are not intended to reflect national statistical estimates of duty savings, but to represent the characteristics of businesses in this dataset.
While it is important to understand where most of the duty savings are being realised in our data, it appears that the business size is not a significant factor when looking at preference utilisation. As with all other features, we can test this in the modelling section.
Tariff utilisation across product type
The transaction-level data on imports used in this project provides rich data on the types of goods being imported including their value (in GBP) and other factors. There may be patterns in the utilisation rate over the types of products being imported that could be improved.
The product categories of imported goods are based on the harmonized system (HS), an international nomenclature for product classification. As with the business standard industrial classification of economic activities (SIC) classes, we present the HS product categories at the highest level. Figure 3 and Figure 4 show the preference utilisation rate by product type with the latter showing trends over the years.
Figure 3: Preference Utilisation Rate by product type (%)
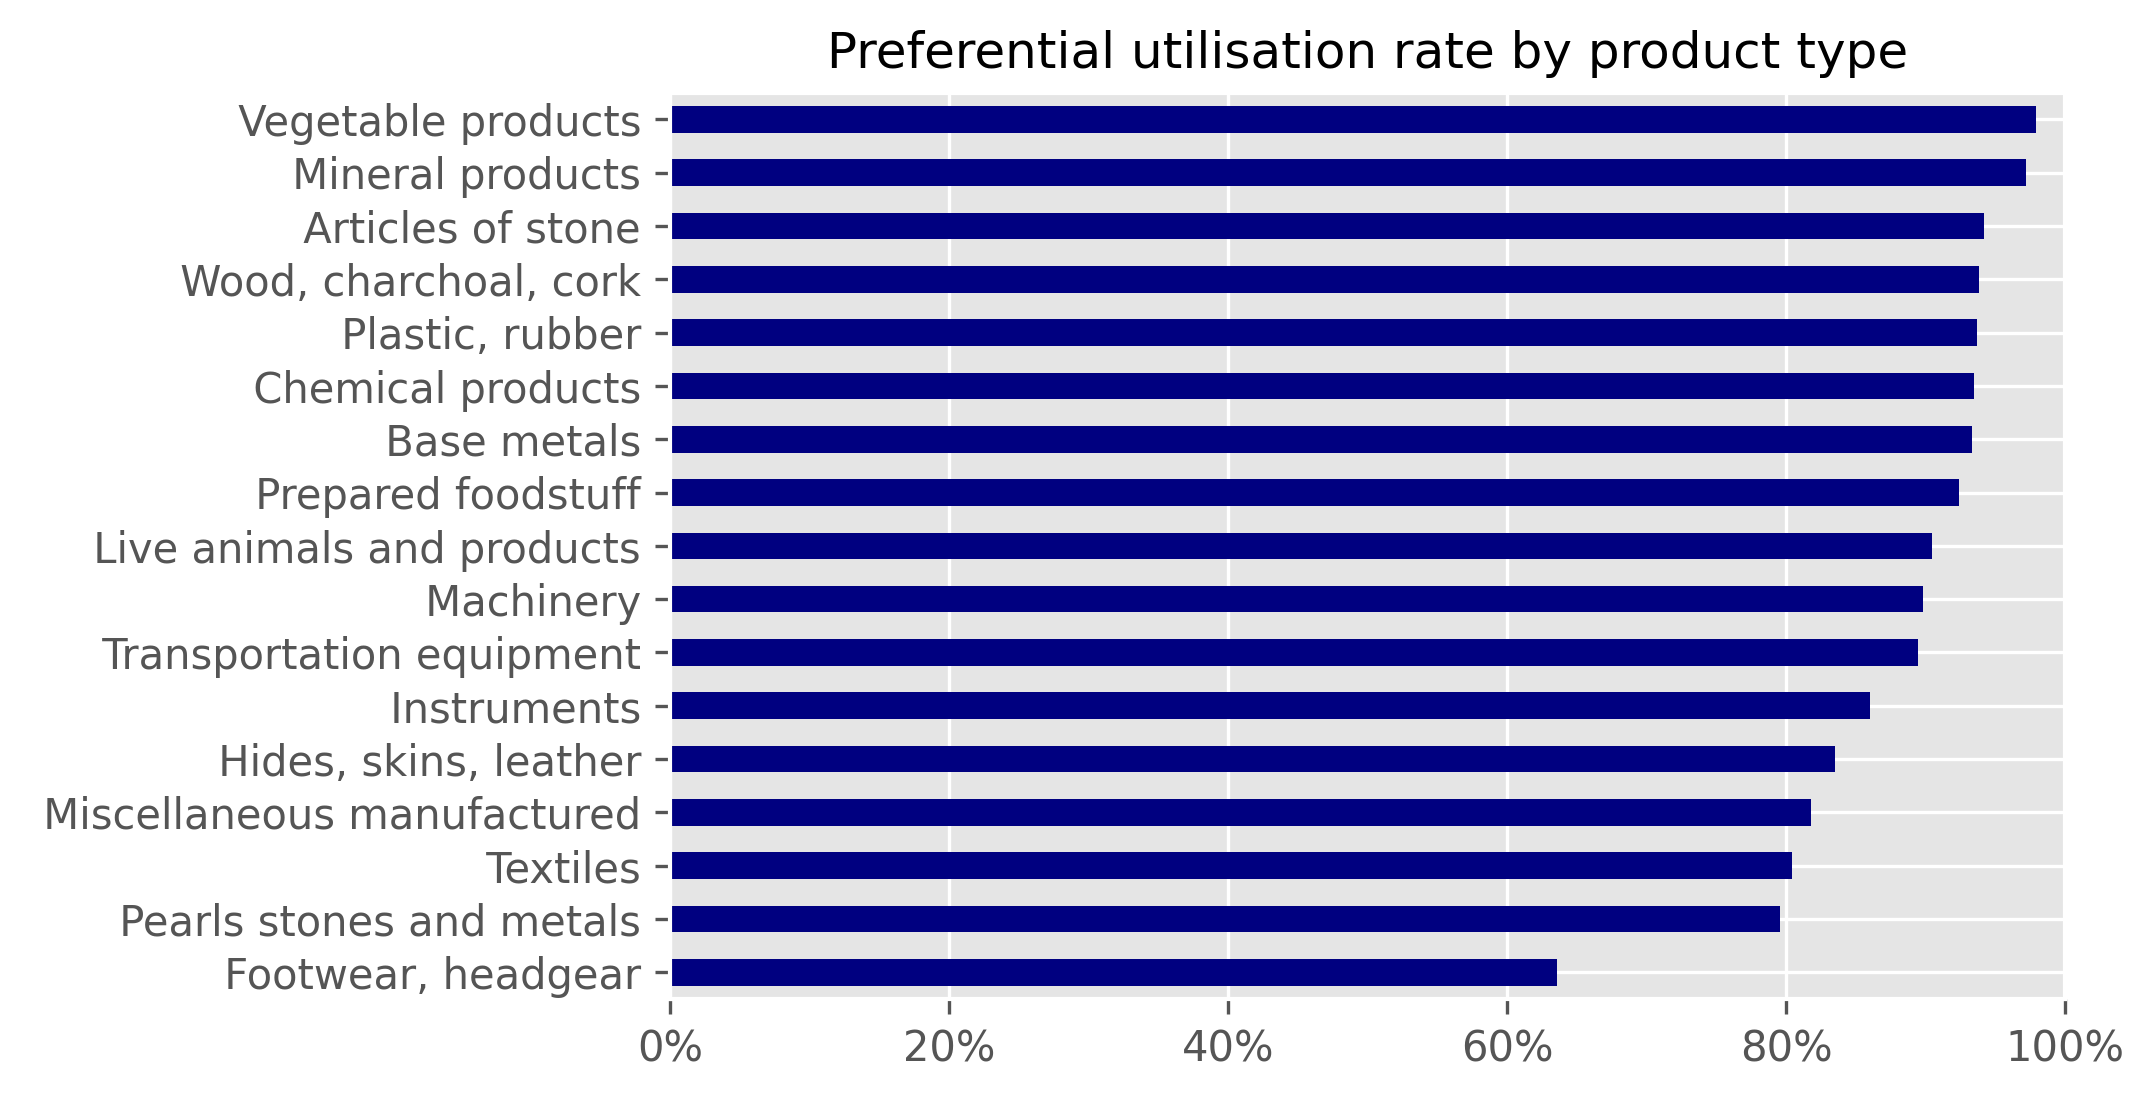
Figure 4: Preference utilisation rate by product type and year (%).
Sections 1 to 4 (primarily agricultural products), have excellent utilisation rates and this is consistent over the years. However, imports of materials such leather, textiles and pearls/stones have more modest PURs, just over 80%. Textiles is an interesting commodity as it has a relatively low PUR but makes up a large amount of total duty savings as shown in Figure 5.
Figure 5: Estimated duty savings by product type (£)
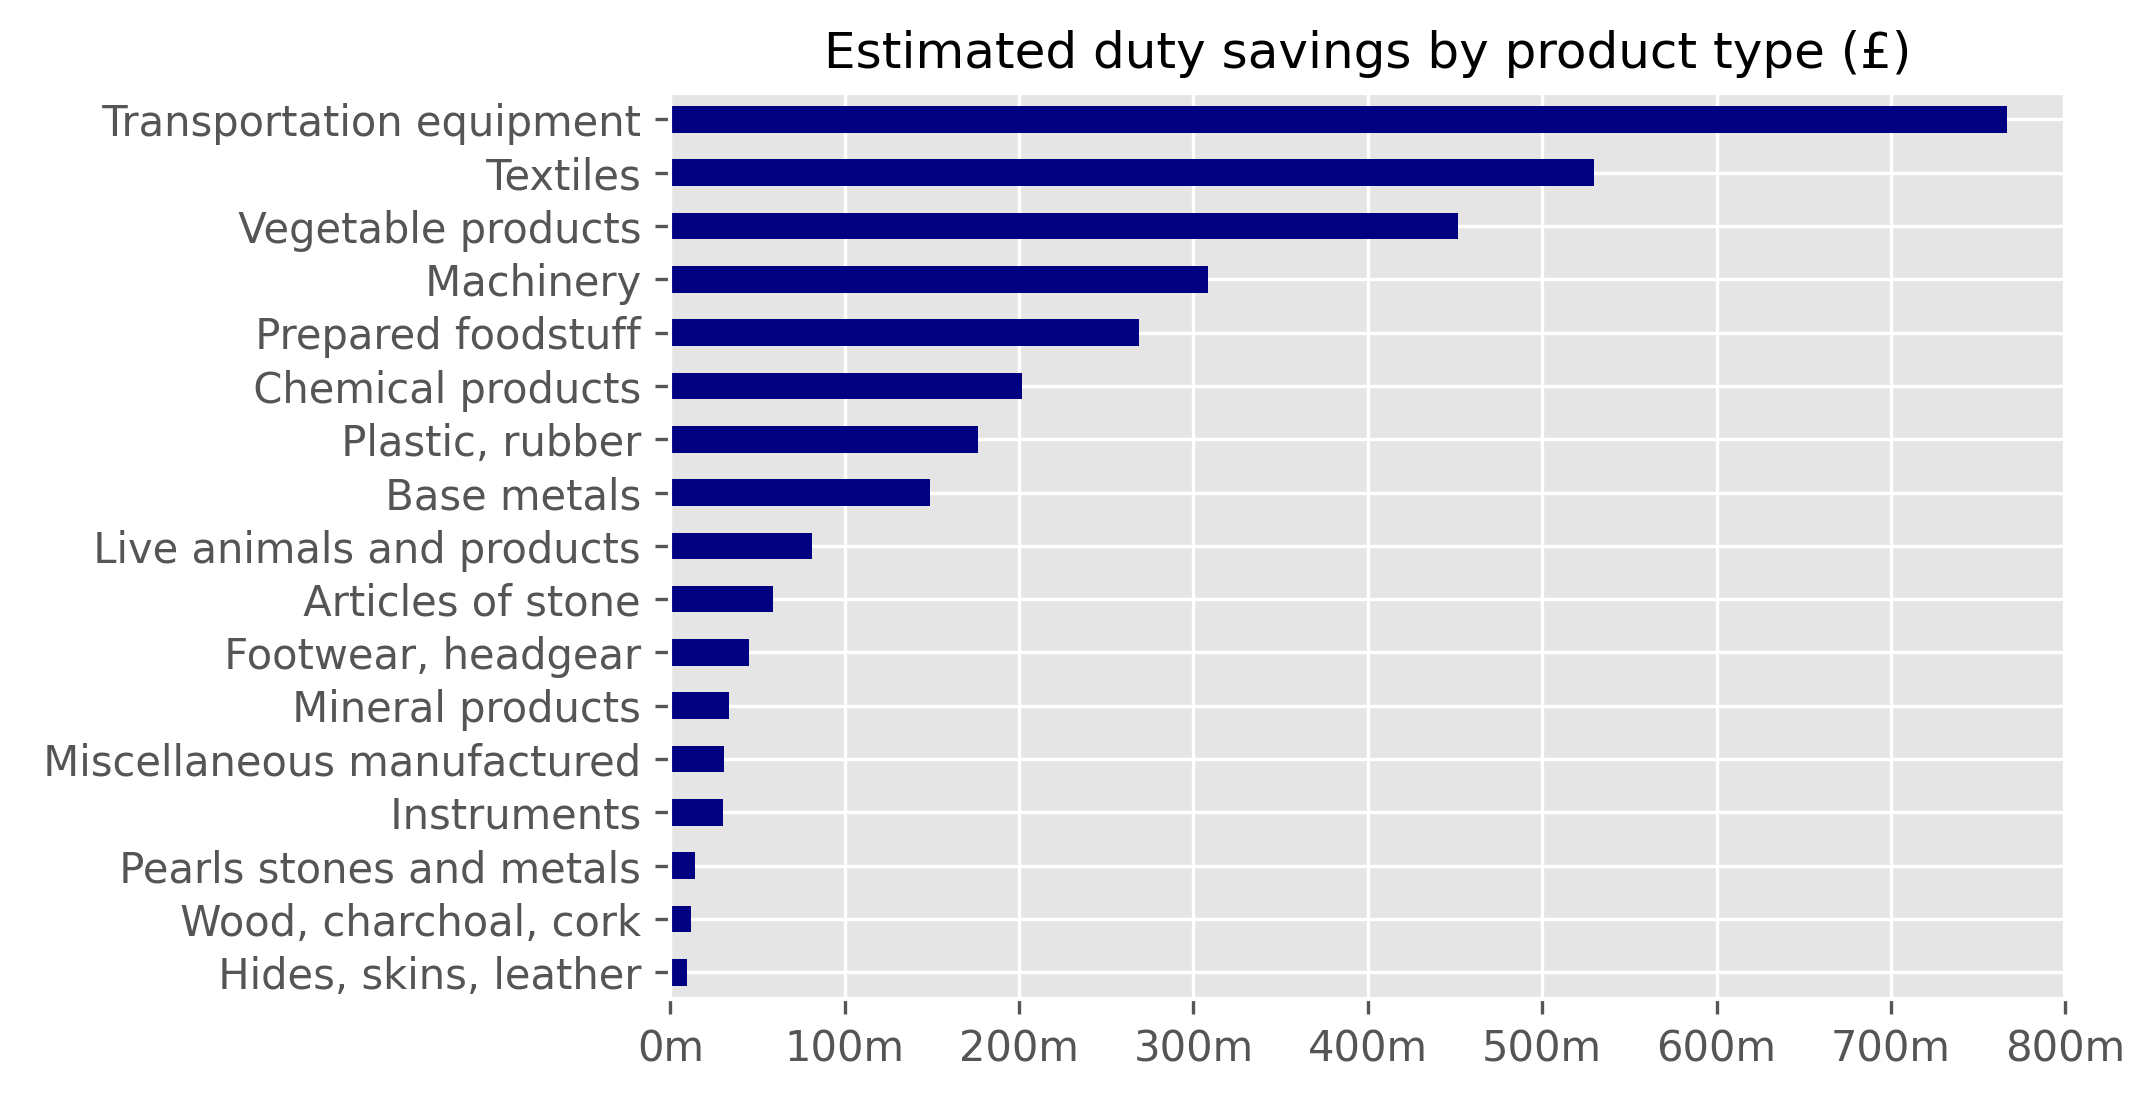
Transportation equipment, textiles and vegetable products make up most of the duty savings from preferential tariff imports. Vegetable products have the highest PUR, transportation equipment has had a more volatile PUR over the years, but textiles consistently have a low PUR.
It is reasonable to conclude that the types of products being imported does have an impact on the utilisation rates, and these could be dictated by the rules of origins for certain products that could be unearthed at a more granular HS level.
Tariff utilisation across business location (UK region)
When studying the utilisation of preferential tariffs in individual UK regions (Figure 6), we notice that North East and South West of England stand out with low utilisation, though the volumes of transactions in these areas are much lower than other regions. Please note that our database only gives the region of an enterprise’s reporting unit and therefore, UK region results are indicative.
Figure 6: Preference utilisation rate by UK region (%)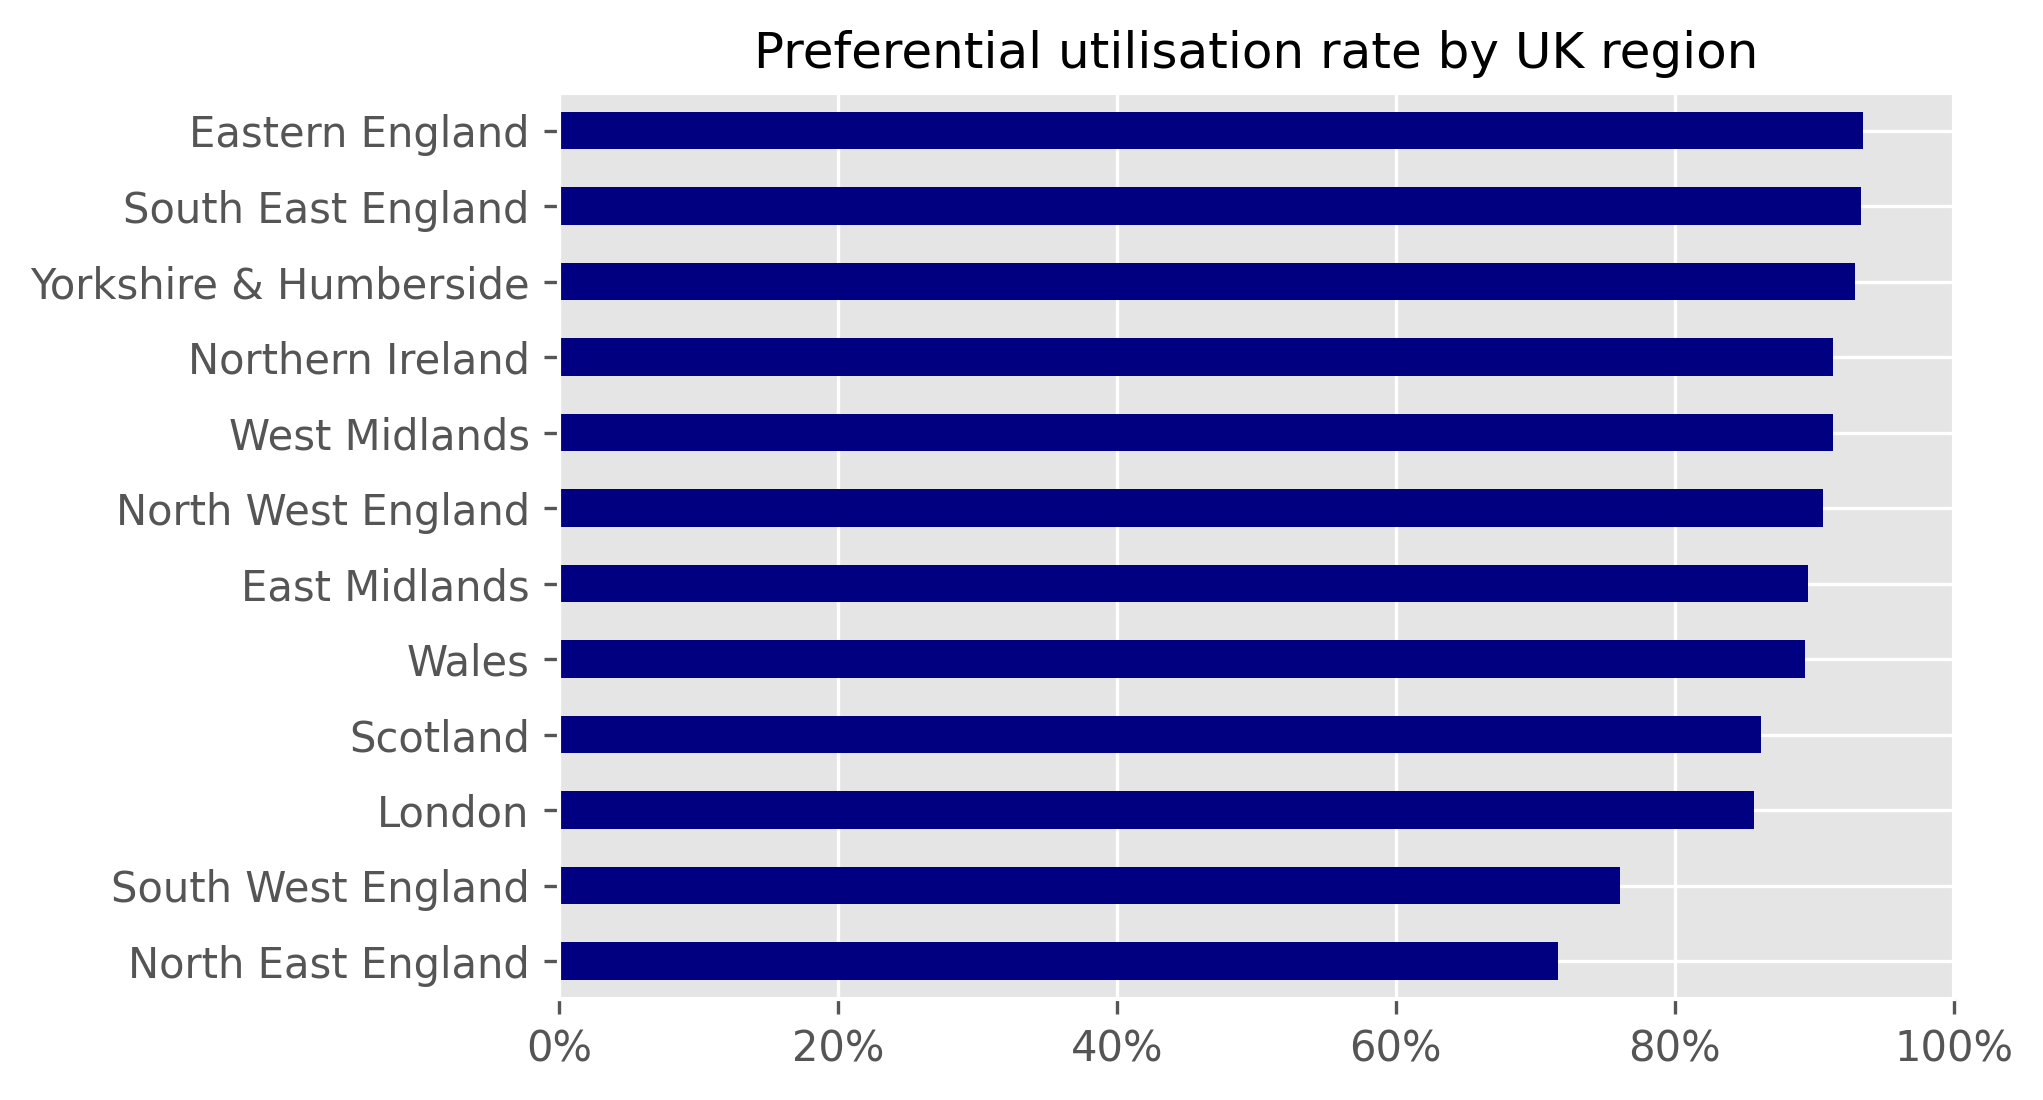
Figure 7: Preference utilisation rate by UK region and year (%).
We investigated this finding further by looking at preferential tariff utilisation in UK regions for each year in the period between 2009 and 2019 with the help of a radar chart (Figure 7). Utilisation dropped abruptly in the years 2013 and 2014 in both regions and it has been improving since then. Still, in 2019, the last year of our data, utilisation in the North East of England remains below the rest of the UK. We also find that utilisation in Wales has dropped over the years, although in this case we did not observe an abrupt fluctuation. Note that regional differences could be influenced by the limitations of the dataset, such as how the “Rotterdam effect” may impact on trade reporting. A question that remains is why regions have different PURs, and whether business in regions could be better supported in order to improve their ability to benefit from preferential tariffs, which would in turn be shown by a rise in the regional PUR.
Figure 8: Estimated duty savings by UK Region (£)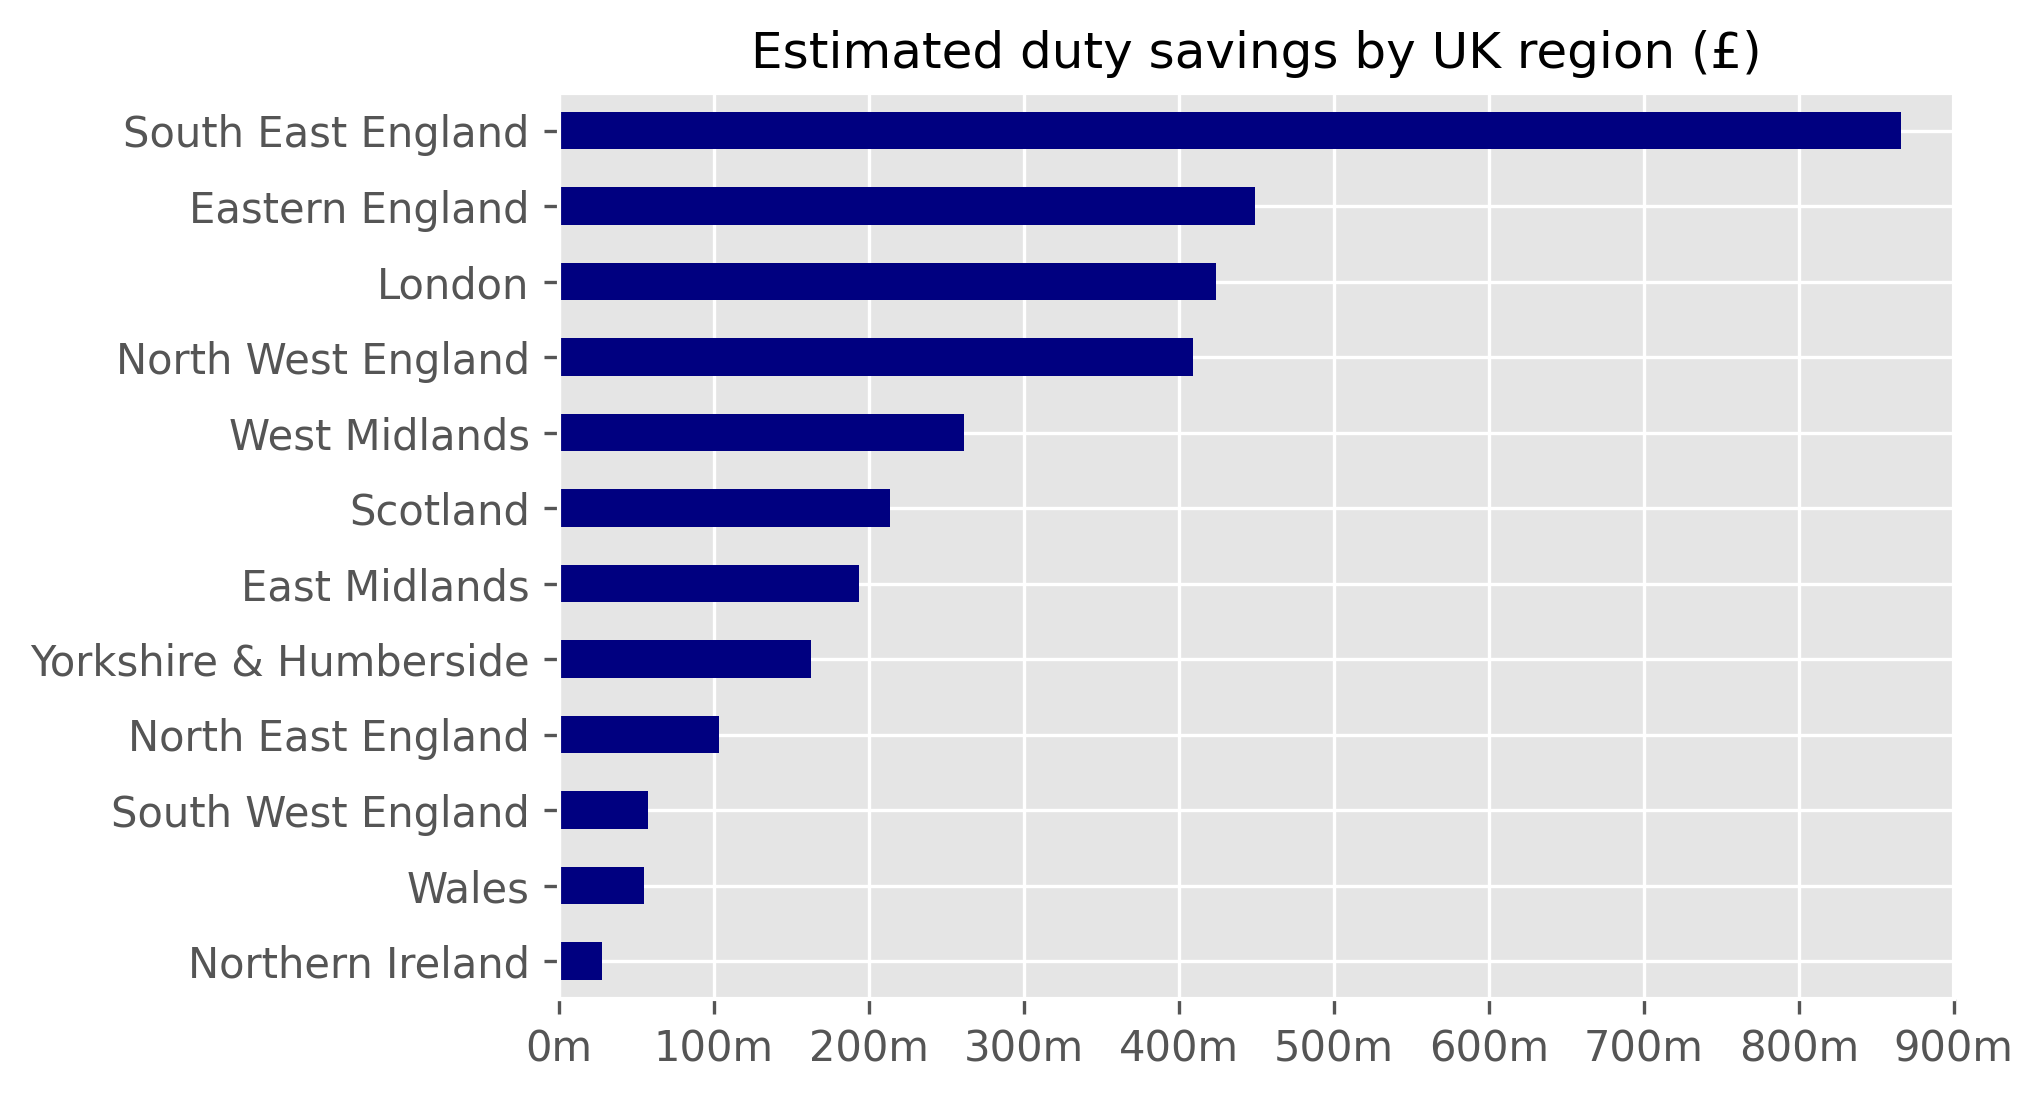
The North East and Wales, with lower PURs, also have low total duty savings. However, despite a lower PUR, businesses in SE England make up most of the total duty savings, a reflection of the increased volume of imports in this region.
Tariff utilisation across country of origin
We now explore the extent to which the country of origin of imported goods affects the utilisation of preferential tariffs. Preferential tariffs (and non-tariff measures) are determined by free trade agreements with these countries with the objective of liberalising trade, so it would be fair to assume that the utilisation would vary based on the country that goods are being sourced from.
Due to the large number of countries in our dataset, many of which are not of interest due to low volumes of trade, we instead focus our exploration on a set of ‘priority countries’. These have generally been selected based on trade flow volume.
Figure 9: Preference utilisation rate by country of origin (%)
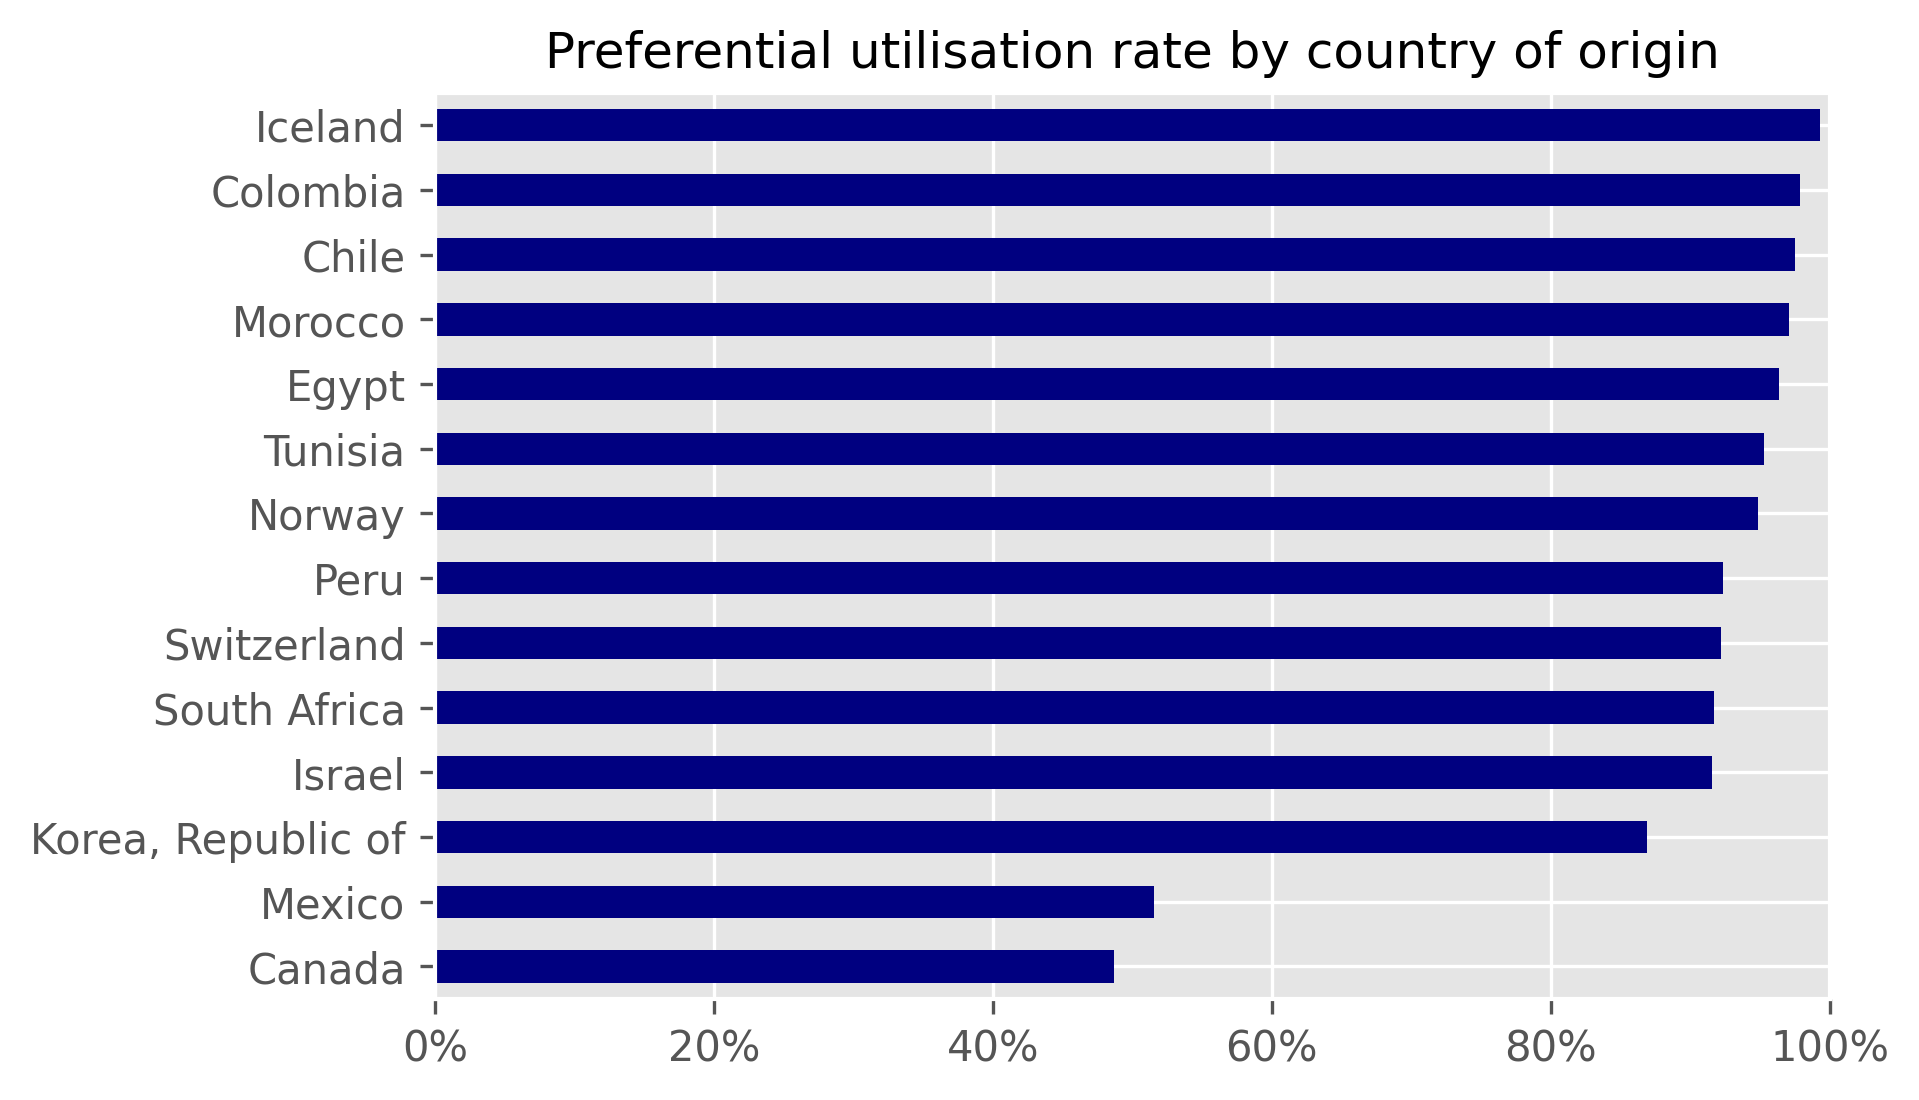
Figure 9 shows the PUR by the country of origin of goods. There are clear differences here in the efficiency of tariff utilisation and these might be due to the preference margin and admin burden of rules of origin requirements in the underlying agreements. South American countries such as Chile, Colombia and Peru have relatively high utilisation rates, as do Morocco and Egypt, which represent a sizeable amount of trade. Korean imports account for the largest duty savings in this data and the utilisation rate here is just under 90%. Canada and Mexico on the other hand have poor utilisation of preferential tariffs, but it is important to note that preferential tariffs with Canada were only recently established, given the free trade agreement only recently came into effect, and we therefore have few years of data here to draw upon. The table in Figure 11 shows the years of implementation for FTAs with these countries and how the PUR varies over time.
Figure 10: Estimated duty savings by country of origin (£)
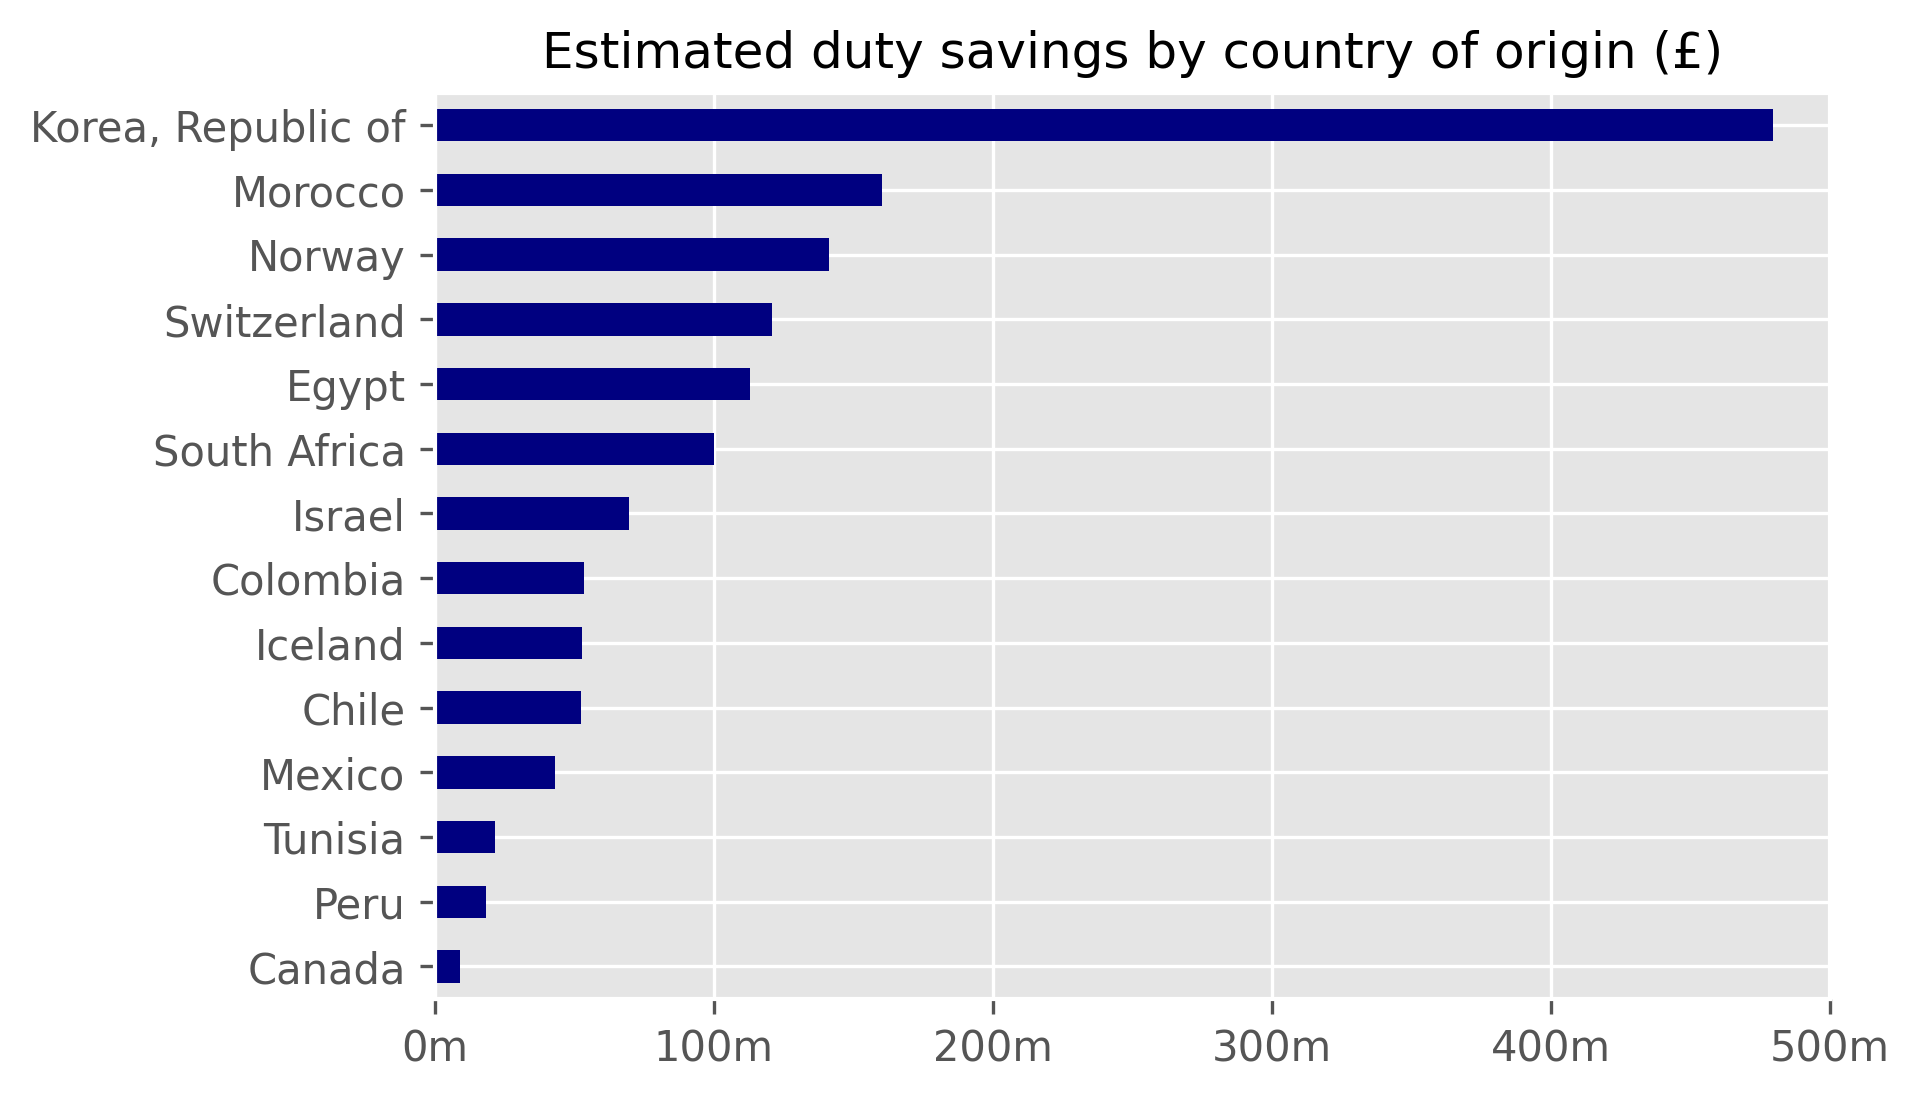
Figure 11: Preference utilisation rate by country of origin (%), by year
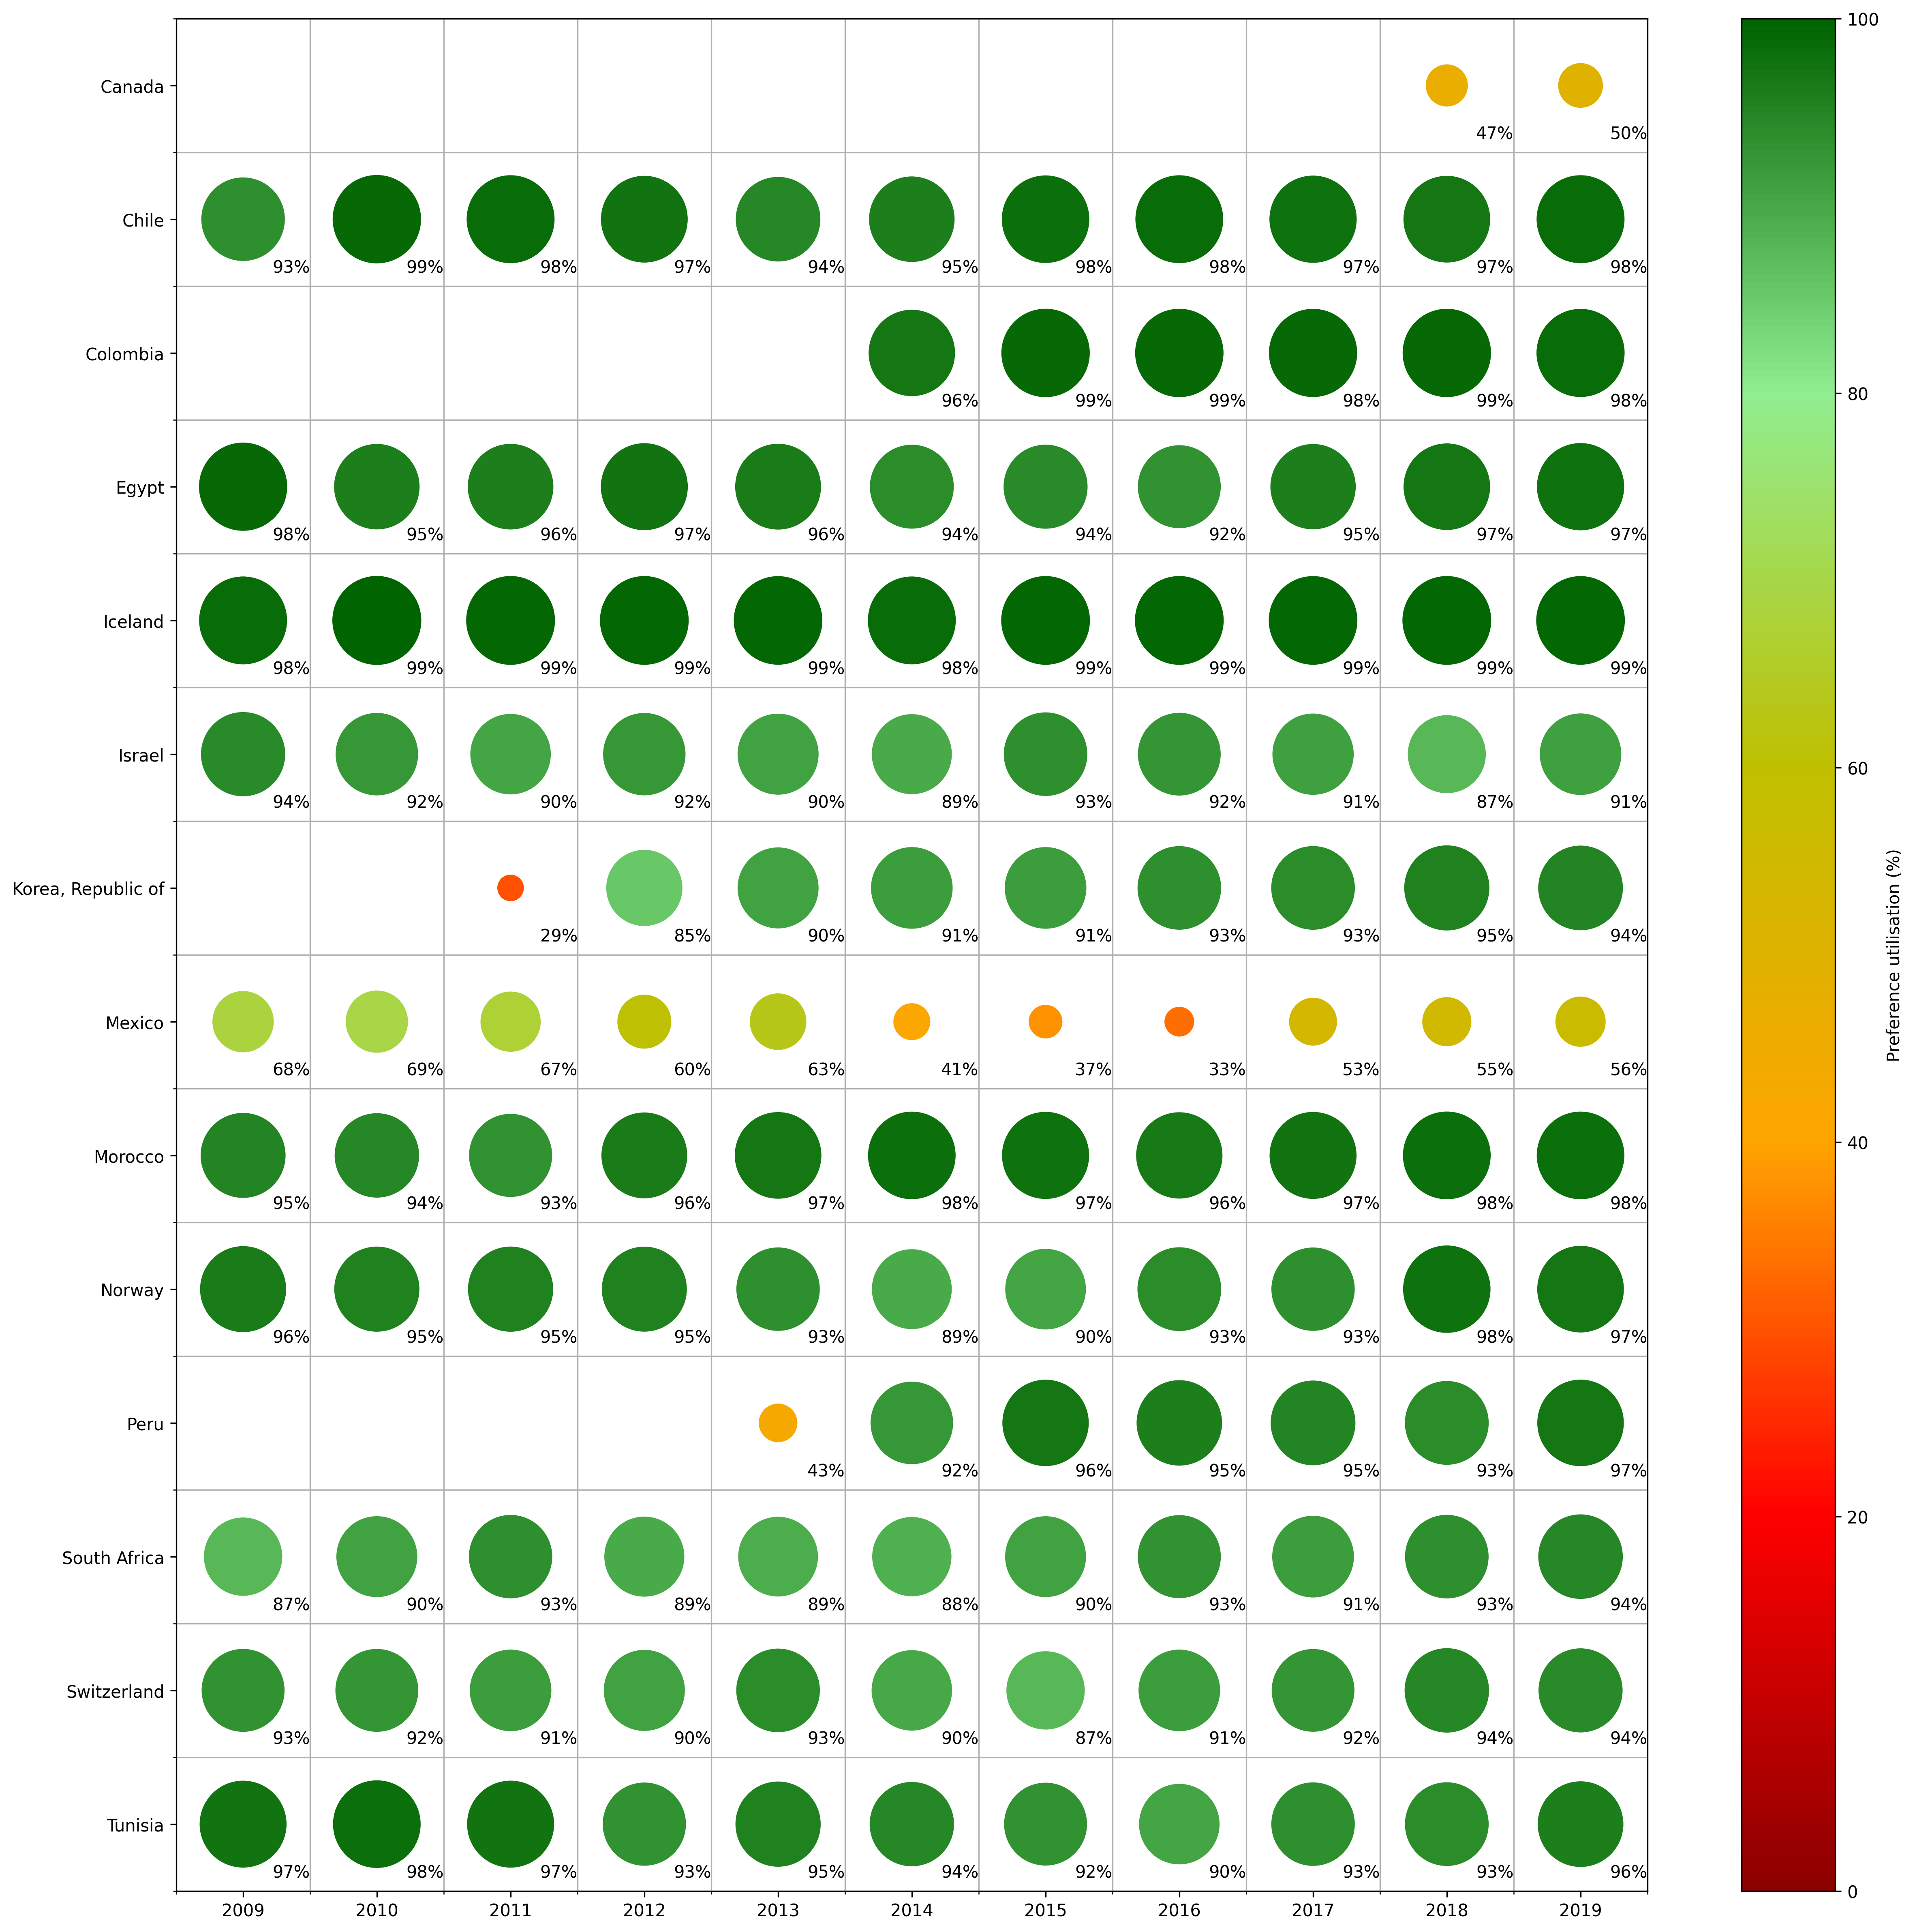
There are differences in the PUR based upon on the country of origin and these presumably are dictated by the rules of origin requirements for products within FTAs and the actual preference margins (for example, the savings from the MFN rate) in the agreements. On the other hand, the utilisation can also be affected by the actual products being imported and product-specific barriers from certain countries.
We should caveat that preferential tariffs are established in the year in which FTAs are enacted. We therefore have an inconsistent time series of data with countries dropping in and out depending on the signatory of FTAs. Because of this inconsistency, it would make sense to ignore the countries as a feature in our Machine Learning models, which are trained upon all transactions.
Another avenue of exploration is the country of dispatch (rather than origin) of these imported goods to identify how utilisation and other metrics vary. While they may not dictate the preference rates and rules of origin requirements of the underlying imports, they may point to patterns in trade supply routes.
Tariff utilisation across import transaction value
Access to the micro-data on trade makes it possible to explore patterns within the actual import transaction values with respect to tariff utilisation. These values are available and presented before any import duties are applied. We present findings about company size and product category. Figure 12 shows how the average transaction values vary by business size and the use of a preferential tariff.
Figure 12: Average import transaction value by company size (£)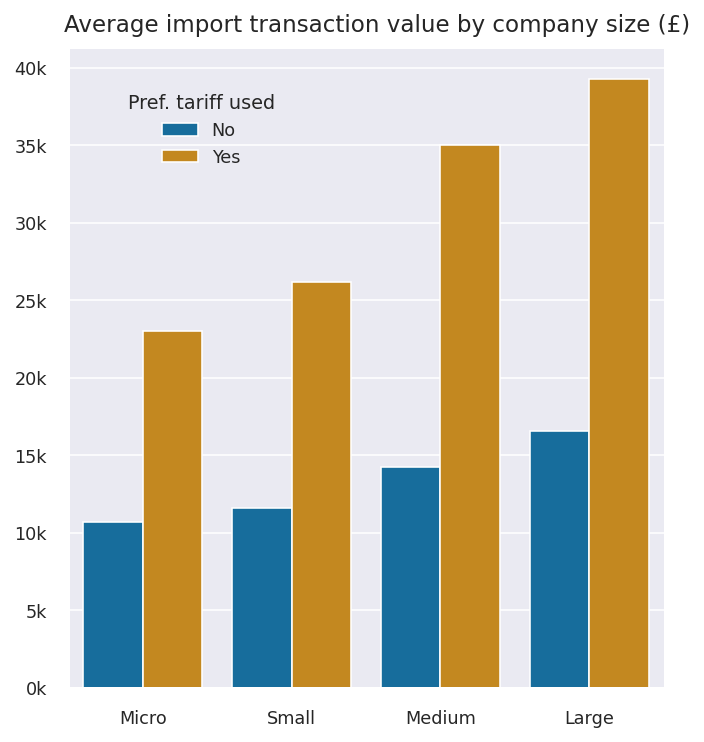 This is perhaps the clearest indication of a driver of utilisation in the average value of an import transaction. Across every business size, on average, transaction values are almost double where preferential tariffs are used compared to those where they are not. This suggests that businesses across all segments are more incentivised to use preferential tariffs (and bear the cost of any underlying administrative burden) for imports that are higher in value. Also, the larger the businesses, the higher on average each import transaction is. We see a similar pattern in Figure 13 which graphs the average preference margins across the same categories.
Figure 13: Average preference margin by company size (%)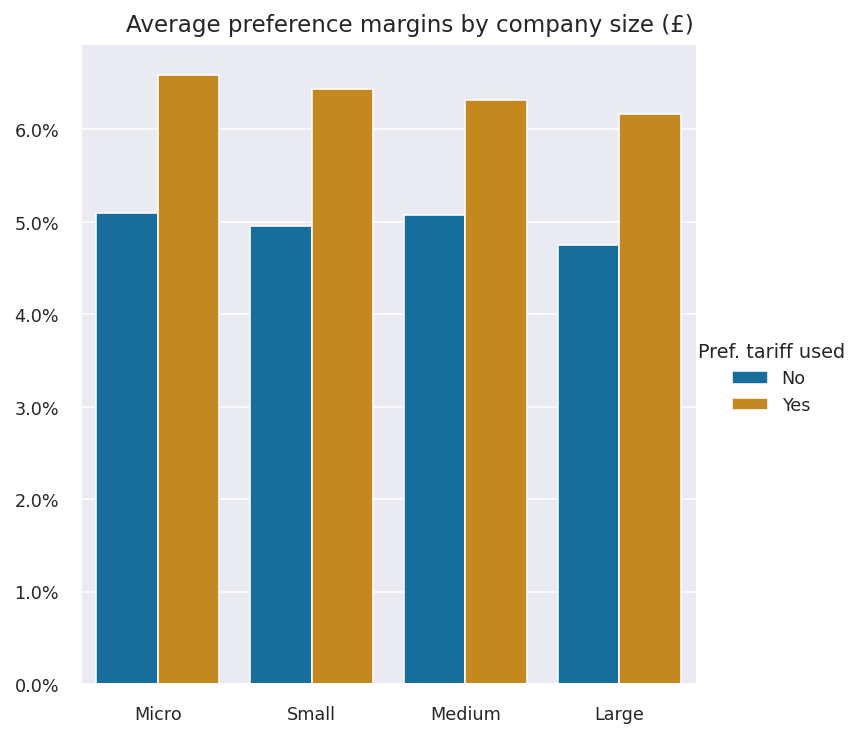
The preference margin, the difference between the preferential rate and MFN rate, is roughly 1 percentage point higher in transactions where preferential tariffs are used. This is consistent across business sizes. Figure 14 shows a breakdown of average import transaction values by product categories.
Figure 14: Average import transaction value by product category (£)
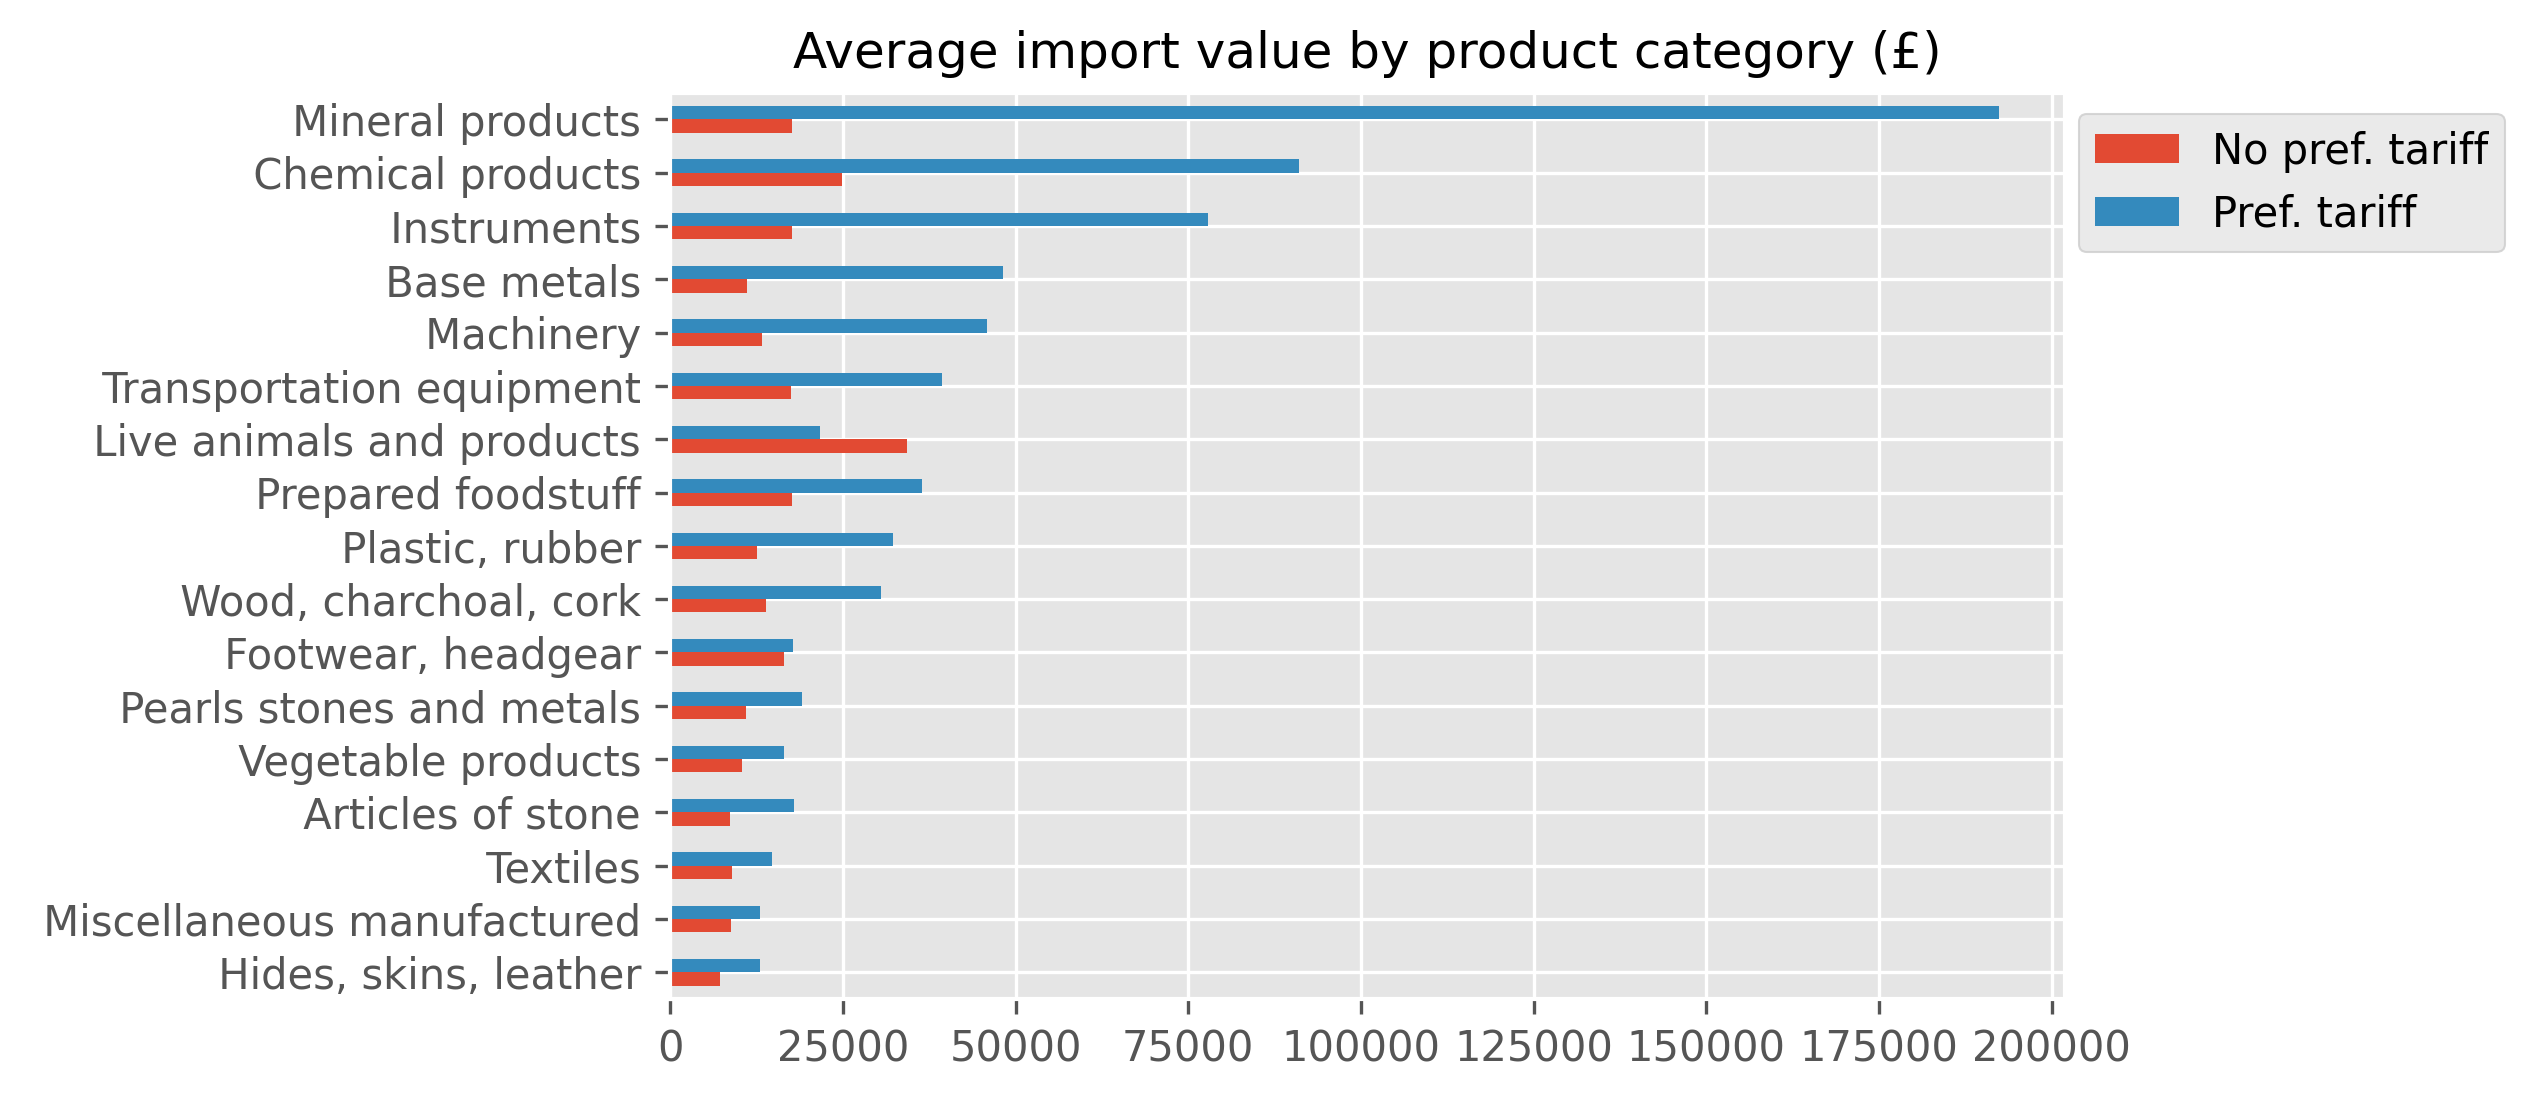
Once again, there is a consistent pattern across most product groups (Live animals being the only exception) of average import values being significantly higher where preference tariffs are used. Of in the case Mineral products and Chemical products the difference is particularly stark where the average import value is up to five times higher. When interpreting this, it is important to remember where the bulk of transactions and duty savings are being made (see Figure 5) – transportation equipment, textiles and vegetable products, which have relatively smaller transaction values on average, but we see the same patterns.
Figure 15: Time series of import transaction value, by tariff type (£)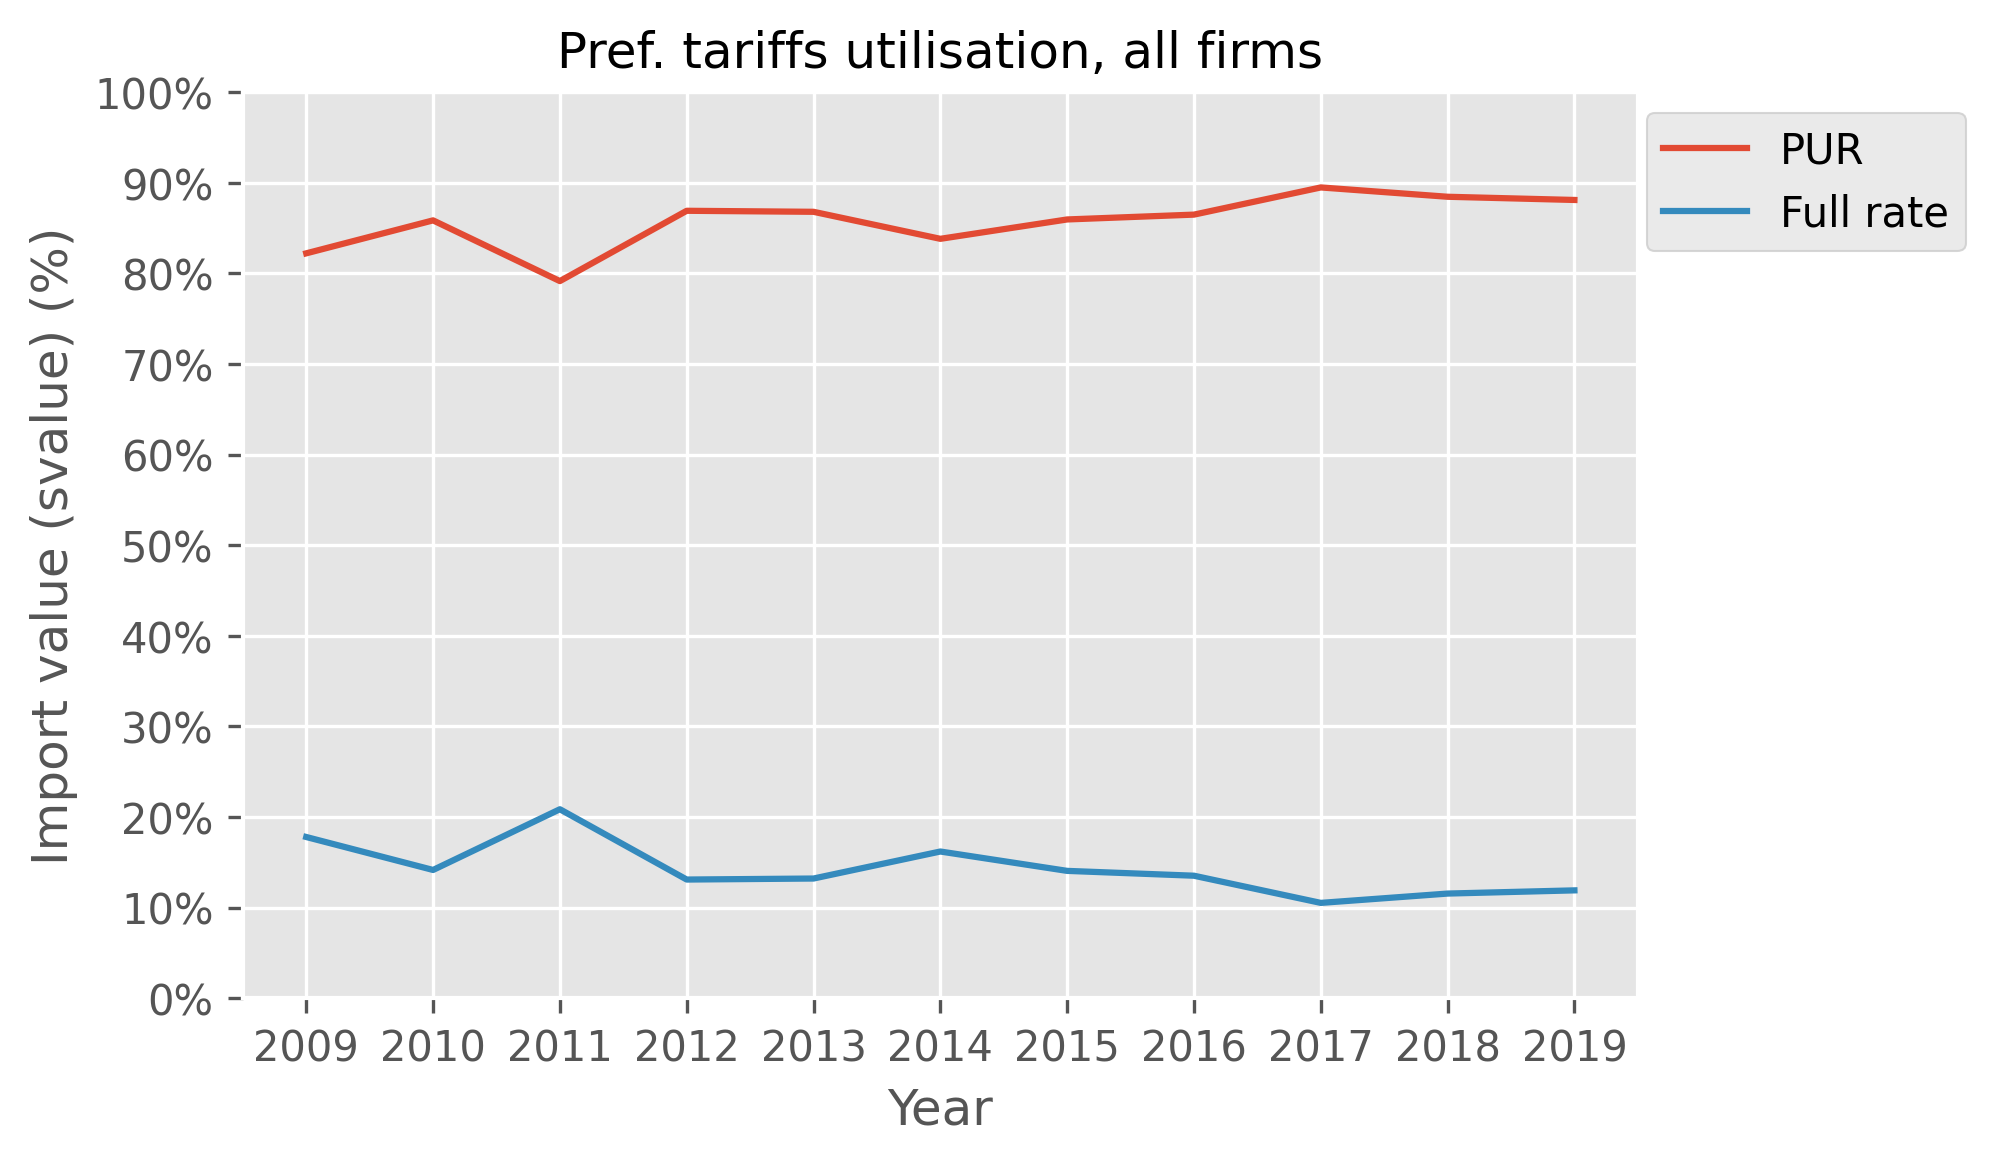
In Figure 15, we investigate how the value of transactions utilising preferential tariffs varies over time. We observe that, overall, the proportion of the value of transactions which utilise preferential tariffs remains at a high level, with an average of 86% over the years. In 2011 we observe a historical low, where the proportion drops below 80%.
Furthermore, we explore how the value of transactions which utilise preferential tariffs varies across company sizes. We observe that the timeline of small firms follows closely the behaviour of all businesses, shown in Figure 17. Moreover, the timeline of medium firms shows a sudden drop in 2011, although it recovers in 2012 and continues to ascend, reaching proportions above 94% as shown in Figure 18. The timeline of large firms, on the other hand, exhibits a drop, which starts mildly in 2012 and steepens in 2013 (Figure 19). However, this behaviour does not significantly impact the aggregate curve for all businesses, because large firms are significantly underrepresented in terms of number of transactions compared to the other firm size categories. Finally, the timeline of micro firms exhibits a downward trend from 2015 to 2019 (Figure 16).
Figure 16: Time series of import transaction value, by tariff type (£). Micro firms.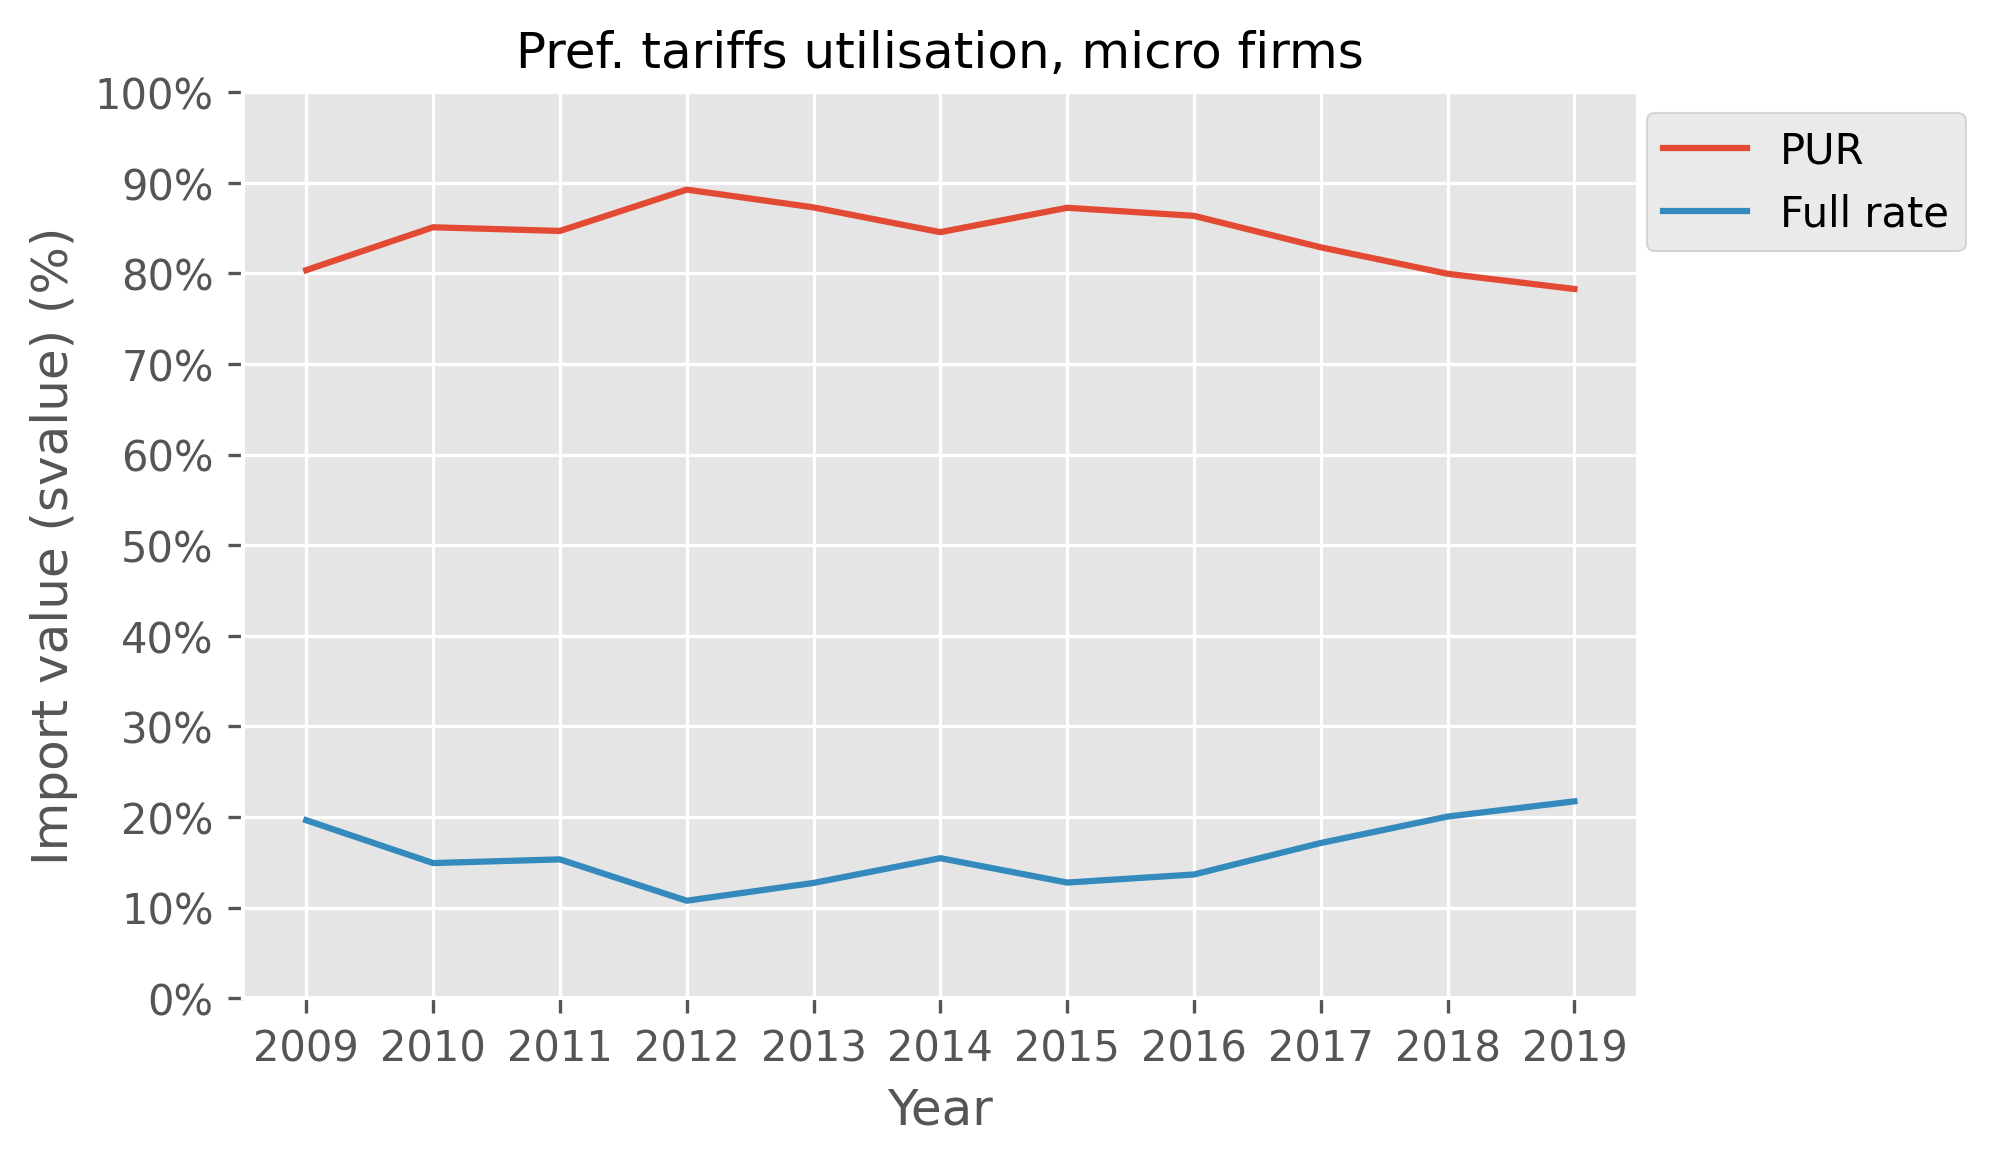
Figure 17: Time series of import transaction value, by tariff type (£). Small firms.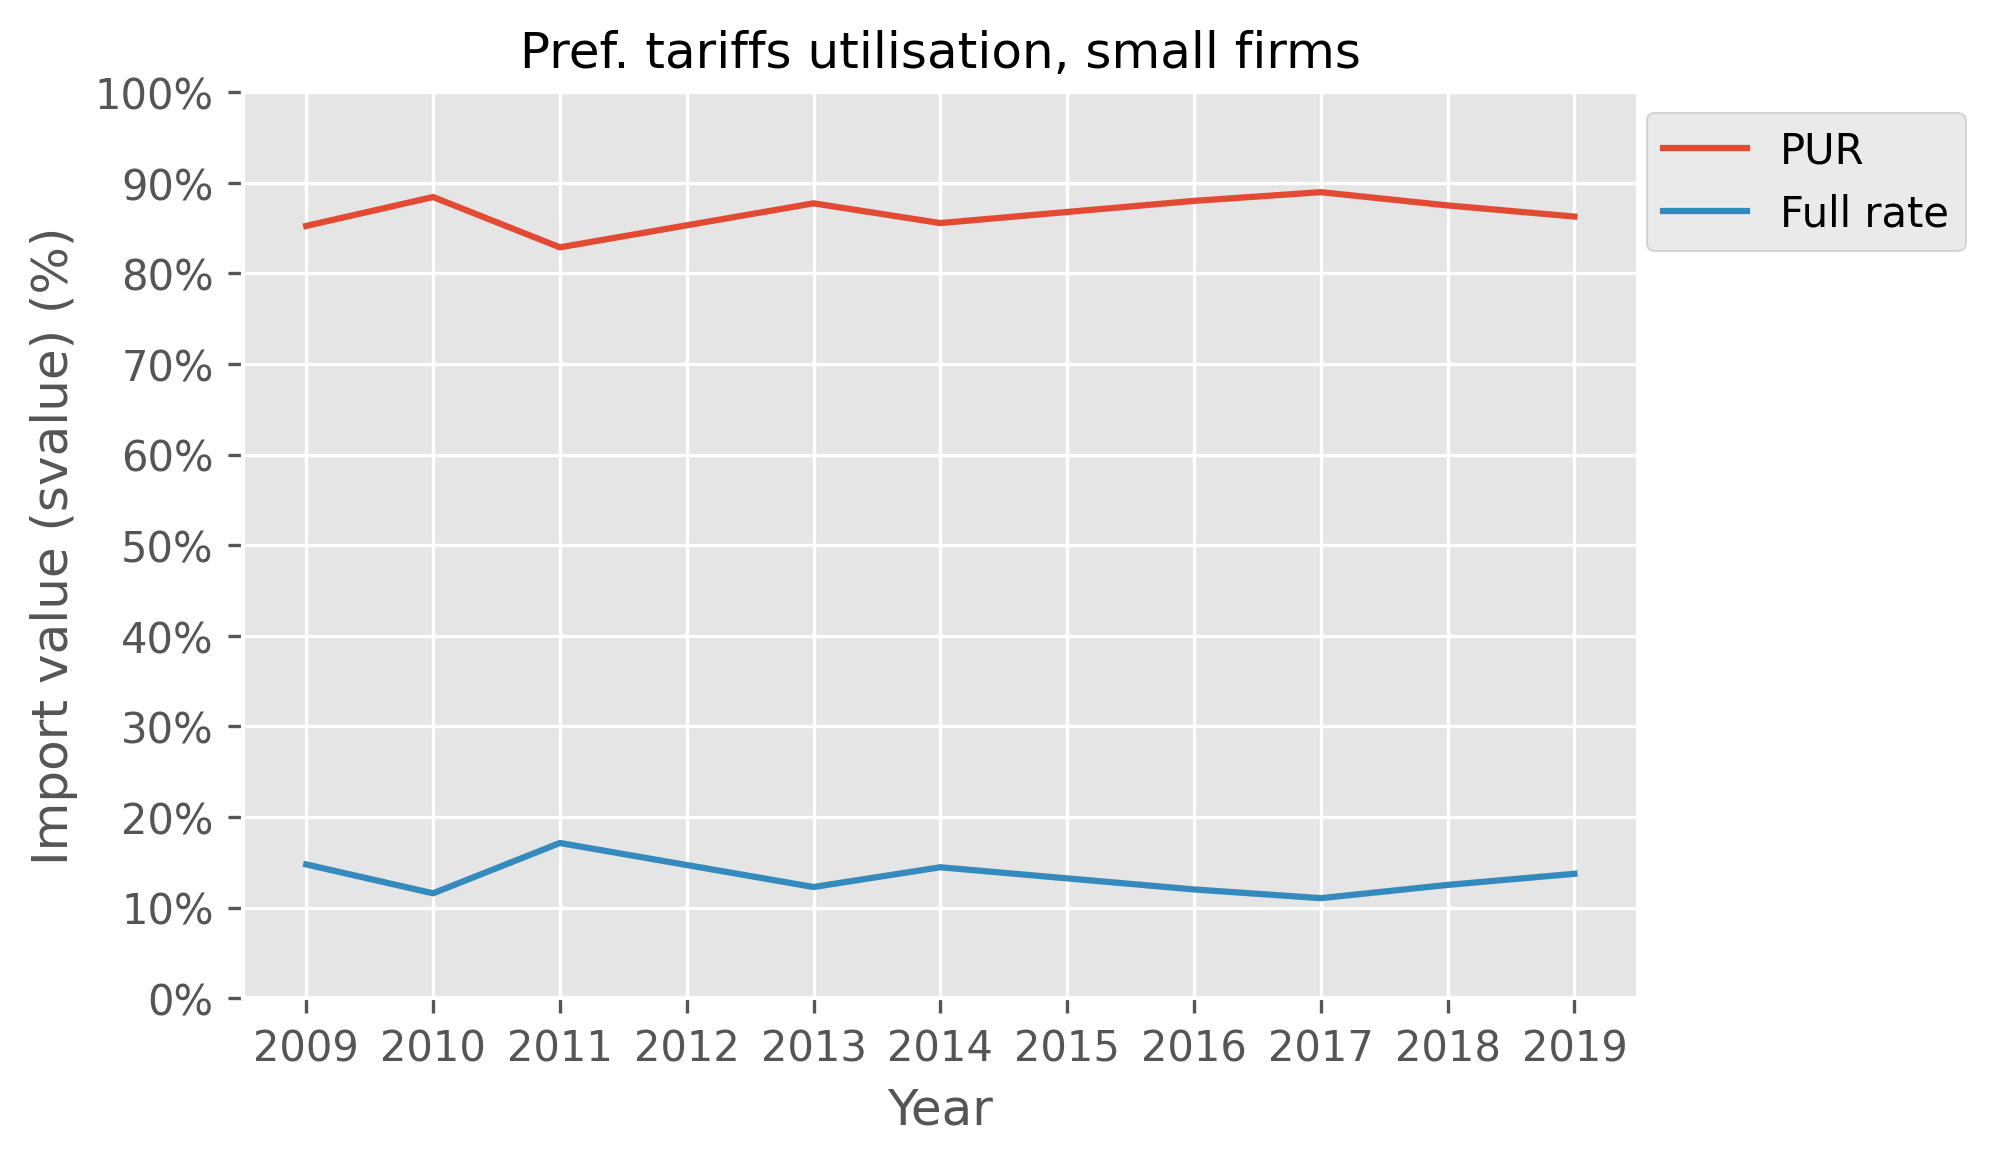
Figure 18: Time series of import transaction value, by tariff type (£). Medium firms.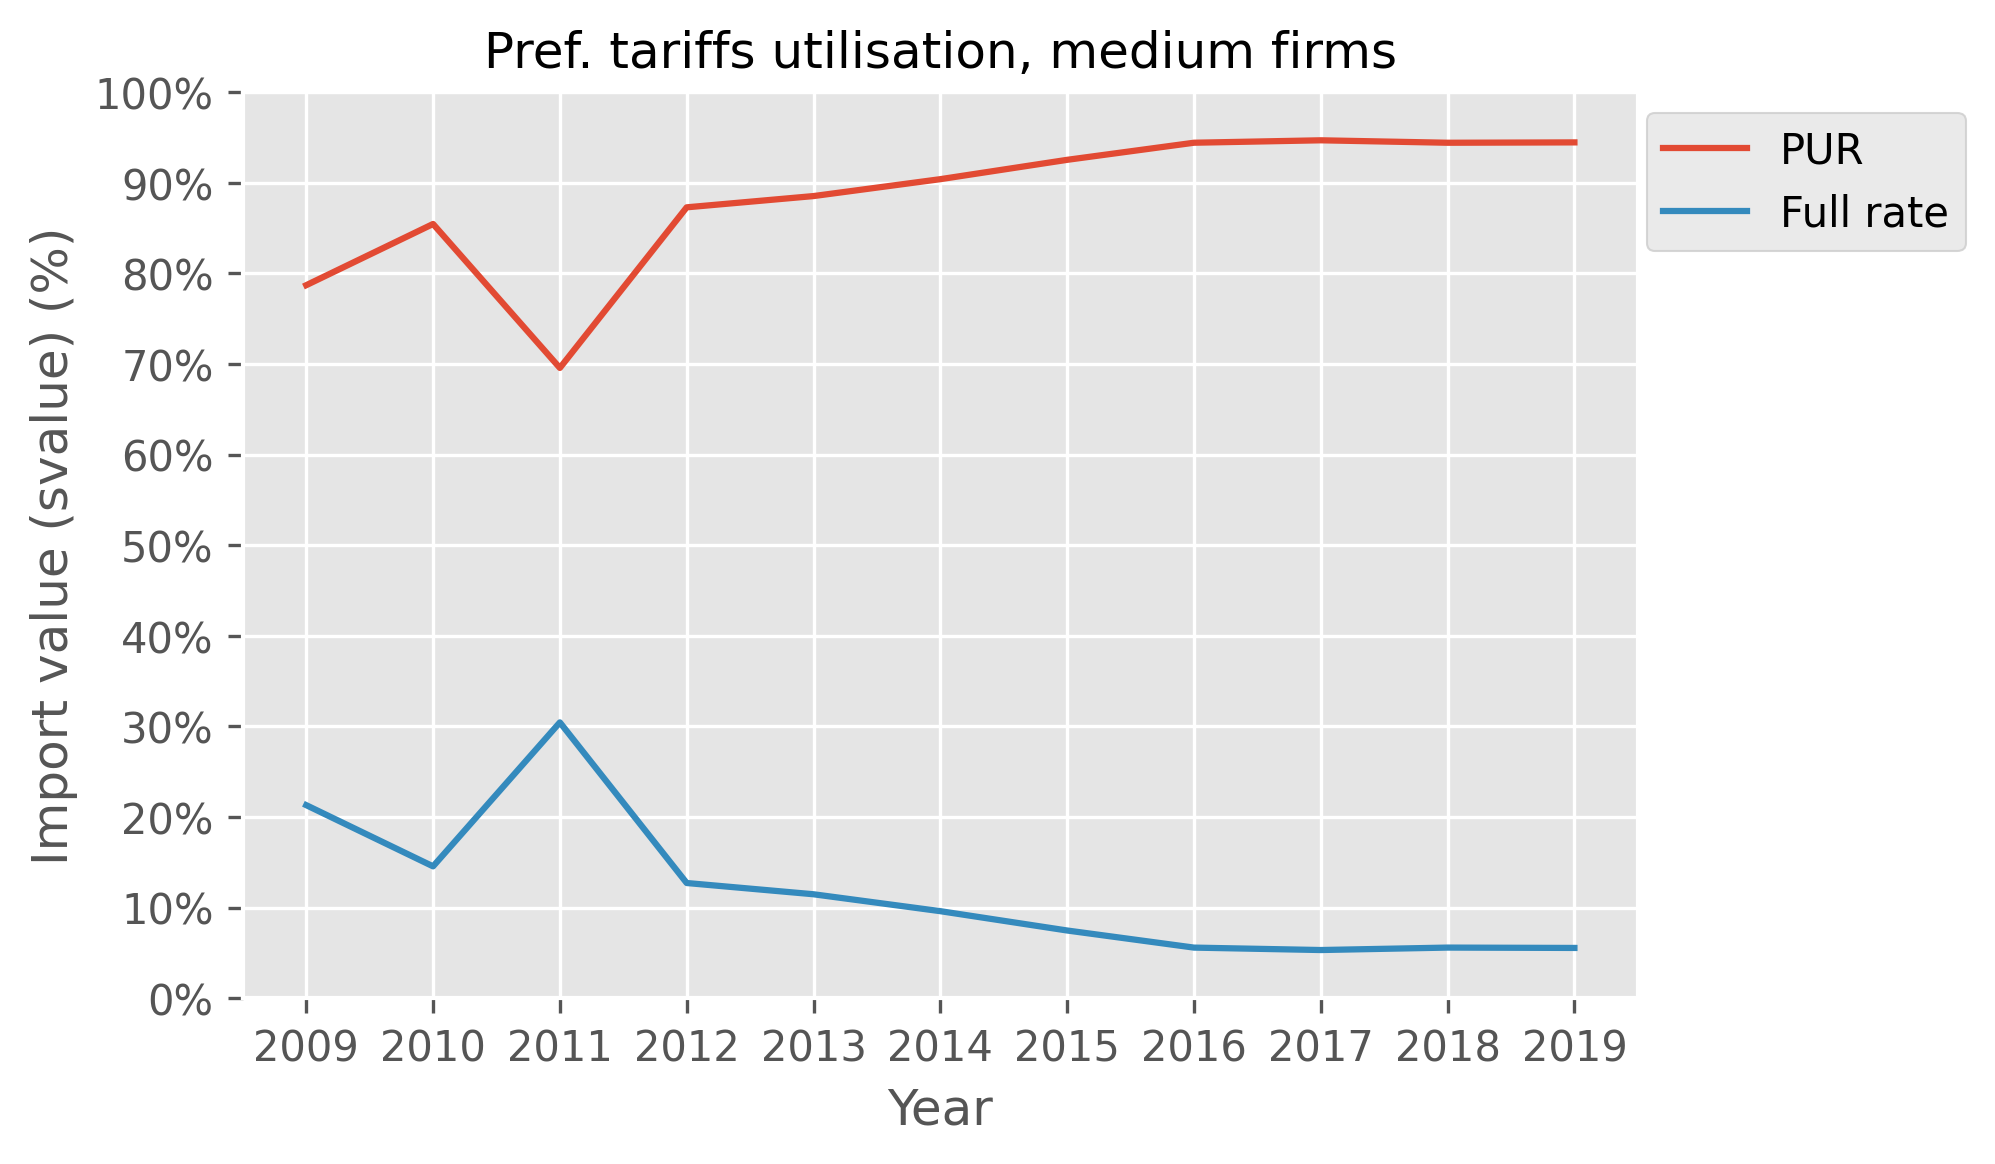
Figure 19: Time series of import transaction value, by tariff type (£). Large firms.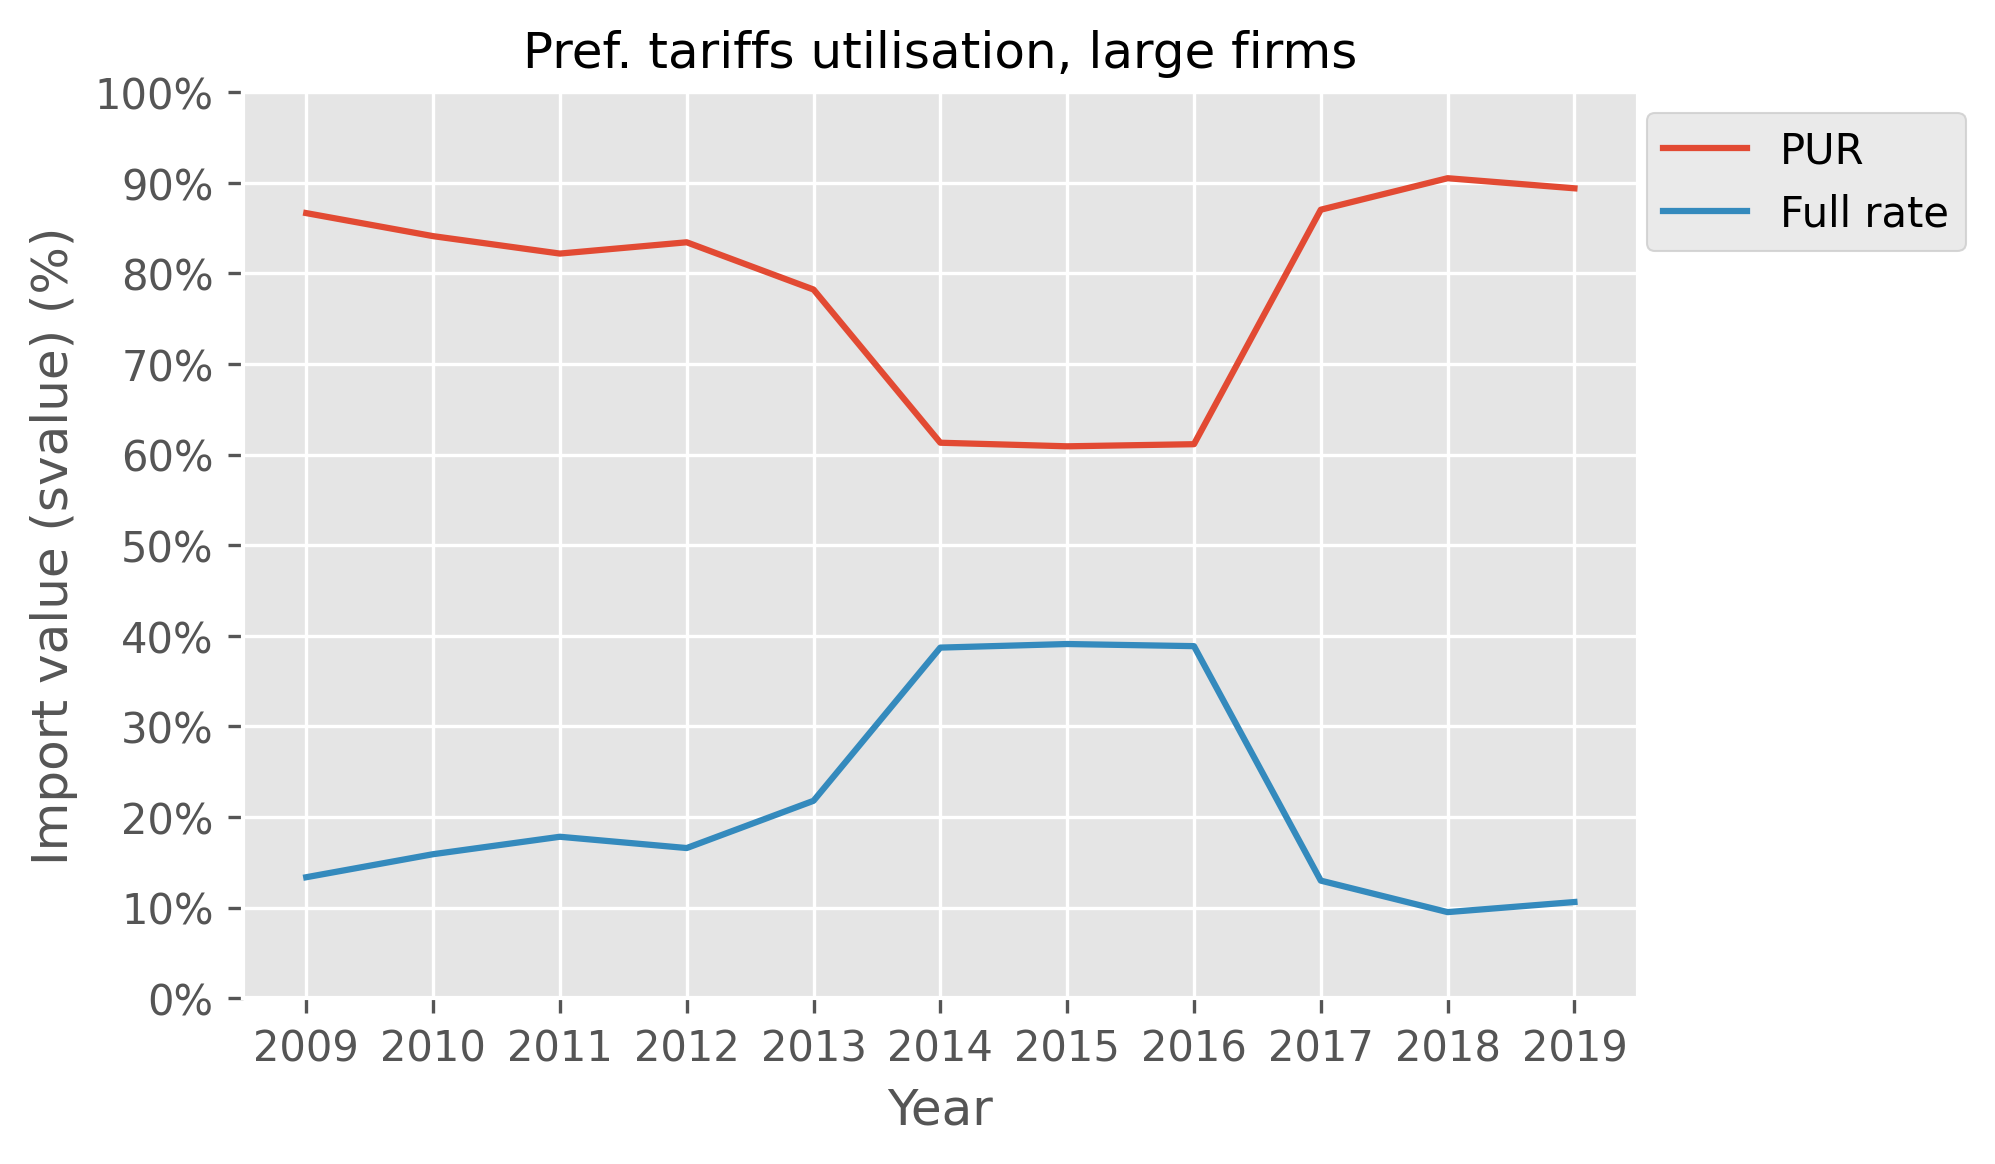 The data explored and visualised in this section show that transactional values of imports are perhaps the most significant driver of the decision to use a preferential tariff for businesses, and we can further explore this as a feature in our modelling. This is consistent with other findings in literature, and the rationale behind businesses justifying the admin burdens of preferential tariffs (and subsequent savings) for larger transactions is sound. This pattern is seen across all business sizes and all but one product category.
Tariff utilisation across import modes
We conclude this chapter with a brief look at how the PUR and duty savings vary because of import modes, a topic of interest in the Sweden Board of Trade papers. From the micro-data, we can derive the most common import modes, which are direct imports to the business and imports via customs warehousing. With customs warehousing, imports are sent to customs warehouses from which businesses retrieve goods, usually in smaller batches. Until products leave the warehouse, they are not registered as imports. The use of different import modes may influence the utilisation rate and we graph these in Figure 20 and Figure 21 below.
Figure 20: Preference utilisation rate by business size and import mode (%)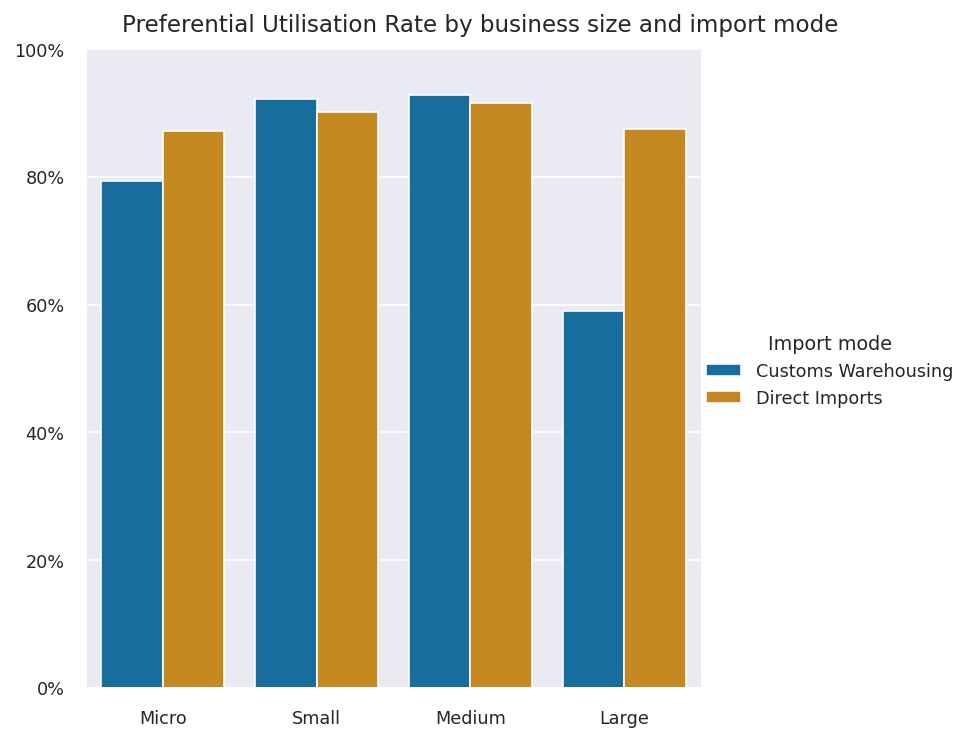 The breakdown of PUR by business size and import mode shows that difference in utilisation across the two modes is negligible except for large businesses. These businesses have a PUR of 88% for direct imports, which is in-line with other business sizes, compared with 58% for customs warehousing. Figure 22 shows the contribution of duty savings by the same breakdowns and we see that medium-sized businesses enjoy almost all of the total duty savings (and thus carry out the largest imports) for goods sent to customs warehouses.
Figure 21: Estimated duty savings by business size and import mode (£)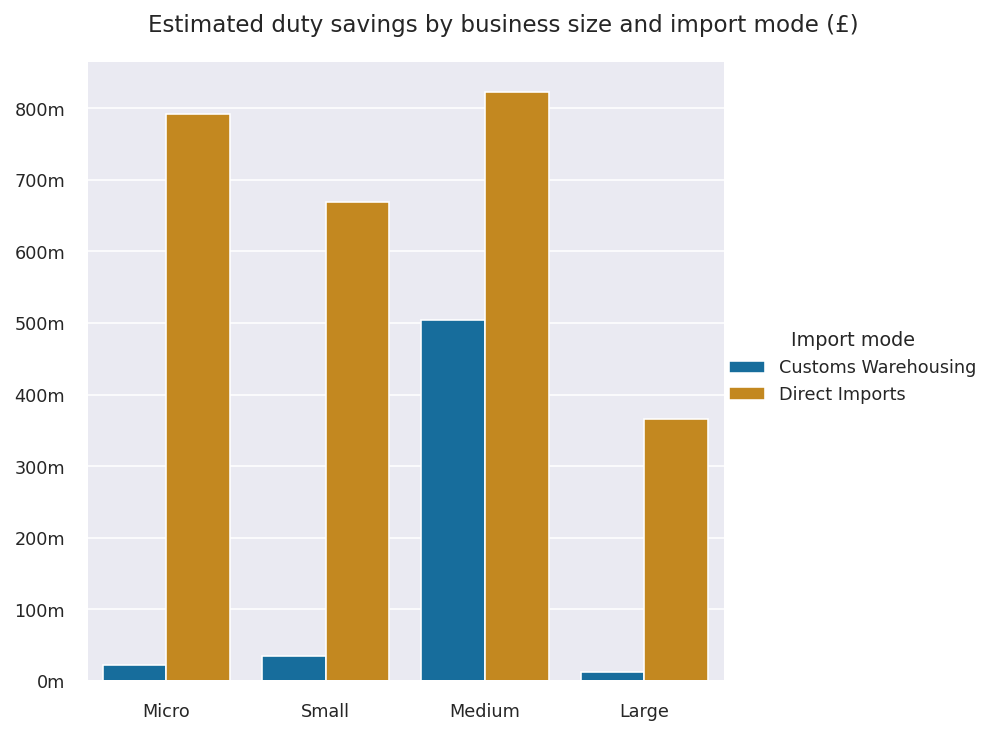 When breaking down the estimated duty savings further by goods category, we see that almost the entirety of duty savings (and therefore transactions) of imports sent to customs warehouses is for transportation equipment. It would be reasonable to conclude that the size of transportation goods and machinery to a lesser degree is the primary reason for businesses to utilise this import mode due to their own storage capacity limits.
Figure 22: Estimated duty savings by goods category and import mode (£)
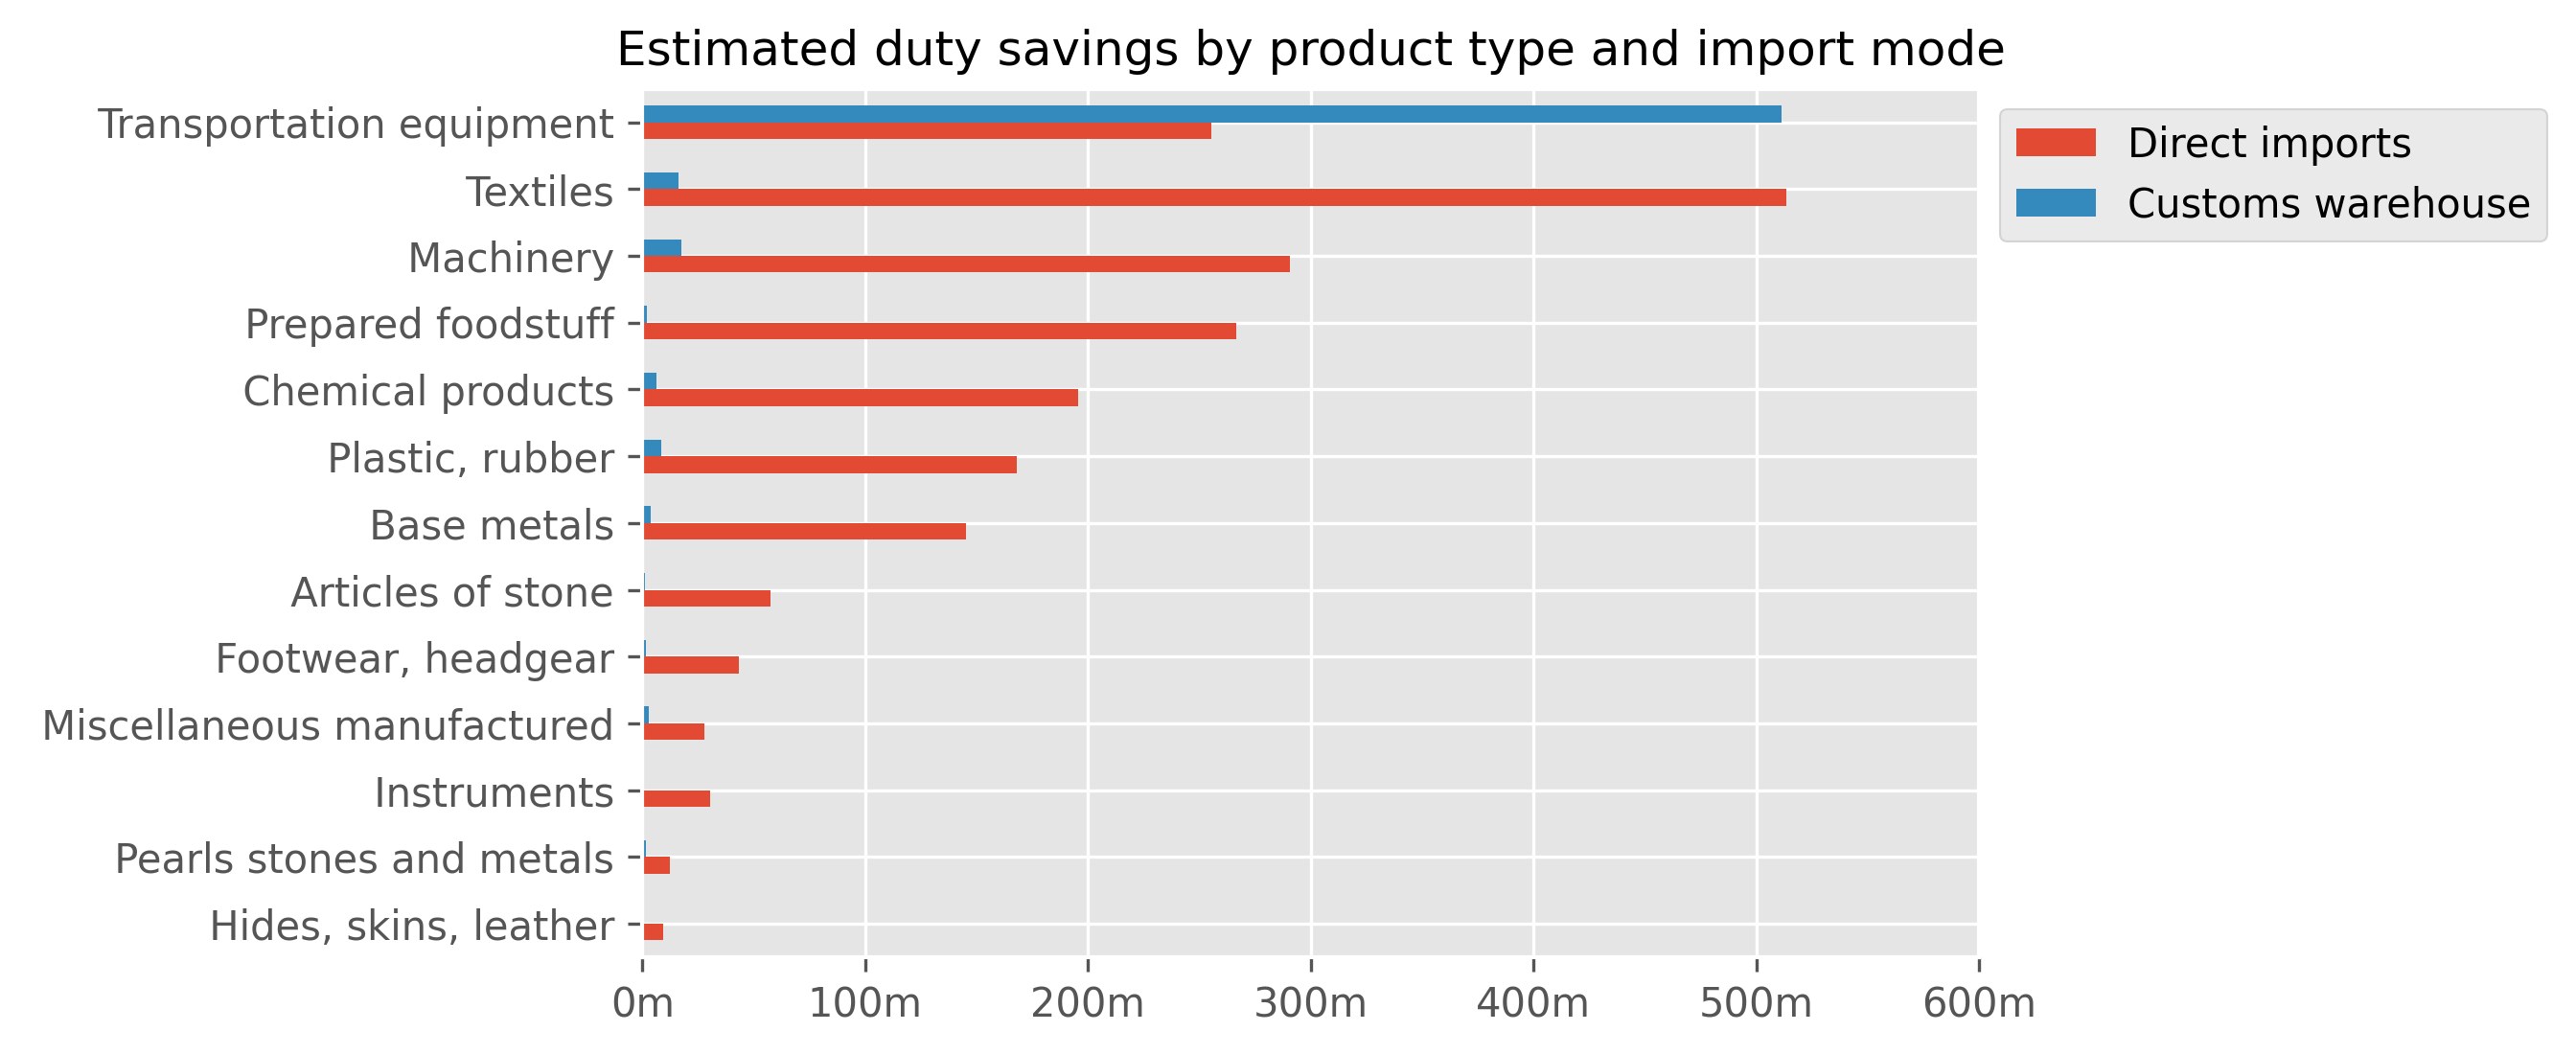
Direct imports appear to be the most dominant method of importing and make up most of the total duty savings (around 82%). The PUR does not vary significantly between the two import modes across most business sizes and transactions, however, what is most interesting is that customs warehouse usage is primarily for transportation equipment. In light of this, further analysis of import modes should keep the dominance of this product category in mind.
5. Modelling results
Here we present the results from modelling the utilisation of preferential tariffs by the UK importers. This includes a detailed investigation of the relationship between several quantities, such as potential duty savings, import transaction values and preference margins and the uptake of preferential tariffs.
Our analysis is based on estimating the probability that a transaction would utilise preferential tariffs. This is achieved by training machine learning models on a subset of the Trade in Goods + Inter-departmental business register (TiG+IDBR) database and using these models to predict the probability of preferential tariffs utilisation for the remaining subset of the database, which is unseen by our models. In essence, our model is a two-class classifier which predicts, for each transaction, whether it would use preference tariffs or most favoured nation (MFN) tariffs and the prediction’s probability score. Transactions that utilised MFN tariffs are our minority class, because they have low proportion in our database as compared with the transactions which utilised preference tariffs and constitute our majority class. We use the Synthetic Minority Oversampling Technique (SMOTE) to generate additional data for the minority class to alleviate classification bias caused by class imbalance. We use the following database variables to build our models:
- transaction value
- potential duty savings
- preference margin
- firm size (based on number of employees)
- enterprise turnover
- enterprise experience (based on number of annual transactions)
- transaction year
- CPC type and product type (based on the harmonised system code)
General results
We selected the gradient boosted trees (GBT) model to pursue further model tuning given its stronger predictive capabilities compared with random forests and logistic regression that we also tested. We opted for a GBT with an increased tree depth. This model increased accuracy metrics, with total accuracy of 86.2%, and accuracy measured with the area under ROC curve of 93.7%. Cross-validation of the tuned model also produced consistent results. Our model, additionally, gives balanced accuracy across the different classes, as it is shown in Table 2.
Table 2: Confusion matrix of model accuracy results. We have two classes, one that represents transactions that used a preferential tariff (the majority class), and one that represents transactions that used the MFN rate (the minority class).
| GBT | Prediction: MFN Tariff used | Prediction: Preference Tariff used |
| Actual: MFN Tariff used | 0.861 | 0.139 |
| Actual: Preference Tariff used | 0.137 | 0.863 |
To assess feature importance of the machine learning models, we followed a process similar to the brute-force feature selection algorithm from, where the impact of each feature is measured by how it affects the classification process. In our study, we removed one feature at a time and assessed how this action affected the classification accuracy.
The feature importance analysis indicated that there were no variables that significantly detracted or overwhelmingly contributed to the model’s predictive ability. That said, the business region and HS Section variables appeared to be slightly more important for the model’s accuracy. Notably, HS Section had a much stronger impact on the accuracy of the class representing utilisation of MFNs, but decreased accuracy for the class representing utilisation of preference tariffs to a lesser extent. Annual transactions per business were also a relatively important feature. Year and business size were low-scoring variables in both models.
To test whether non-significant variables that were not a hindrance to the model were contributing unnecessary noise, a GBT model without the year or business size variables was tested. The results indicated that removing these variables only slightly reduced model accuracy metrics, indicating they were less important for predictions. However, given that their removal did not improve the model, we chose to retain the variables in analysis.
Probability plots – potential duty savings
The role of potential duty savings in the utilisation of preferential tariffs has been investigated by several studies in the past, for instance. Following the methodology of, when studying the effect of potential duty savings, we separate transactions by import mode and consider direct imports and customs warehousing independently.
The results of this analysis are visualised in Figure 23 and Figure 24, which show the relationship between the probability of preference utilisation and the potential duty savings for each import mode. Following, we use the logarithmic scale in order to display data over a wide range of values in a compact way. The shaded area represents the 95% confidence intervals (95% CIs). For direct imports, we observe that the probability of utilisation of preferential tariffs increases with the increase of potential duty savings. This becomes particularly evident for savings greater than £20, which corresponds to the value ln (potential duty savings) = 3 on the x-axis. For customs warehousing, we can also see that, in general, the probability of utilisation of preferential tariffs increases with the increase of potential duty savings. It is noteworthy that this curve exhibits a mild decrease between the values of ln (potential duty savings) 7 and 8, which correspond to £1096 and £2980, respectively. Of course, the average probability of utilisation for this segment is high, approximately 80%. The curve clearly ascends after ln (potential duty savings) = 8.
Figure 23: Prediction of ln(potential duty savings). Direct imports. The shaded area represents the 95% confidence intervals (95% CIs).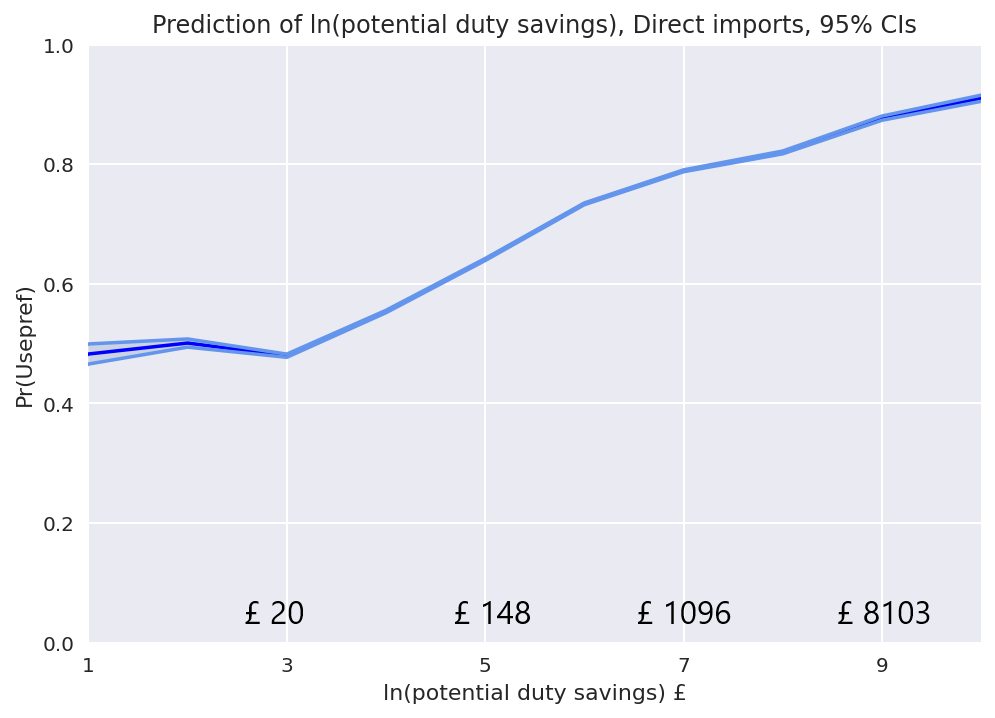
Figure 24: Prediction of ln(potential duty savings). Customs warehousing.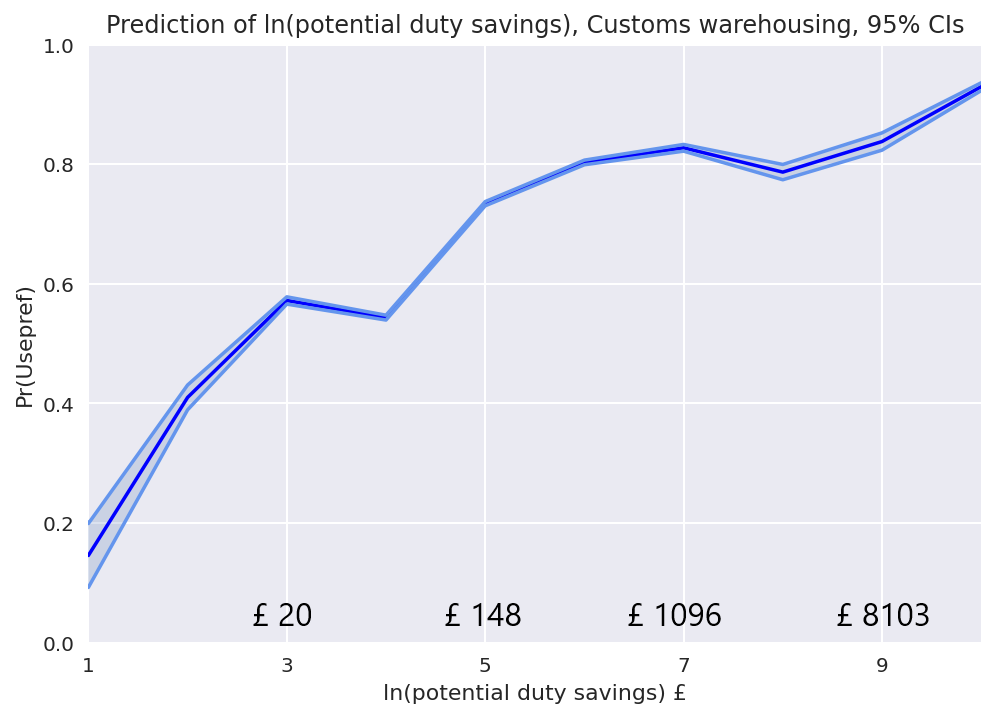
Probability plots – transaction value
We studied the relationship between the transaction value and the probability of utilisation of preferential tariffs. Again, we distinguished between import modes and plot direct imports and customs warehousing separately. Note that we exclude transactions under £135 from our estimations because direct imports below this value are exempt from tariffs.
Figure 25: Prediction of ln(transaction value). Direct imports.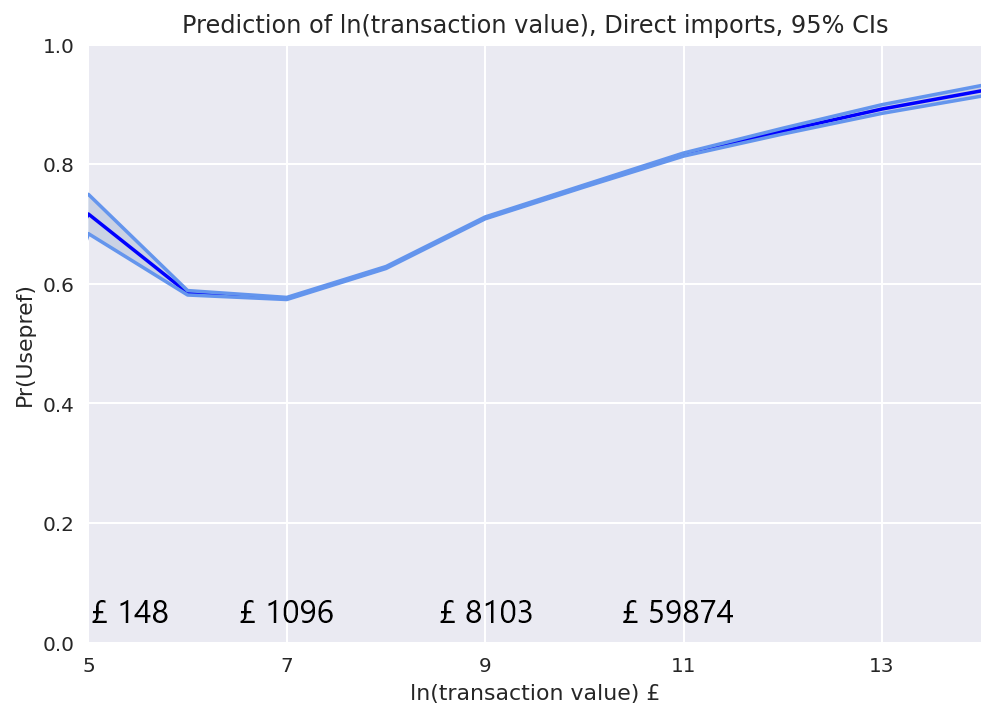 For direct imports (Figure 25), we observe that, overall, the probability of utilisation of preferential tariffs increases with the increase of transaction value. This becomes clearer for the section of the curve which starts at the ln (transaction value) = 7 value on the x-axis, which corresponds to £1,096. Furthermore, we would also like to investigate how the company size affects the utilisation of preferential tariffs in this case and, therefore, we break down our results by firm size. We can see that the curves corresponding to micro, small and medium firms (Figure 26, Figure 27 and Figure 28) exhibit similar behaviour to the aggregate curve. For large firms (Figure 29), we also observe that the probability of utilisation of preferential tariffs increases with the increase of transaction value. However, their curve exhibits a marginal decrease in the section between the values of ln (transaction value) 11 and 12, which correspond to £59,874 and £162,755, respectively. The probability of preferential tariff utilisation in this section is also high, over 80%.
Figure 26: Prediction of ln(transaction value). Direct imports, micro firms.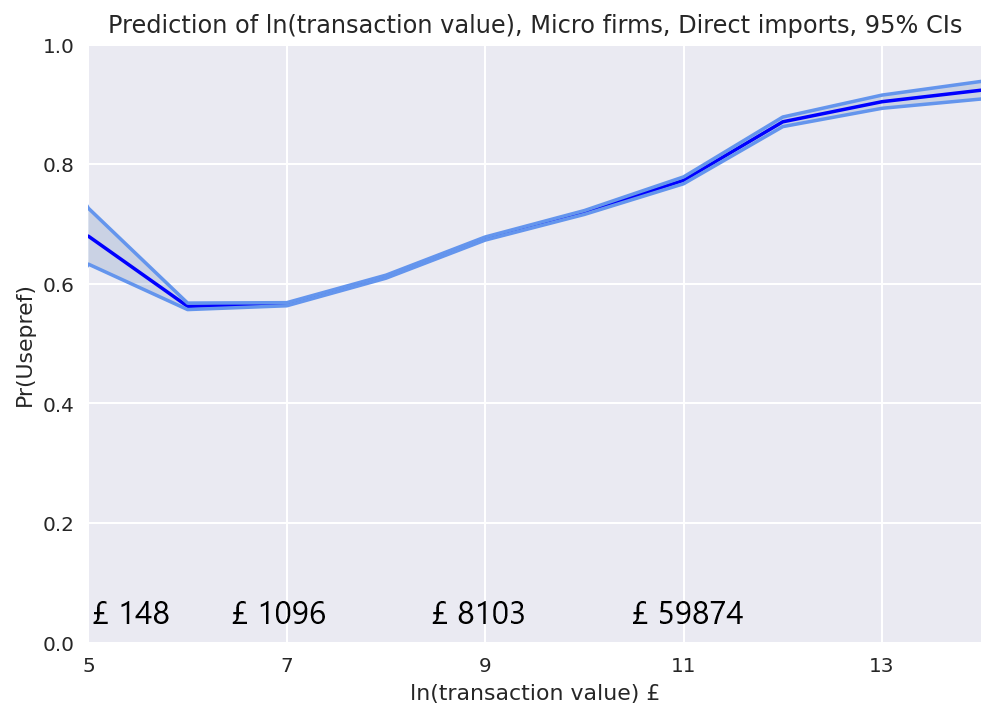
Figure 27: Prediction of ln(transaction value). Direct imports, small firms.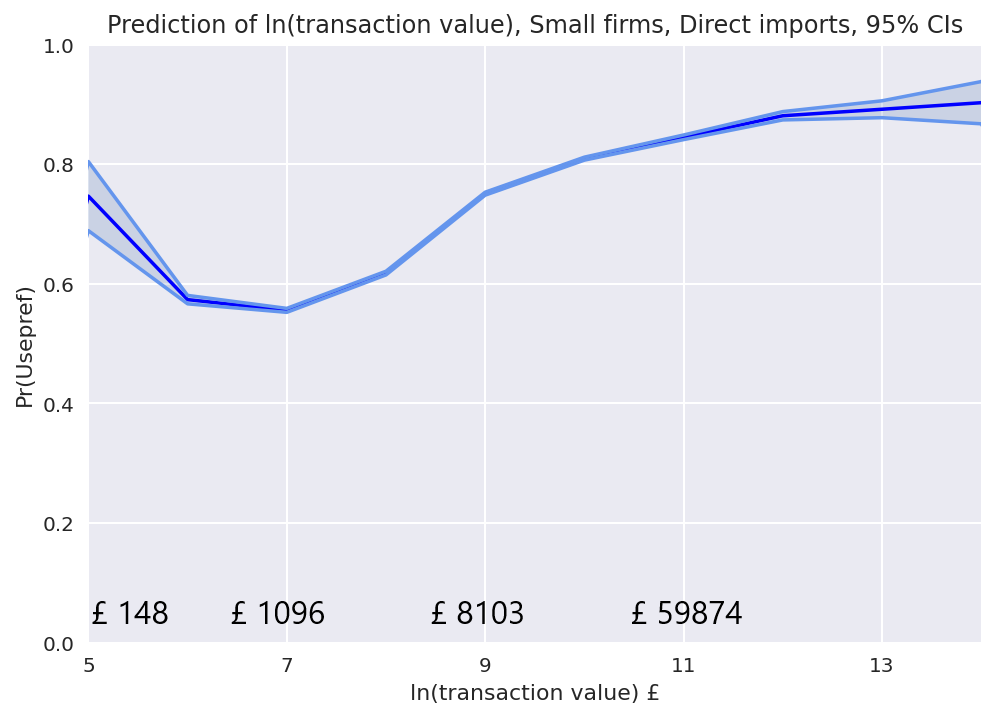
Figure 28: Prediction of ln(transaction value). Direct imports, medium firms. 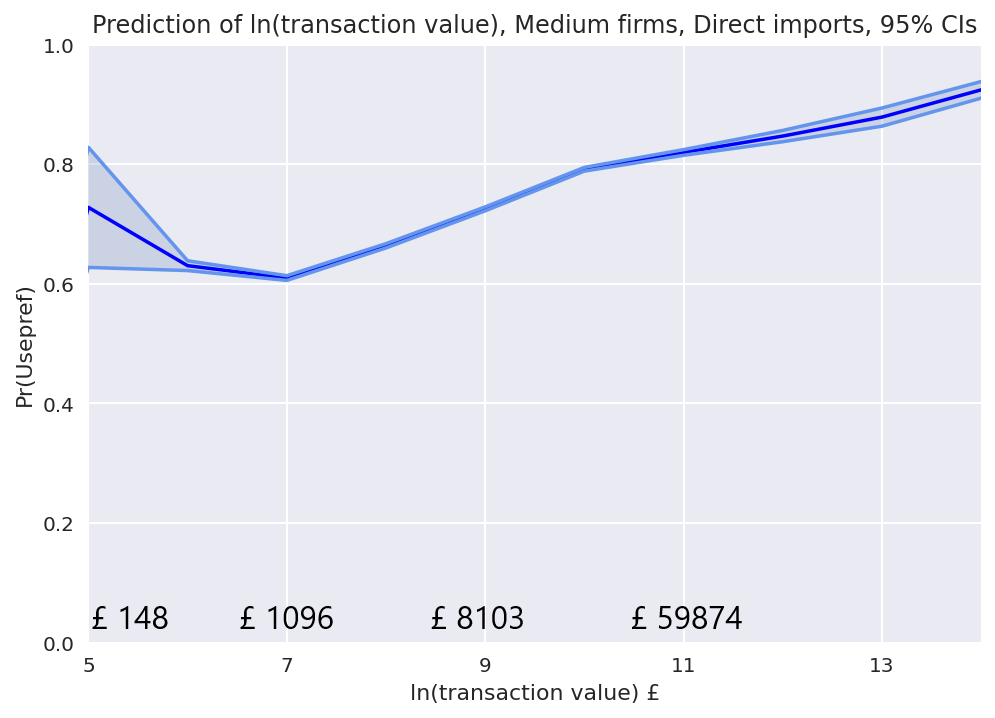
Figure 29: Prediction of ln(transaction value). Direct imports, large firms. 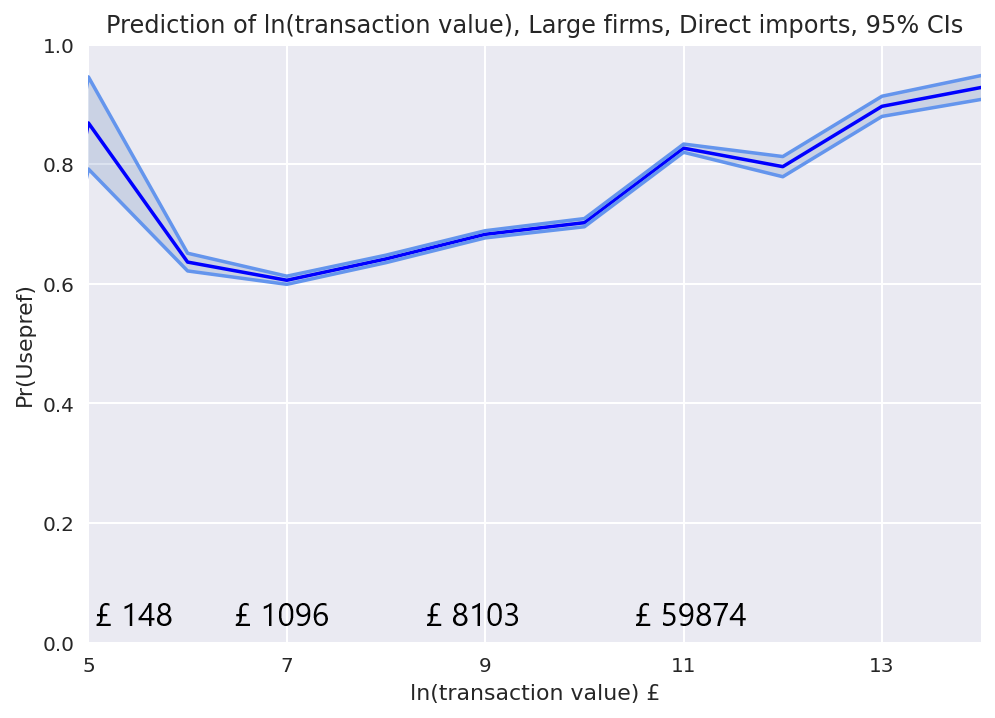 Furthermore, we study the relationship between the transaction value and the probability of utilisation of preferential tariffs for customs warehousing (Figure 30). The trend in this case is also that the probability of utilisation of preferential tariffs increases with the increase of the transaction value. Compared with the direct import’s curves, customs warehousing exhibits a more volatile behaviour. Specifically, there is a mild drop in the sections between the values of ln(transaction value) 9 and 11, which correspond to £8,103 and £59,874, respectively. The curve clearly ascends after ln(transaction value) = 11.
Figure 30: Prediction of ln(transaction value). Customs warehousing.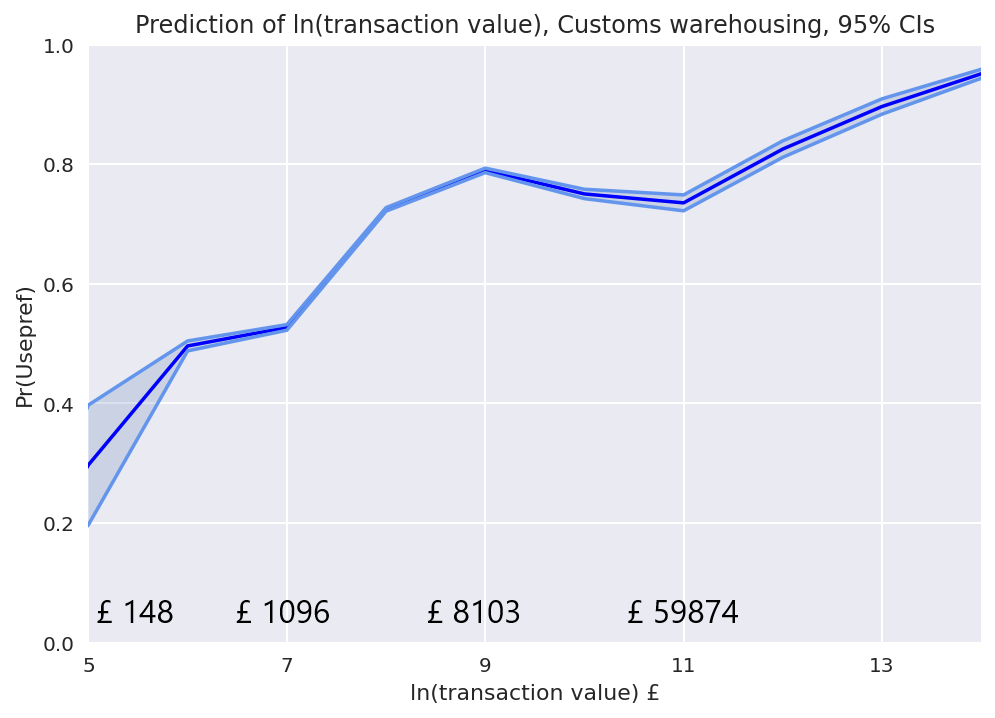 Probability plots – preference margins
The preference margin is defined as the absolute difference between the MFN tariff and the preferential rate of duty for a product. Preference margins offer incentives for enterprises to utilise preferential tariffs. They are very important for the analysis of preferential tariffs because they are regarded as a measure of the strength of a trade agreement, that is, how much benefit the FTA’s tariff liberalisation brings compared to MFN. Therefore, it does not come as a surprise that previous studies have investigated their relationship to the probability of the utilisation of preferential tariffs. Indeed, a positive relationship between the take-up of preferential tariffs and preference margins was found in. On the other hand, in it was reported that it was not possible to identify a robust relationship between the preference margin and the utilisation of preferential tariffs.
In our study, we investigate the relationship between preference margins and the probability of utilisation of preferential tariffs. Once more, we distinguish between different import modes and plot direct imports and customs warehousing in different charts.
Figure 31: Prediction of preference margin. Direct Imports.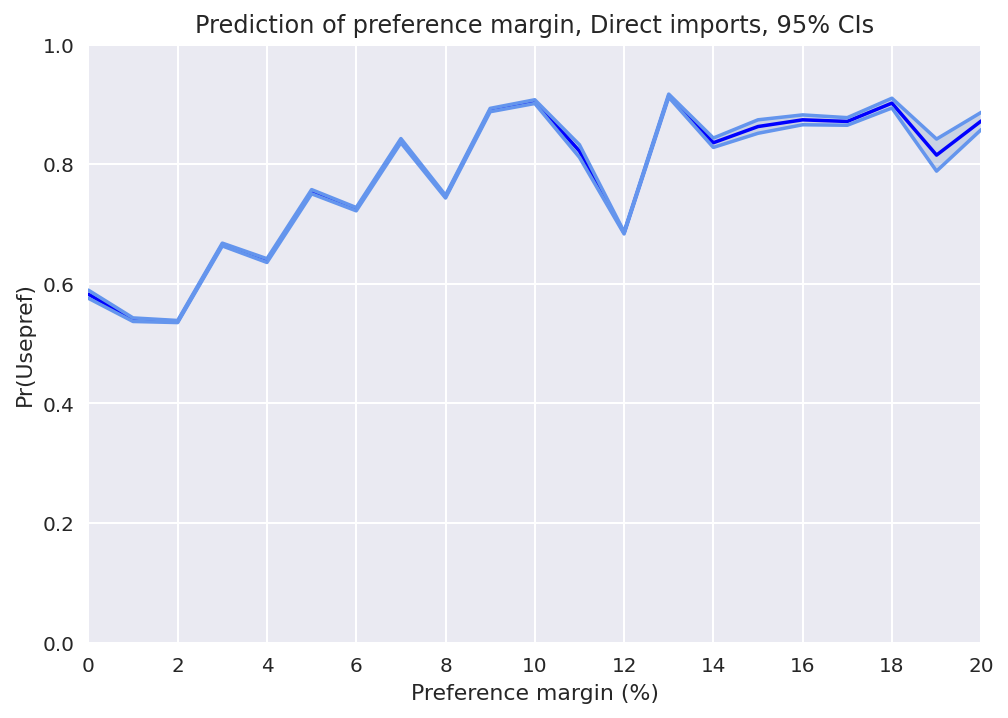 Our results for direct imports are shown in Figure 31. The trend is that the probability of utilisation of preferential tariffs increases with the increase of preference margin until the preference margin becomes equal to 10%. At this point, the probability of utilisation is very high, approximately 90%. Afterwards, the curve exhibits a steep decent until preference margin = 12%, where the probability of utilisation of preferential tariffs drops to 70% and then it ascends again. In the following sections, the curve fluctuates but the probability remains at high levels, always above 80%. We investigate our findings further by looking at how the company size affects the utilisation of preferential tariffs and we break down our results by firm size. We find that the trends of the curves of individual firm sizes generally follow the trend of the aggregate curve. That is, their trend is that the probability of preferential tariffs utilisation increases until preference margin = 10%. After this point, the curves start to fluctuate.
Large firms (Figure 35) exhibit the steepest descent and the probability drops below 60% for preference margin = 12% but, after this point, it rises and the probability stabilises at very high levels – above 90% – in the next sections. The curve of medium-size firms (Figure 34) is the one that exhibits the most unstable behaviour after preference margin = 10%.
Figure 32: Prediction of preference margin. Direct imports, micro firms.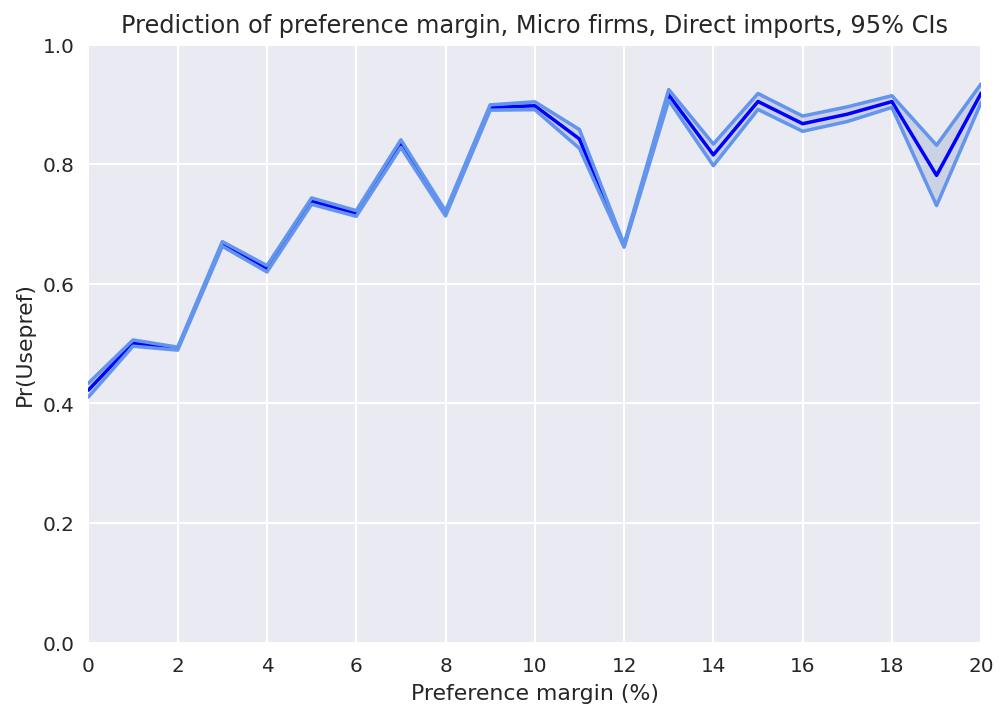
Figure 33: Prediction of preference margin. Direct imports, small firms. 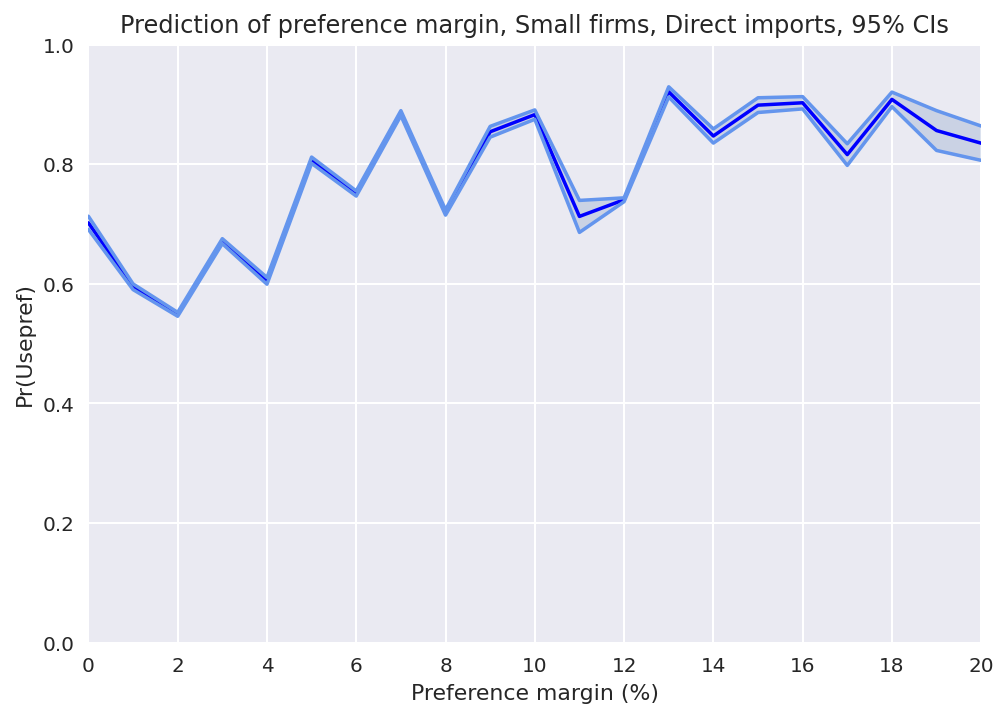
Figure 34: Prediction of preference margin. Direct imports, medium firms.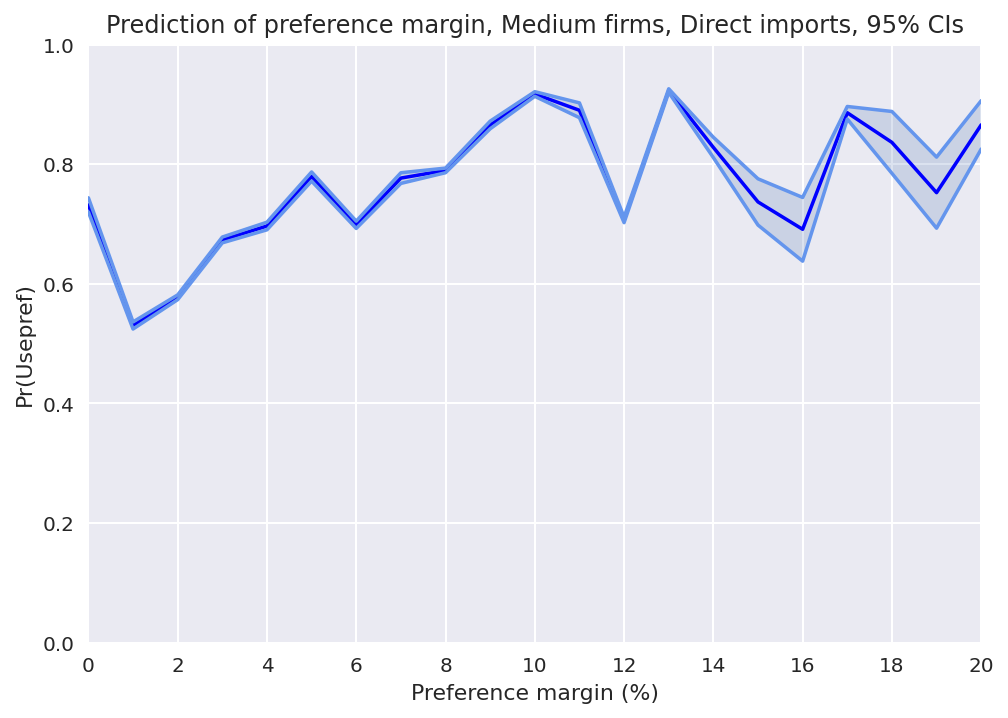
Figure 35: Prediction of preference margin. Direct imports, large firms.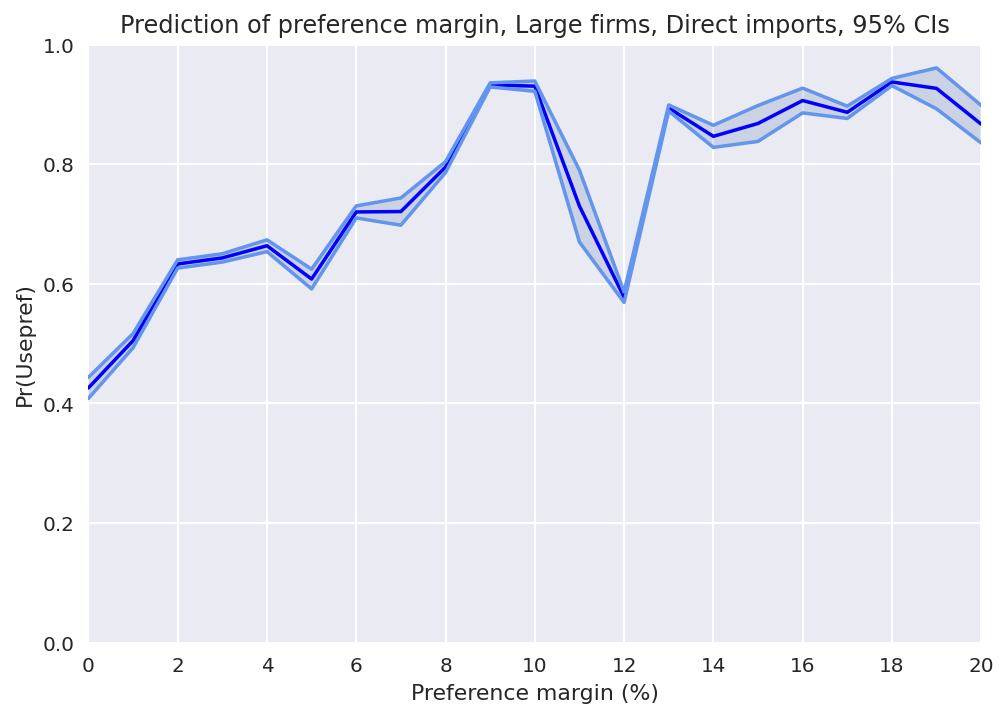
Figure 36: Prediction of preference margin. Customs Warehousing. 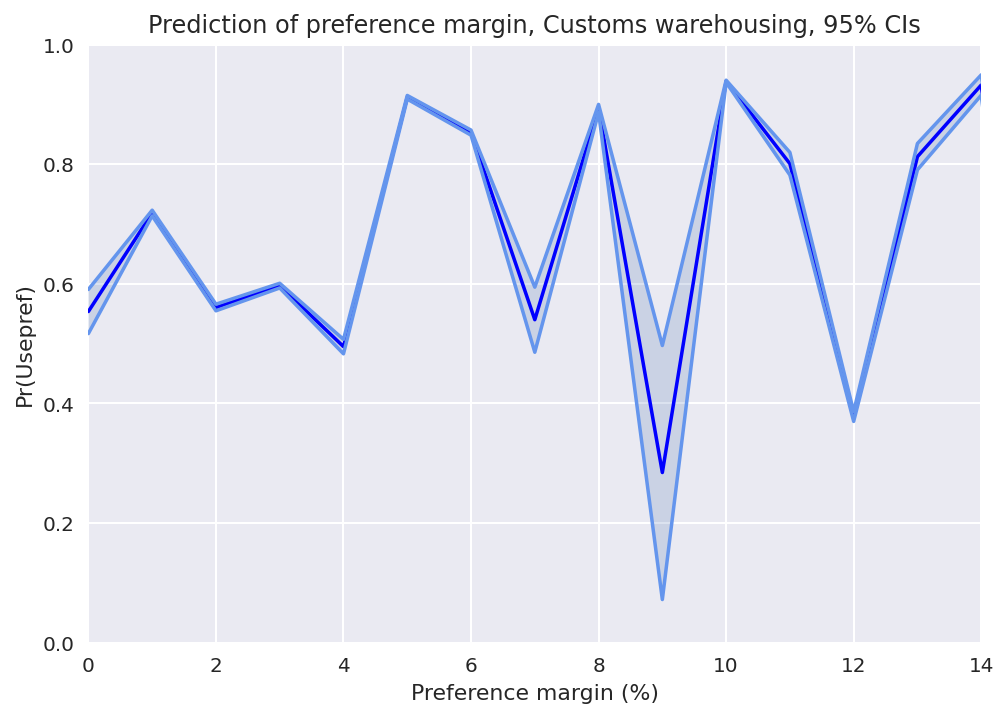
We also studied the relationship between the preferential margins and the probability of utilisation of preferential tariffs for customs warehousing. Our results are presented in Figure 36. The curve is very volatile and we are not able to identify a relationship between preferential margins and the probability of preferential tariffs utilisation.
Probability plots – product type
From our initial findings, we also graphed probability plots against each of the HS product categories against the potential duty savings. Here, we present the three most traded products in the dataset, that is, transportation equipment (Figure 37), textiles (Figure 38) and vegetable products (Figure 39). The remaining are given in the Appendix. The findings from our earlier data exploration are reinforced here with clear variation seen in the likelihood of businesses using preferential tariffs according to the product, with all generally following an upward trend as potential duty savings increase.
Figure 37: Prediction of ln(potential duty saving). Transportation Equipment.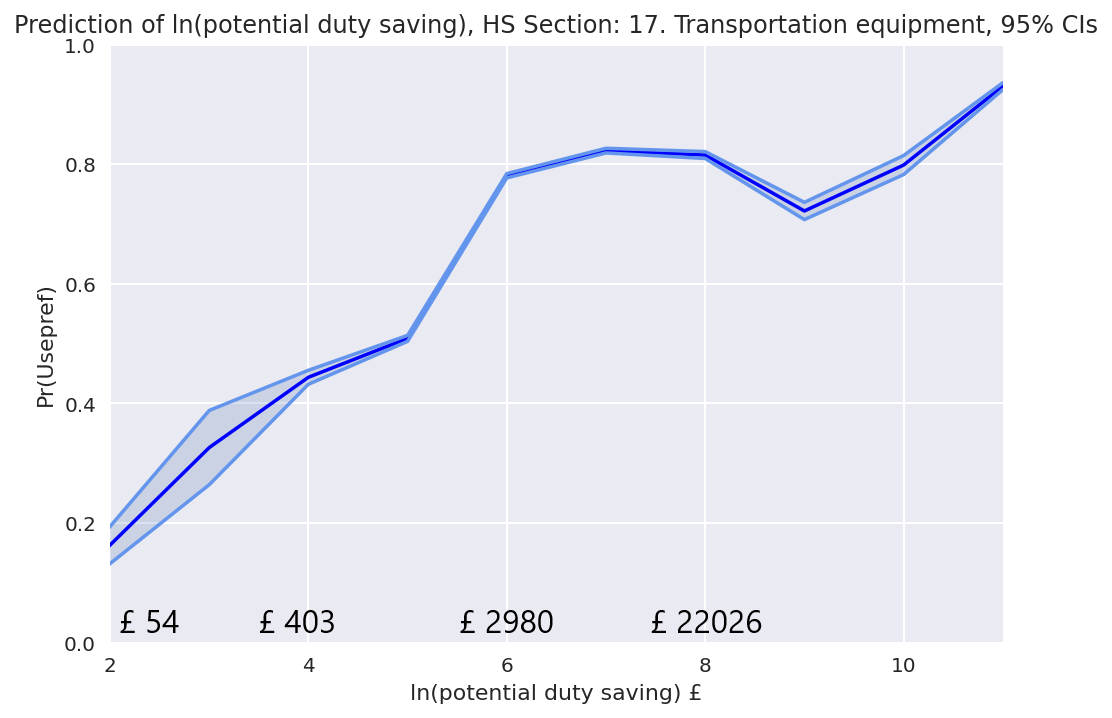
Figure 38: Prediction of ln(potential duty saving). Textiles.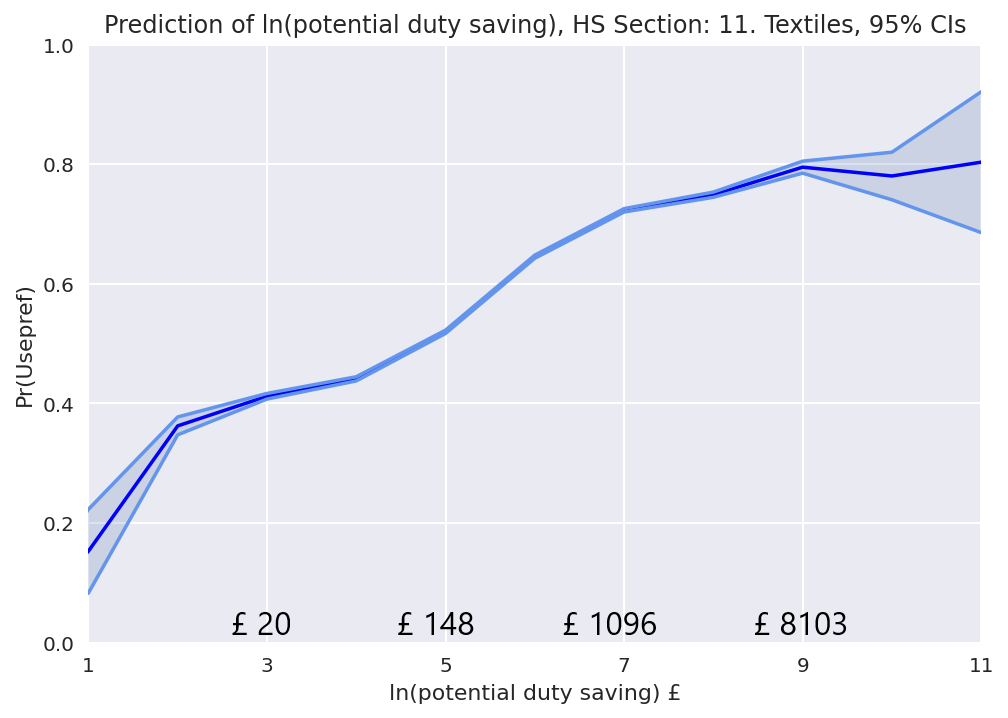
Figure 39: Prediction of ln(potential duty saving). Vegetable products.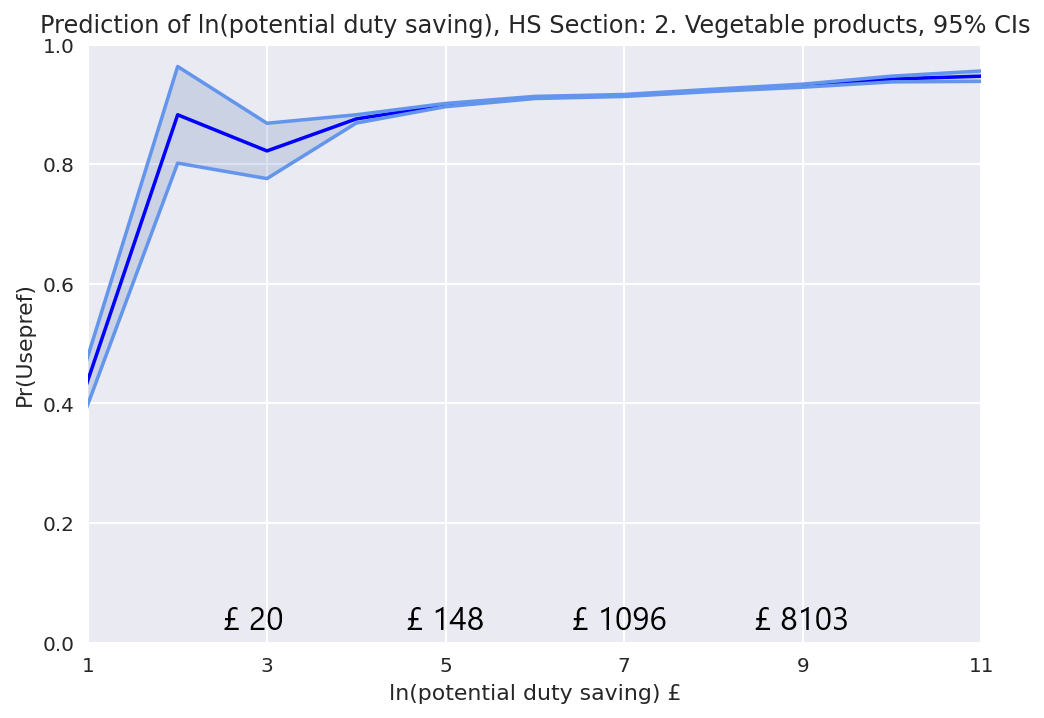
Our analysis indicates that there is a strong relationship between the probability of preferential tariffs utilisation and the potential duty savings. In general, this probability increases with the increase of potential duty savings. There is also a strong relationship between the probability of preferential tariffs utilisation and the transaction value. That is, the use of preferential tariffs increases with the increase of transaction value. Both findings agree with the conclusions of previous studies, for example, the findings from.
We were not able to identify a robust relationship between preference margins and the utilisation of preferential tariffs. When looking into different import modes, we observe that for direct imports, the trend is that the utilisation of preferential tariffs increases with the increase of preference margins. For customs warehousing, the relationship between preferential margins and utilisation of preferential tariffs is unclear. Therefore, our findings here sit somewhere between the conclusions of, which suggest that there is a positive relation between preference margins and the utilisation of preferential tariffs and the results from, where this relation was reported as unclear. Further research is required to determine the relationship between preference margins and the utilisation of preferential tariffs.
The relationship between preferential tariff utilisation and potential duty savings exists even when drilling down into individual product categories, and the observed variation across these categories further reinforces that this is influential in the decision to use a preferential tariff. A deeper investigation into granular product detail is required here to understand which products and associated rules of origin are significant.
6. Conclusion
Analysis of the conditions under which companies opt to use tariff preferences suggests, perhaps unsurprisingly, that it is a multi-faceted decision that takes a variety of factors into account. Access to transaction-level data for UK imports and business characteristics has allowed a detailed exploration of some of these key factors in this report, and the value of using micro-data is crucial in understanding this important topic.
From the descriptive statistics and modelling, the most apparent factor behind the decision to use a preferential tariff is the transaction value of the import which in turn informs the potential duty savings. Businesses that did not use preferential tariffs made up 49% of those explored in this report but accounted for only 8% of potential duty savings. Across most product categories, the average transaction values for imports that utilise preferences are far greater than those than do not. The modelling also concludes that there is a strong relationship between the likelihood of a business using a tariff and the potential duty savings of that transaction. There is less evidence however that the preferential margin is significant in the decision to use a tariff, although on average these are slightly higher for preferential imports. This finding relating to preferential margins contrasts with the thrust of some of the established economic literature and therefore is particularly interesting.
An understanding of business-level behaviour for UK import tariffs is very limited, and this report presents an investigation of whether these characteristics were significant in the decision to use a tariff. The general assumption is that larger businesses are more efficient at utilising preferential tariffs, although the wider literature is divided on this as summarised in Chapter 2. The findings in this report indicate that company size is not a significant factor for tariff utilisation, and in fact, small and medium businesses are slightly more efficient with their use of tariffs than large businesses. A similar picture is seen with the UK regions that these businesses are registered in, although a dissection of this in Chapter 4 suggests that there are pockets of under-utilisation in certain regions that warrant further investigation.
Variation in the usage of preferential tariffs is also seen by the type of products being imported and while this is partially explained by the fact that certain products are cheaper on average (and therefore more likely to under-utilise preferential tariffs given the headline conclusions in this report), it could also be because of product-specific rules of origin that are required for preferential imports. A follow-up analysis that incorporates the burdens of these rules, especially at a more granular harmonised system (HS) level, could shortlist goods that require simplified rules to boost utilisation. Another factor could be the years of implementation of certain FTAs over the 11-year period in this report, which potentially misconstrues product-level utilisation, however certain categories like textiles are consistently under-utilising tariffs across the period and certainly warrant a deeper analysis.
Utilisation rates offer a clear picture on the effective use of FTAs and analysis of transactions is an effective method to lift the hood and explore the principal determinants affecting these rates. This analysis should ideally be complemented by the use of other research methods to widen and deepen our knowledge on this topic. For example, a business survey and qualitative interviews or focus groups with businesses could help shed light on the specific decision-making processes that lead to the use of preferential or MFN tariffs. This could also help understand:
- the key enablers and barriers to preferential tariff utilisation
- what, if any, actions could further improve utilisation
- where those actions should be targeted to be most effective (for example, certain types of firms, in certain sectors, or in certain UK regions)
Whilst this analysis shows there are many factors at play involved in the decision to use a preferential tariff, the stand-out conclusion in this report is that the transaction cost and potential duty saving play the biggest role in this decision. Incentivising businesses to increase use of preferential tariffs for low-value imports by simplifying rules, especially across some of the product categories and countries of origin analysed in this report, may improve overall utilisation and duty savings, though further research will be needed to test this hypothesis and understand what incentives could work best, for whom, how and why.
7. Appendix
Details of businesses
| Firm size | Number of businesses | Estimated duty savings (£) | Estimated duty savings (%)
|
PUR (%) |
| Micro | 29,292 | 813,367,552 | 25 | 87 |
| Small | 15,448 | 703,890,263 | 22 | 90 |
| Medium | 6,199 | 1,328,233,640 | 41 | 92 |
| Large | 1,653 | 378,672,028 | 12 | 85 |
| Total | 52,592 | 3,224,163,484 | 100 | – |
Definitions
Preference margin = Most Favoured Nation (MFN) import Tariff – Preferential Import Tariff
Preference utilisation rate (PUR) = total transaction value of preferential imports/total transaction value of preference-eligible imports
Preference saving rate (PSR) = total duty savings/total potential duty savings