Case study: responding to the coronavirus pandemic using aggregated BT mobility data

As coronavirus (COVID-19) hit the UK in early 2020, decision-makers at the heart of the government looked to the Office for National Statistics (ONS) to provide good quality, fast information on a rapidly changing situation. Some of the questions we were asked to address were:
- how have the movement restrictions affected mobility for the people of the UK, particularly vulnerable people?
- how have main locations like transport hubs and supermarkets been affected by restrictions?
- how have restrictions affected different parts of the UK?
Decision-makers wanted fast answers to these questions. This meant daily updates without delay between the activity and the reporting, information on what was happening at a local level – something that is not usually possible with official statistics produced from processed survey data. While official estimates are accurate and reliable, the ONS’ traditional survey approach could not provide the required speed and granularity for this challenge.
Working with BT to address the challenge
BT stepped in to support the national fight against coronavirus (COVID-19) in March 2020, by making aggregate, anonymised mobility data available to the UK Government. These data helped to inform decision making at the highest level. The Office for National Statistics’ (ONS’) Data Science Campus, a hub for data science and innovation for the ONS and the wider public sector, quickly turned these data into daily updates, with only one day’s delay between activity and the reporting of it. This was a completely unprecedented frequency and speed of reporting for the ONS.
Adherence to high standards of ethics and privacy, as well as legal requirements, are very important to both the ONS and BT. BT never shared any data with the ONS in which any individual or individual business could be identified, and have published details on how customers’ data has been safeguarded. The ONS carried out an ethical review, and held and processed the data in compliance with our own data principles. This was to ensure that the privacy and confidentiality of data subjects was protected.
With more than one quarter of the market share in the UK, BT Group is the largest mobile operator in the UK (Ofcom, 2021). This coverage helped us to develop meaningful metrics at speed.
The data
Aggregated mobile phone activity across 2G, 3G and 4G voice and data usage is at the origin of the mobile phone data. For contract holders, additional information such as age or gender may also be available.
The data were anonymised and aggregated over time, geography, and potentially age or gender, to produce the anonymised, aggregate datasets that were provided to us.
To make sure that the mobile phone data is representative of the UK population, it was weighted by geographical area, taking into account home locations, gender and age band, using population estimates from the ONS.
Finally, in compliance with the General Data Protection Regulation (GDPR), statistical disclosure control was applied to the aggregated data tables before they were delivered to the ONS, to further protect confidentiality. All cells in the data tables were rounded to the nearest 10 and cells with values of less than 20 are removed. We only shared analysis derived from this aggregated data with the approval of BT, and only for the purposes of the government (UK and devolved administrations) response to coronavirus (COVID-19). This included the Cabinet Office’s Civil Contingencies Secretariat, and the Civil Contingencies Committee (COBR or COBRA).
Understanding mobility at the start of the coronavirus (COVID-19) pandemic
Here’s how we tackled the three challenges we set out.
What is the impact of the restrictions on movement on the UK’s mobility, particularly for vulnerable people?
We looked at the proportion of the UK population who stayed in their local area, by age band. Local area is defined as interactions with only one or two sectors (phone masts or cell towers) per day. This is the smallest geography possible with cell phone data.
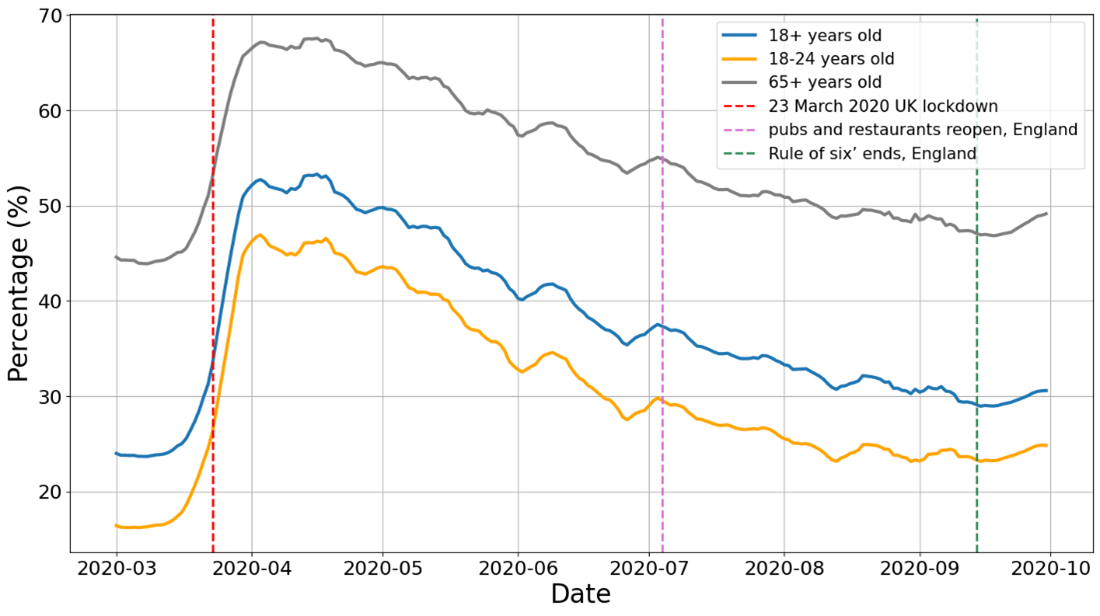
Figure 1 shows that between March and September 2020, older people, who are more vulnerable to coronavirus (COVID-19), have always been less likely to leave their local area than younger, working age populations. Following the first UK-wide lockdown that began on 23 March 2020, the proportion of those not leaving their local area grew by around 20 percentage points but fell at later stages.
Figure 1: This figure shows the proportion of the UK population remaining in their local area, by age band, March to September 2020.
What is the impact on key locations like transport hubs and supermarkets?
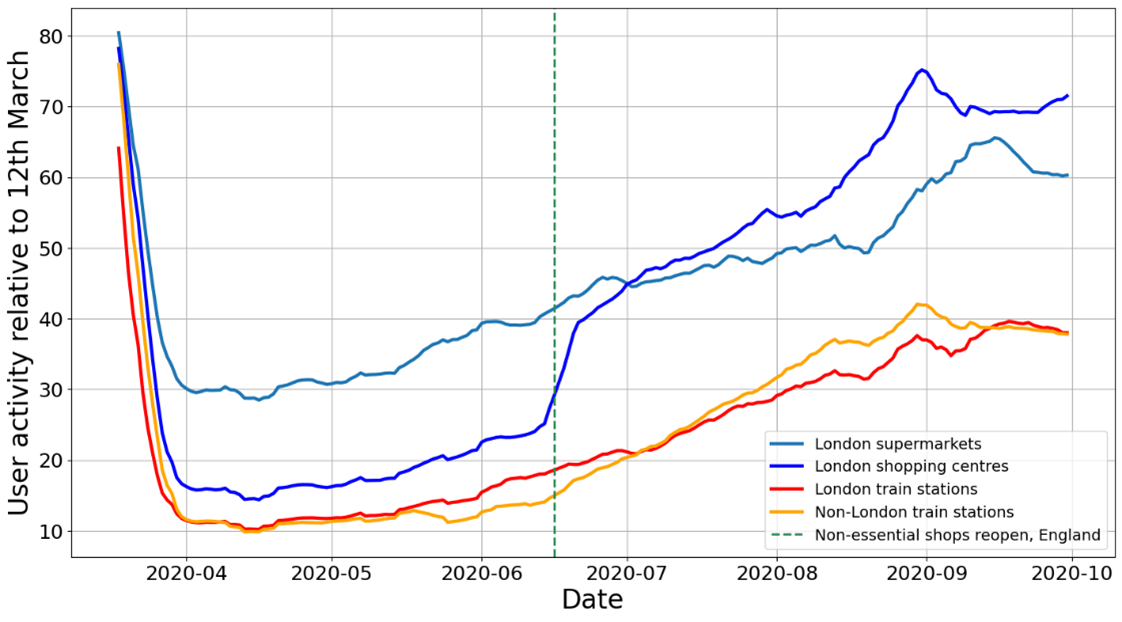
We used BT’s aggregate cellular data from a set of specific locations. Figure 2 shows a jump in visits to London shopping centres when non-essential shops reopened in England on 15 July 2020. However, by the end of July, the number of unique users at these key locations was still only half of what it was prior to the start of the coronavirus (COVID-19) pandemic.
Figure 2: relative number of unique users interacting with the mobile network in main UK locations, 12 March 2020 = 100. There was a big jump in visits to London shopping centres when non-essential shops opened in England in July 2020
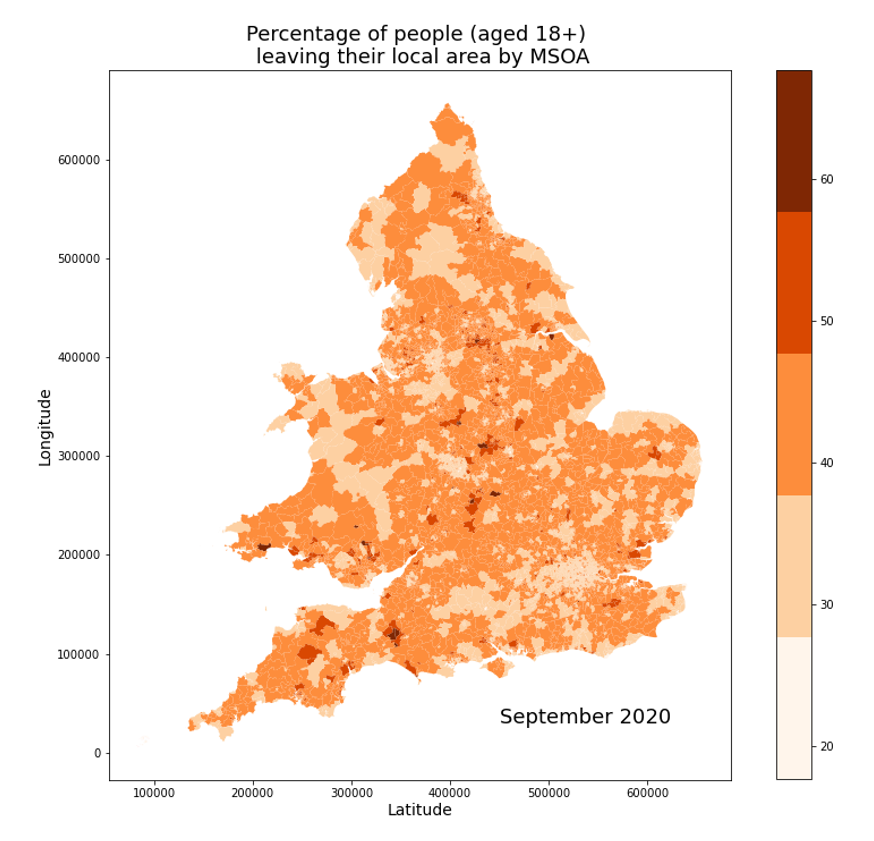
What has been the impact of restrictions on different parts of the UK?
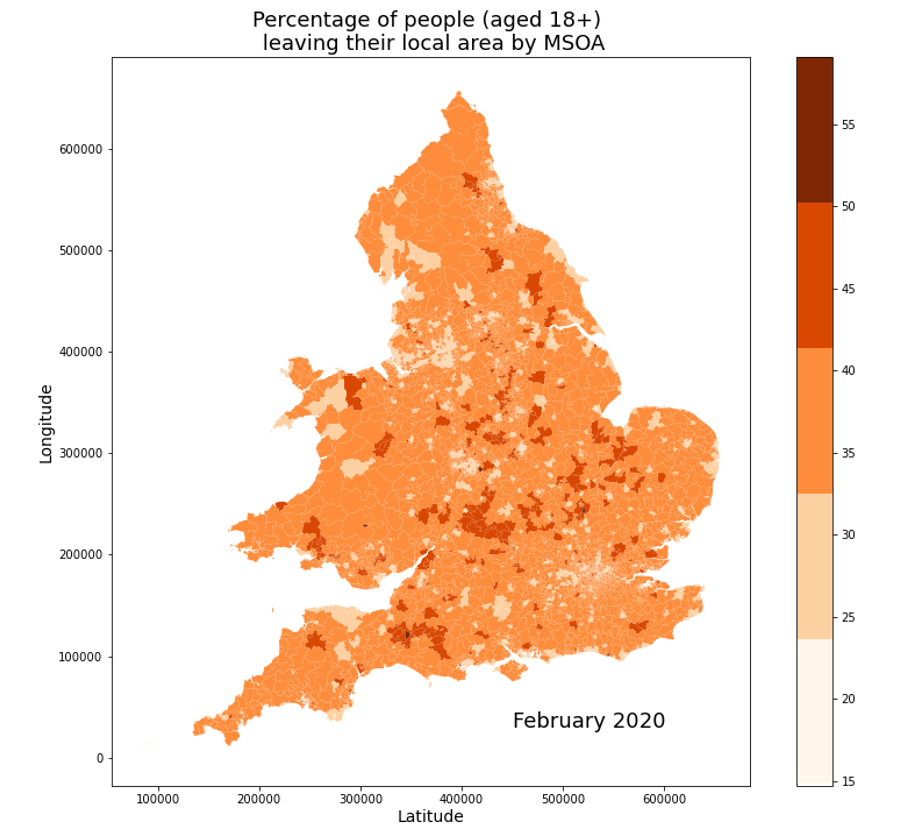
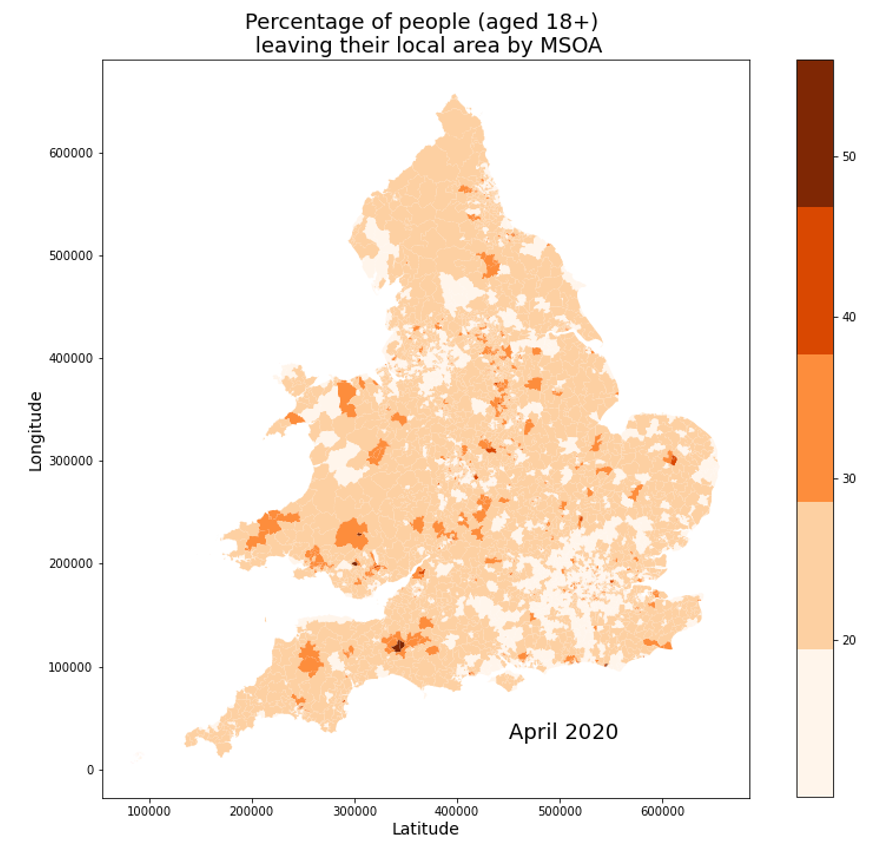
Figure 3 shows how movement was more restricted in urban areas than rural areas in April 2020 but had increased in these areas by September 2020.
The maps show the proportion of people who left their local area, by local geographies (middle layer super output areas, MSOAs).
Figure 3: people in urban areas were less likely to be leaving their local area during lockdown than those in rural areas. The maps show the proportion of those aged 18 and over spending time away from their local area, by middle layer super output area for Wales and England, in February 2020 (top), April 2020 (middle), and September 2020 (bottom). Mobility has increased over that time, particularly in dense urban areas.
What have we learned?
The demand for real time indicators and for using sources of data that are new to us has never been greater. The use case for mobility data that we have presented here was for a very specific purpose – to meet the immediate demand for up-to-date information on the mobility of the UK population, particularly at the start of the coronavirus (COVID-19) pandemic.
Through this work, we have learned much about the value of this type of mobility data. Our next steps are to assess new uses for this type of data. This includes:
- using mobility data as a factor to assess COVID-19 risks
- detecting early signs of outbreaks at local geographies
- developing real-time population indicators
- enhancing travel and tourism statistics
We are grateful to the BT team for all the support they have given, to help the nation tackle the coronavirus pandemic.
We would be very happy to hear from other organisations who might be interested in partnering with us.