Faster indicators of UK economic activity: more timely and relevant shipping indicators
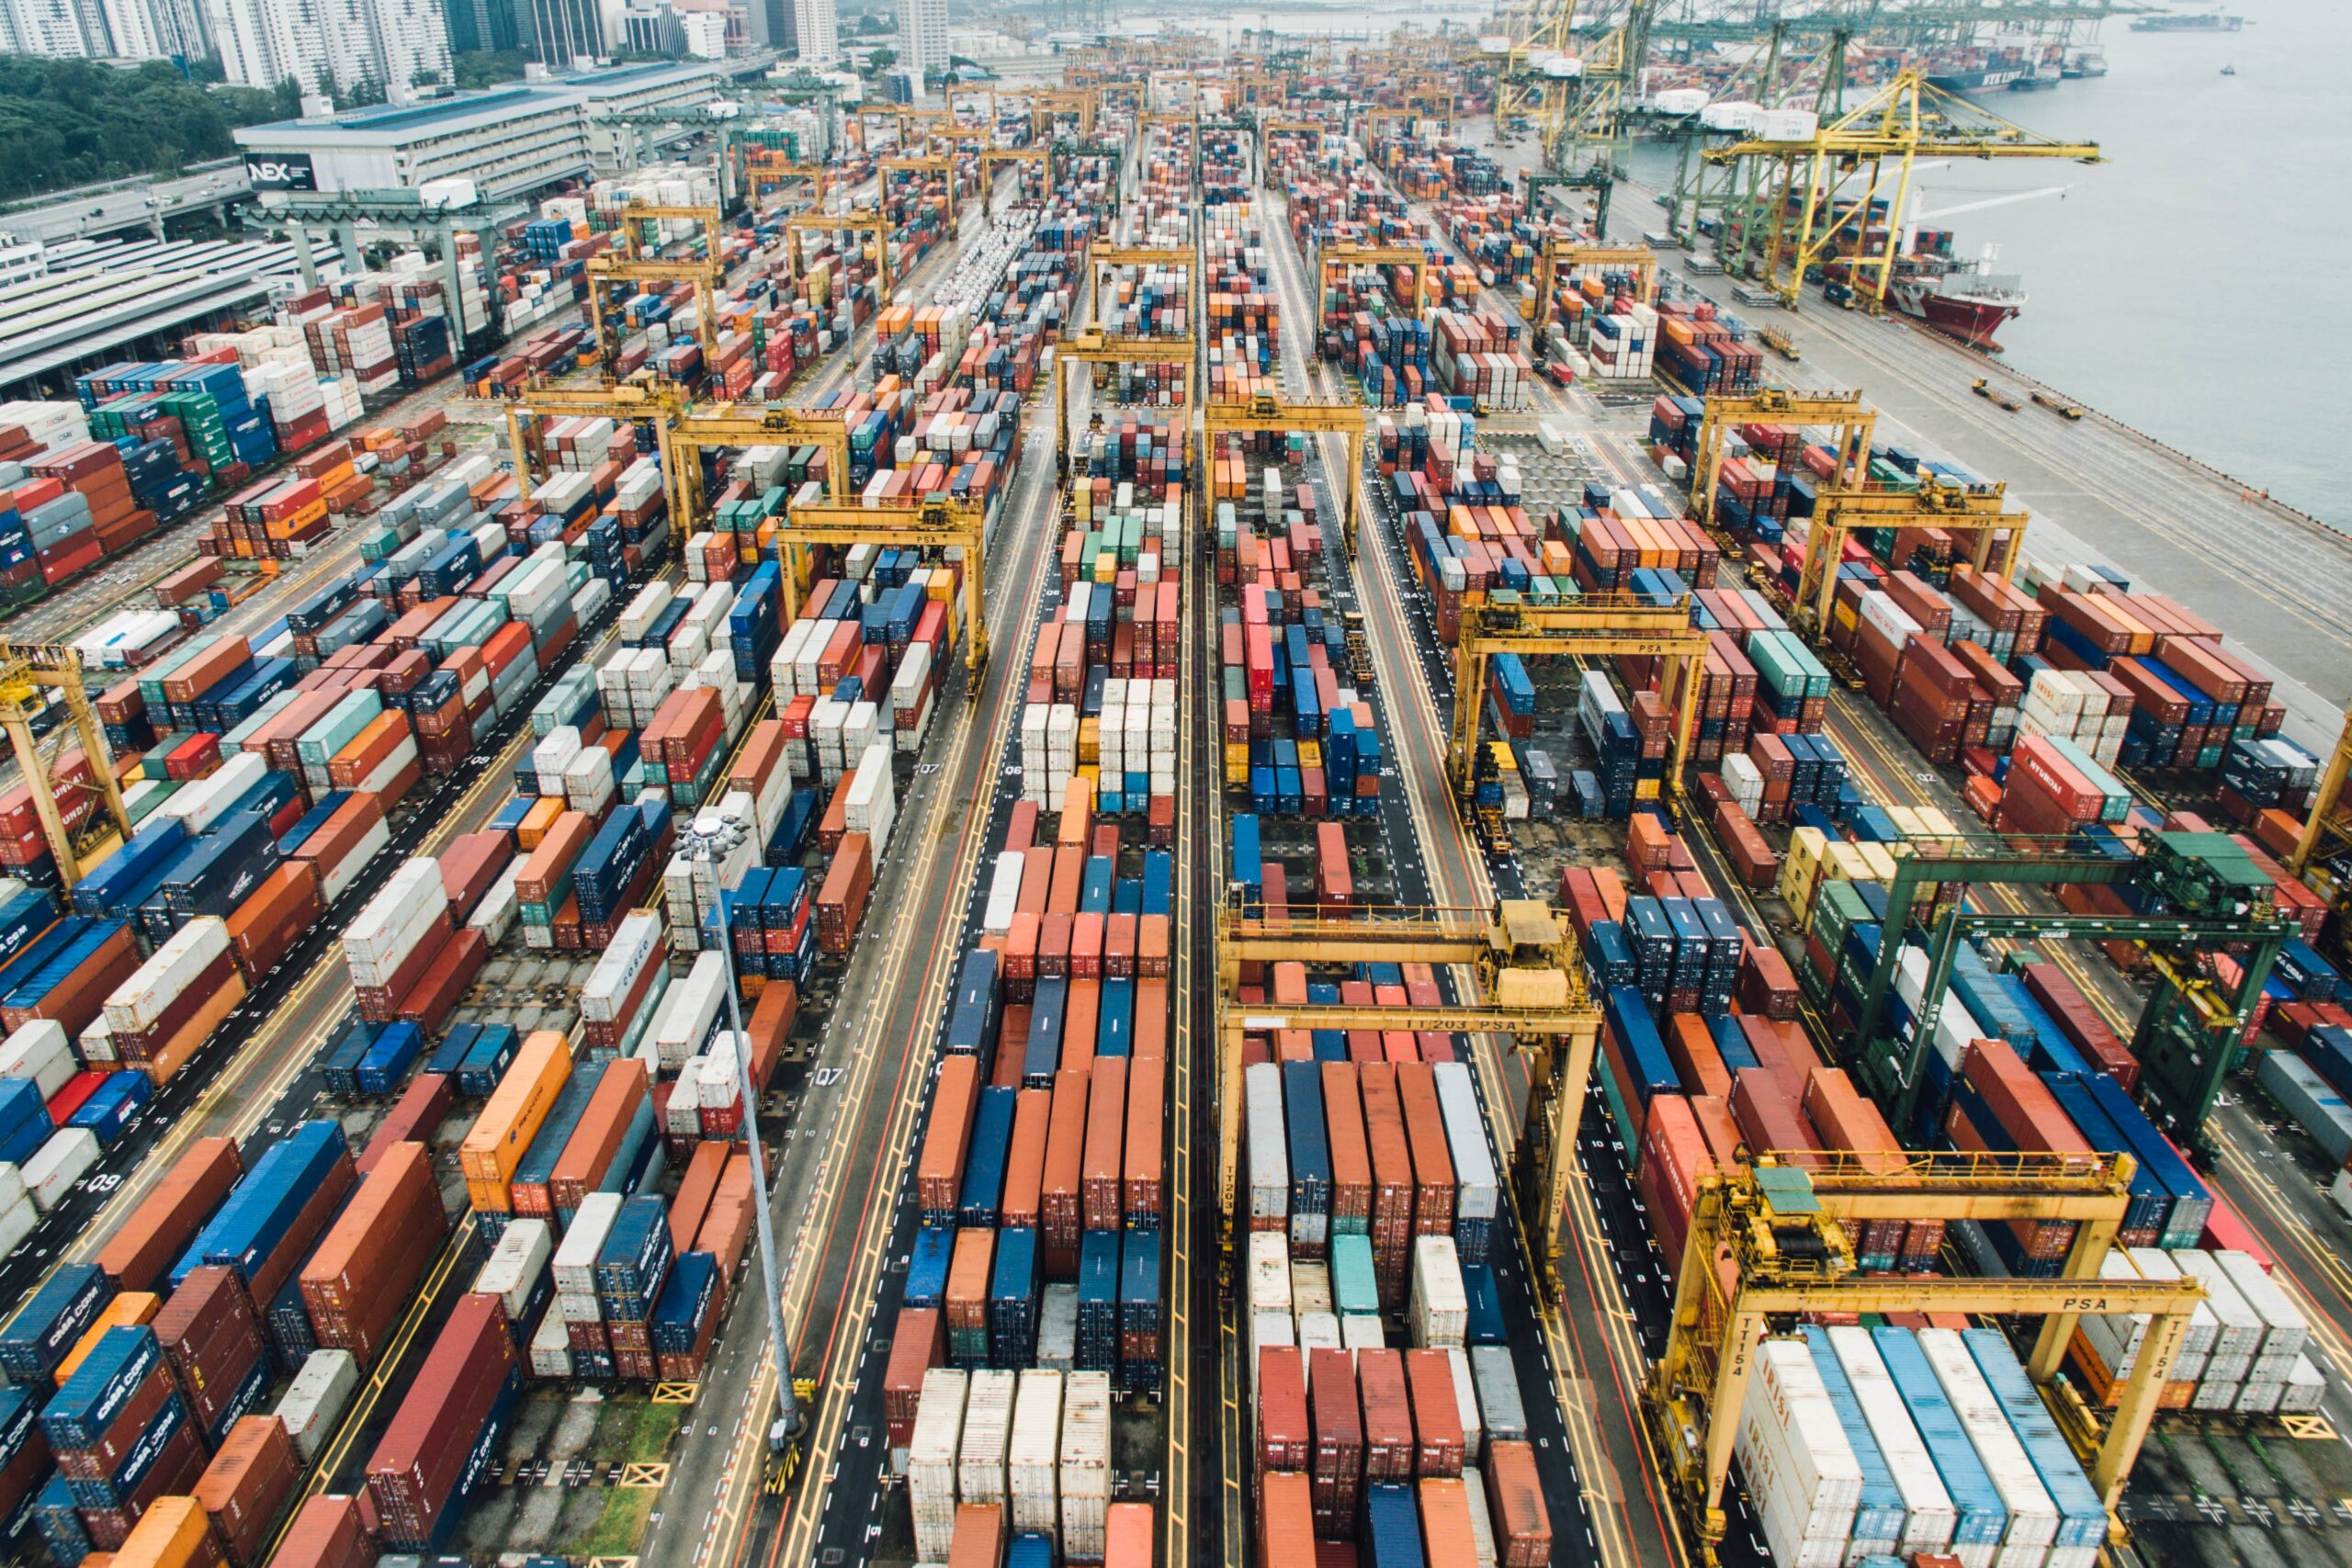
The Faster indicators of UK economic activity project, led by the Data Science Campus at the Office for National Statistics (ONS), is an innovative response to the challenge of producing faster economic information. In this work, we have developed a suite of indicators of economic activity, based on Her Majesty’s Revenue and Customs (HMRC) Value Added Returns, road traffic flow data for England, and indicators of shipping activity using Automatic Identification System (AIS) shipping indicators. These indicators are published in the monthly research output: Economic activity, faster indicators, UK.
This article summarises further development we have carried out to improve the timeliness and relevance of the shipping indicators, in response to feedback from our users.
We have access to an additional data source for the AIS ship tracking data, exactEarth, via the UN Global Platform. This data source allows us to:
- classify ships as “cargo ships or tankers” or “others”, so that ships not obviously associated with the movement of goods, such as passenger ships and pleasure craft, can be removed from the indicator
- create new weekly indicators for “cargo ships and tankers”, for:
- the number of visits to each port
- the number of unique ships visiting each port (port traffic)
- reduce the lag between the reference period and publication from around eight weeks to four weeks
- update the weekly indicators on a weekly basis
In this article, we present methodology, analysis and data for the new indicators for the time period April 2019 until end-September 2019.
We will continue to publish the existing indicators on a monthly basis. We will publish the first timely release of the new indicators with the release of the monthly research output Economic activity, faster indicators, UK on 22 November 2019.
These research outputs are part of the Faster indicators of UK economic activity project and are not official statistics. The indicators are not yet fully developed. We make these data available at an early stage to invite feedback and commentary on their further development.
It is important to note that we are not attempting to forecast or predict headline trade statistics here, and the indicators should not be interpreted in this way. Rather, by exploring shipping activity in UK ports likely to have an impact on trade in goods, we provide an early picture of activity that supplements official economic statistics and may aid economic and monetary policymakers and analysts in interpreting the economic situation.
The data for the new indicators which accompany this article, for the time period April 2019 to September 2019, can be found in the Faster indicators of UK economic activity: more timely and relevant shipping indicators dataset.
1. What will be published and when?
The indicators listed in Table 1 are constructed from the new data source and are available from April 2019. We will publish the new series from that date up to the end of the latest available week. We expect to publish the first of these new outputs in the release Economic activity, faster indicators, UK on 22 November 2019.
We expect that the weekly series will be updated incrementally by one week, on a weekly basis, from that date until the end of March 2020, subject to user feedback and review. The weekly release will be paused for one week for New Year. The weekly indicators dataset will be available from Research output: Weekly shipping indicators – economic activity faster indicators UK.
Dates for the releases, and the time periods covered, can be found in the Office for National Statistics release calendar. The weekly updates will be published with the monthly release where the dates coincide.
The new indicators, listed in Table 1, will:
- be weekly and monthly
- include only those vessels which are classified as cargo or tankers
- be provided for the same set of ports as the current indicators
We note that publication of these additional indicators represent the next step in the faster indicators programme, and we welcome feedback and comments on these and further development.
Table 1: List of new indicators, by port, and for the sum of the ports, data source: exactEarth
| Vessel type | Indicator | Frequency |
| Cargo ships and tankers | Port traffic (unique ships) | Weekly |
| Cargo ships and tankers | Total number of visits | Weekly |
| All ships | Port traffic (unique ships) | Weekly |
| All ships | Total number of visits | Weekly |
| Cargo ships and tankers | Port traffic | Monthly |
| Cargo ships and tankers | Total number of visits | Monthly |
| All ships* | Port traffic | Monthly |
| All ships* | Total number of visits | Monthly |
* These two indicators will only be published in the dataset for this article, for comparison with the other indicators.
We have constructed indicators for 13 UK ports: Grimsby and Immingham, London, Liverpool, Southampton, Milford Haven, Felixstowe, Tees and Hartlepool, Forth, Dover, Belfast, Larne, Holyhead and Warrenpoint, and an all ports indicator, which is the sum of those ports.
In order to avoid disclosure, we have suppressed any counts of five or fewer and have suppressed further cells to avoid secondary disclosure where necessary. This mostly affects the weekly indicators.
2. Data, methods and quality
2.1 Automatic Identification System (AIS) Shiptype classification
One of the goals for the shipping indicators is to provide an early indication of the movement of goods into and out of the UK. Although we are not attempting to predict or replicate official statistics, we would like to remove data from vessels not engaged in the movement of goods – such as passenger ships – and include only those ships engaged in trade in goods in our indicators.
In the additional dataset from exactEarth, ships are classified by their AIS Shiptype number. These numbers are included in the AIS messages that are used to construct the indicators and categorise the vessel type, for example, passenger, cargo, tanker. The ship’s crew are responsible for entering this information. Shiptype numbers 70 to 79 are classified as cargo ships, and 80 to 89 are classified as tankers. “Cargo ships and tankers” are therefore defined in our new indicators as those vessels with Shiptype 70 to 79 and 80 to 89.
This classification is different from that used in the Department for Transport’s UK Port Freight Statistics. In particular, roll-on/roll-off passenger ships (Ro-Ro/Passengers) are identified in the AIS Shiptype classification in class 60 to 69 – passenger ships, although they may also carry road freight. We have chosen to exclude Ro-Ro/Passengers from our indicators because we cannot identify this particular type of ship uniquely in the AIS Shiptype classification. The classification includes, among others, ferries, houseboats and purely passenger ships. The impact of this choice on the indicators for the Port of Dover is discussed in more detail in Section 4.3. In future, we could consider including indicators for passenger ships separately in the dataset, if users would find this useful.
However, we expect that, by restricting the indicators to clearly defined cargo ships and tankers, we improve our shipping indicators as indicators of the movement of goods, by removing data from other craft. In Section 4, we compare the indicators with official statistics on trade in goods.
Over 99% of the AIS messages contain the AIS Shiptype number. For those vessels where the Shiptype is not recorded, we have modelled the ship type. The model is described in Section 3.
More information on Shiptypes, and a full list of the classifications can be found in the article What is the significance of the AIS Shiptype number?
3. Modelling the classification of ship types
3.1 The problem
Disaggregating faster economic indicators by vessel type requires access to up-to-date classification for each vessel entering ports of interest. This can be achieved by linking to a complete and up-to-date ship register. When this is unavailable, as in this case, we can build a dynamic ship register by processing static messages containing vessel type information relayed in the Automatic Identification System (AIS) data stream and accumulating this information over time.
However, the resulting dynamic register is incomplete, and subject to change. Misconfigured onboard AIS equipment can result in empty fields or lack of any static messages from vessels that otherwise transmit their positions. Ships can also change ownership or flag and therefore be sailing under different Maritime Mobile Service Identity (MMSI) identifiers. In rare cases, it is also possible that a MMSI identifier is reused for different vessels owned by the same fleet operator.
The above scenarios could lead to obsolete or inaccurate information about vessel types being stored in the dynamic register, which has implications for the new indicators. Therefore, to minimise inaccuracies in reporting, we propose a method for indirect vessel type estimation that can classify vessels with no known type and enable identification of ships with inaccurately reported shiptype. This method uses the available AIS information over the last six months to infer the vessel type in the current month.
3.2 Developing the model concept
When analysing ship motions in ports, we noticed an interesting pattern related to the tendency of ships of the same type to stop or manoeuvre, for example, turn sharply, in approximately the same areas of the port. This behaviour can perhaps be explained by port authority policies and procedures, which could be aimed at separating different types of ships because of safety considerations or operational optimisation measures.
Alternatively, geographical separation of ship types could be because of the designation of certain berths to specific loading activities, like oil terminals for tankers, passenger terminals for ferries or container handling gantry cranes for loading and unloading intermodal containers into container ships. Additionally, the size, manoeuvrability and the typical draught of different vessel types force different spatial distribution constraints when in ports.
Exploring the dependence of vessel type on the traffic spatial distribution led to the development of the Shiptype classifier described. Its main principle is based on classification of the areas where the vessels with known Shiptypes have stopped or executed certain sharp turn manoeuvres, referred to as Stoppage or Manoeuvre (SM) areas.
Inspired by the K-NN algorithm, we decided to base the estimation of the type of an unknown ship by matching them by probability with other ships with known vessel types that have had SM events in same area. The areas are defined by using the 40 bit geohash code (geolocation encoded into a string of digits and letters) of the coordinates relayed via the AIS stream. This approach, in similarity to existing unsupervised learning methods, does not require manual creation of labels and therefore allows easy automatic SM area reclassification based on the latest available information from AIS.
Essentially, we expect that ships of the same type, on the whole, visit the same area of a port and stay for a similar amount of time. To take an extreme example, we do not expect that an oil tanker would ever moor in a yachting marina, but rather that cargo ships and tankers will generally use the relevant specialist unloading areas of a port.
3.3 The method
Any classification based on ships stopping or changing direction first requires a detection mechanism for such events. The method to detect SM events is based on comparing the distances between the current position of the vessel and its previous positions. The method is considered particularly suitable for application with large datasets owing to its small computational footprint.
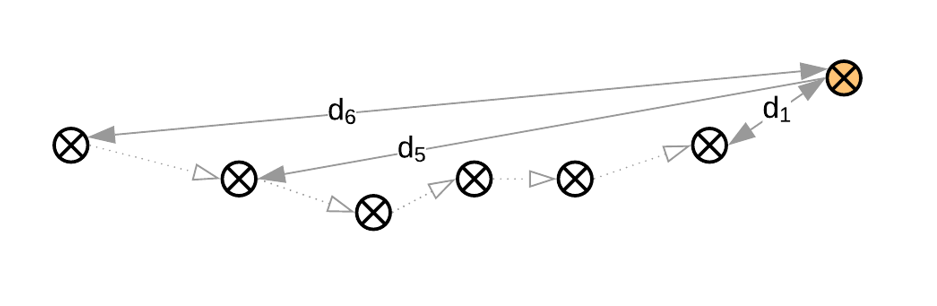
During a typical voyage, ships tend to maintain a certain direction, keeping within the shipping lanes, making only small corrections to the course. In such cases their paths can be approximated by a line of segments with small directional changes as shown in Figure 1.
If the distance between the last ship position and the previous one is denoted with d1 and the distance between the last position and the mth and (m+1)th previous positions are denoted with dm and dm+1, then if the ship is in the main part of its voyage, and travelling in broadly straight line, the following condition is met:
d1 < (dm + dm+1)/2
The case when a vessel is moving in a line and m=5 is illustrated in Figure 1.
Figure 1: A vessel moving with small course corrections, see Section 3.3 for details
When ships manoeuvre in a port, they do not maintain a constant course. When ships are stationary and their AIS equipment is still transmitting, reported positions can appear scattered as a result of noise. In both cases the segments between the individual reported positions do not form a line, and as illustrated by Figure 2, the condition d1 < (dm + dm+1)/2 is not guaranteed to be met. In this case, the last reported position can be closer to the positions reported further back in time than the immediately previous position. The case when a vessel is turning sharply and m=5 is illustrated in Figure 2.
Figure 2: A ship docked, or close to docking, see Section 3.3 for details
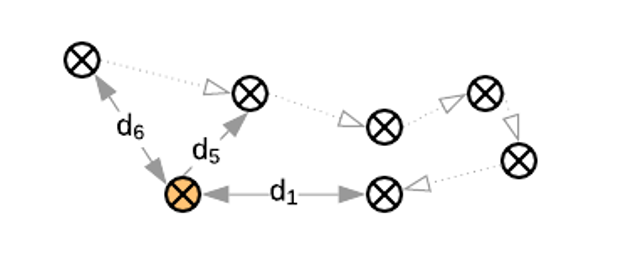
As the condition checking is a simple and computationally efficient calculation, it can be done for every position reported by a ship. This results in sufficiently high spatial resolution of SM events detection that enables using relatively small geohash areas.
The time elapsed between the current and the mth position provides additional information about the duration of the SM events. For example, this period will correspond to waiting time at the specific area. We have grouped this SM event duration period into time bins of 30 minutes to simplify the algorithm.
After all SM events have been collected over the predefined period of six months their number is aggregated by known ship type, geohash code and duration time bins. This aggregation is used to estimate the probability that each vessel type has had an SM event in the same area and with the same duration. If an area does not have enough ships reporting an SM event of a corresponding duration, it is excluded from the process, to reduce the likelihood of inaccurate classification. This threshold is provided as a parameter to the algorithm. The resulting geohash and duration timebins, together with the probabilities for different ship types are stored as the SM classification dataset that is later used to classify ships of unknown type.
During inference, the detected SM event areas for ships of unknown type are looked up in the SM classification dataset by geohash and duration time bin. If a suitable match is found, the ship type with highest probability is assigned to the ship. We then use the precise docking location and the length of docking time for ships with known classifications to assign Shiptype to unclassified ships with similar behaviour.
Building the SM classification dataset with data over six months and evaluating the performance on the following month using unseen data, the accuracy, precision and recall metrics have been calculated. Table 2 shows the results of an experimental evaluation of various values of m. We found the optimal value to be 6, after which point accuracy, precision and recall fluctuate. Choosing m=6 gives an accuracy of 86%, a precision of 80% and recall 79%.
Table 2: Accuracy, precision and recall for various values of m, showing the optimum value to be m=6, see Section 3.3 for details.
| m | accuracy | precision | recall |
| 4 | 0.85337 | 0.78013 | 0.77913 |
| 5 | 0.86033 | 0.79335 | 0.78770 |
| 6 | 0.86348 | 0.79934 | 0.79202 |
| 7 | 0.86339 | 0.80522 | 0.78937 |
| 8 | 0.86944 | 0.81237 | 0.80201 |
3.4 A comparison of new and existing indicators
In this section, we compare the monthly indicators published in the release Economic activity, faster indicators, UK with our new indicators. The indicators are described in Table 3.
Table 3: Indicators discussed in this article, the current indicators are constructed using data from OrbComm, and the new ones use data from exactEarth
| Indicator | Current or new? | Description |
| Port traffic – OrbComm | Current | Number of unique ships visiting the port |
| Number of visits – Orbcomm | Current | Total number of visits to the port |
| Port traffic all – exactEarth | New | Number of unique ships visiting the port |
| Number of visits all – exactEarth | New | Total number of visits to the port |
| Port traffic cargo ships and tankers – exactEarth | New | Number of unique ships visiting the port, cargo ships and tankers only |
| Number of visits cargo ships and tankers – exactEarth | New | Total number of visits to the port, cargo ships and tankers only |
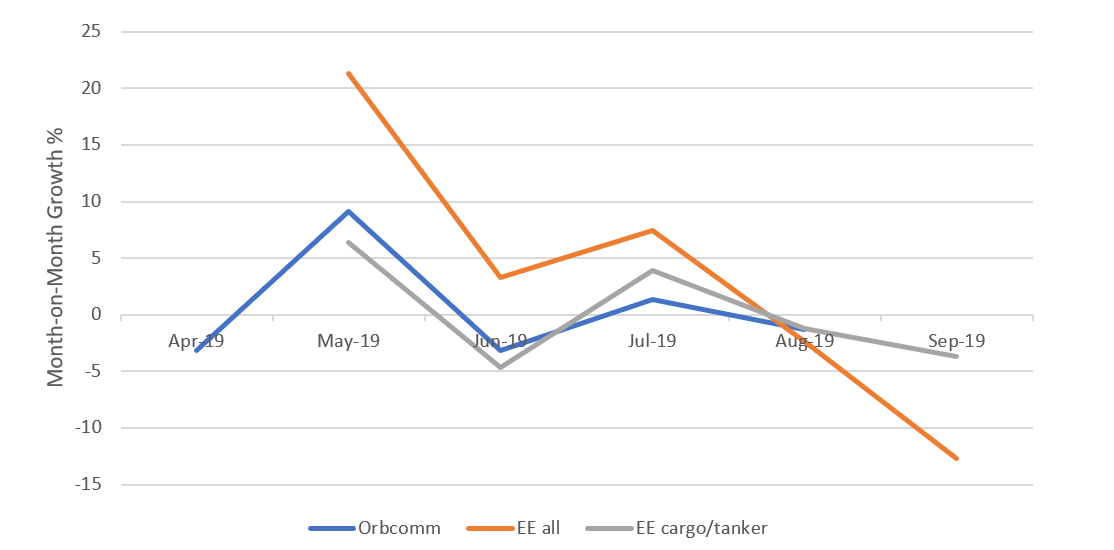
Figures 3 and 4 show that the new (exactEarth) port traffic indicators for ‘all ships’ have, on average, higher counts than the current indicators (OrbComm), especially during July and August. The exactEarth data shows a general increase over the summer period for ‘all ships’, with a sharp decline in the growth rates plot for September.
This could suggest that much of the additional traffic in the new all ships indicator is due to non-trade related ships such as pleasure-vessels which would likely see an increase in activity during the summer months.
Figure 3: Monthly port traffic indicators for OrbComm, exactEarth all ships (EE all) and exactEarth cargo ships and tankers (EE cargo/tanker), non-seasonally adjusted
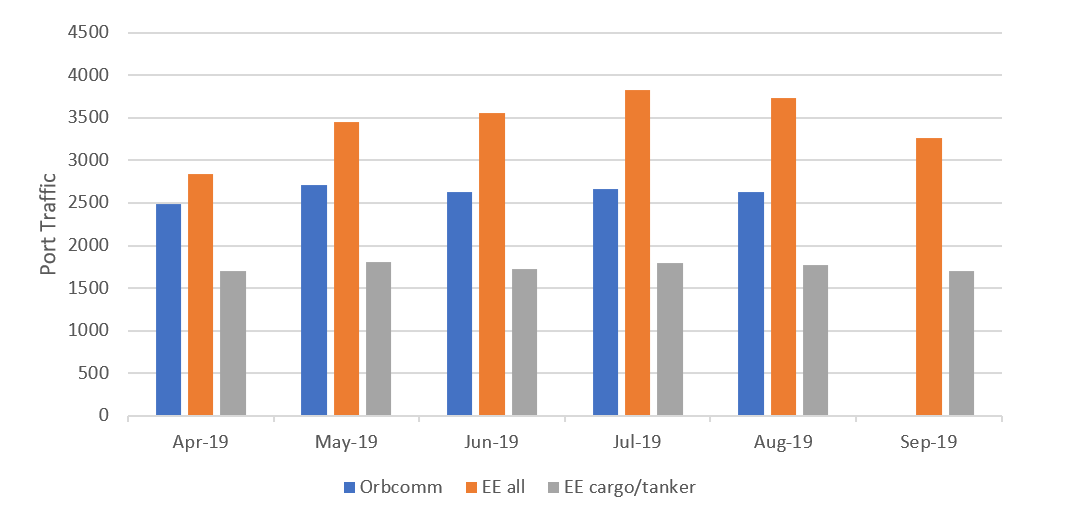
Figure 4: Month-on-month growth rates of the port traffic indicators for OrbComm, exactEarth all ships (EE all) and exactEarth cargo ships and tankers (EE cargo/tanker), non-seasonally adjusted
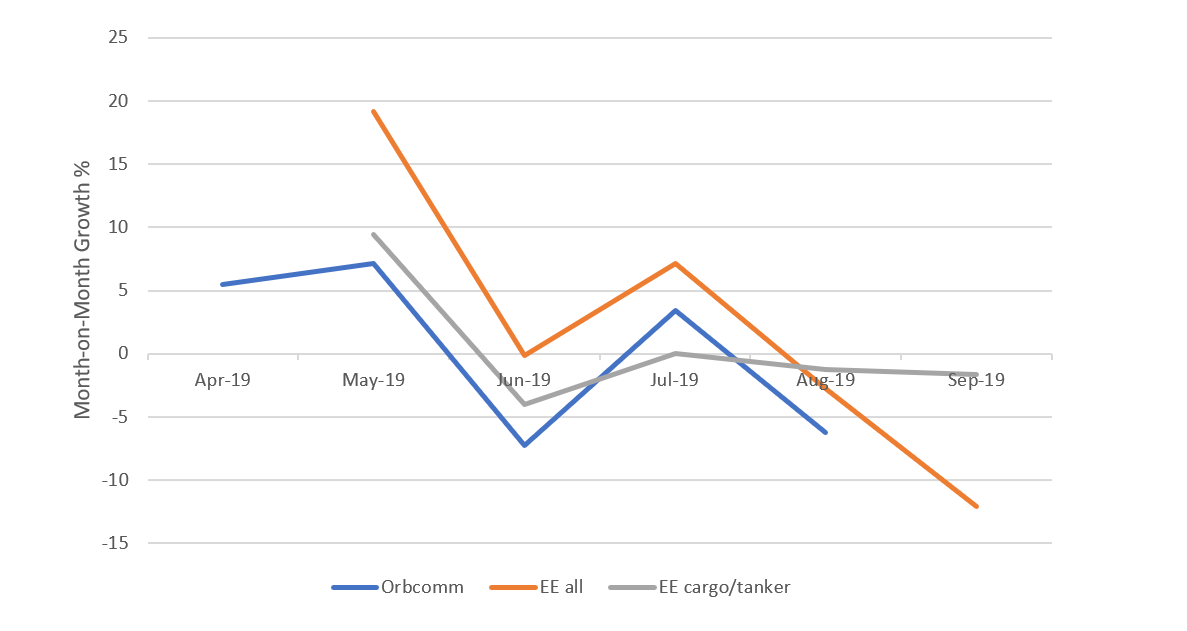
Figures 5 and 6 show the total number of visits, and the growth rates for the total number of visits for the new and current indicators. Although the difference is less striking, we see that in the summer months the new all ships indicator records more visits in the summer months than the current indicator.
We note that the exactEarth data is only available from April 2019, so seasonal adjustment is not possible.
Figure 5: Monthly total number of visits indicators for OrbComm, exactEarth all ships (EE all) and exactEarth cargo ships and tankers (EE cargo/tanker), non-seasonally adjusted
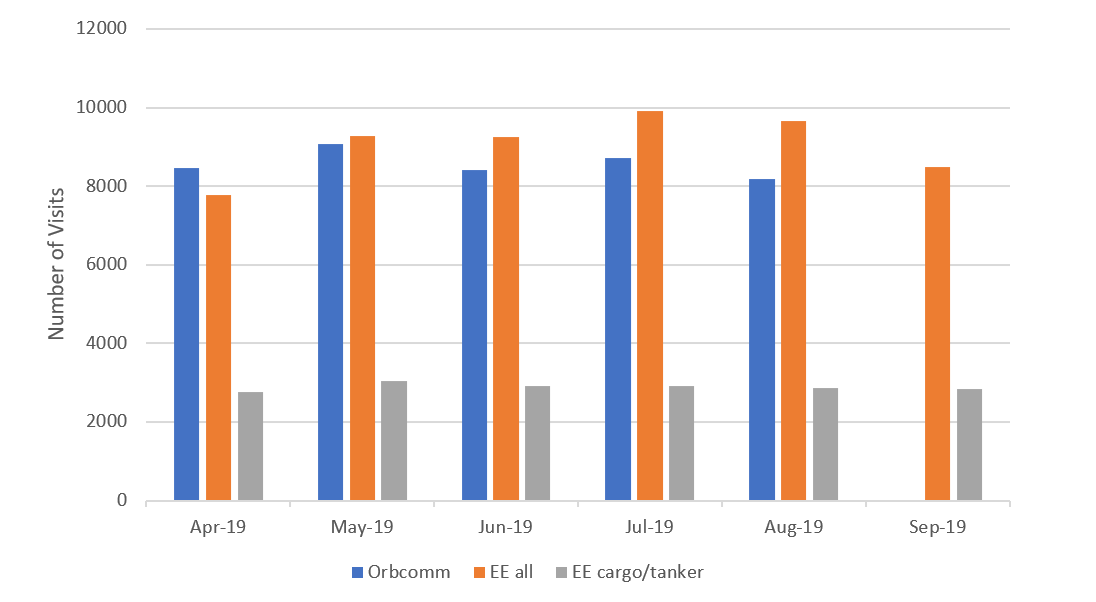
Figure 6: Month-on-month growth rates of the number of visits indicators for OrbComm, exactEarth all ships (EE all) and exactEarth cargo ships and tankers (EE cargo/tanker), non-seasonally adjusted
4. Economic analysis
4.1 The relationship between the indicators and official trade statistics
In this section, we compare the indicators with official estimates of the import and export of goods from the Office for National Statistics UK Trade release.
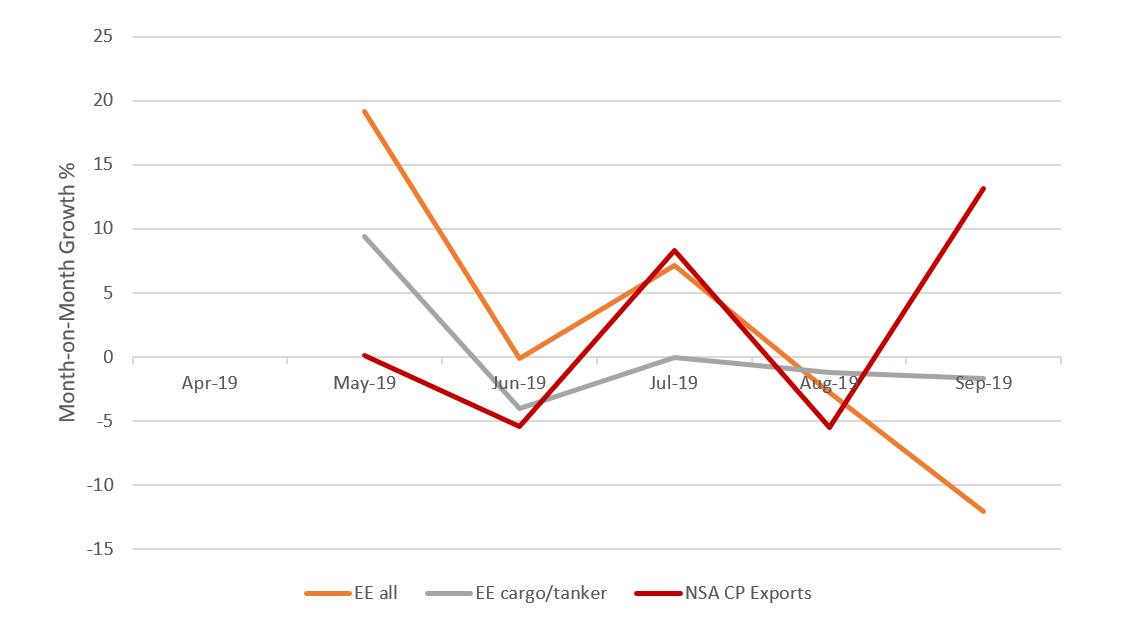
Figures 7 and 8 compare the growth rates of the port traffic indicators with current price, non-seasonally adjusted imports and exports of trade in goods respectively. Figures 9 and 10 do the same for the total number of visits indicators.
This analysis is based on only five data points, which is all we have available at present. However, this is encouraging evidence that the new cargo ships and tankers, total number of visits indicator is a useful indicator of shipping activity related to trade in goods, available in advance of the official trade statistics. It should be considered a supplement to official statistics, not a substitute. A much longer time series is required to track its performance over time.
In addition, the indicator tracks the number of ships visiting UK ports, and we do not have information available on the volume or value of any goods being loaded or offloaded from these ships. While these early results are encouraging, we require additional data points to fully evaluate the relationship between this information and the official UK trade in goods statistics. We do not currently recommend using them as published as a predictor of official trade in goods statistics.
Figure 7: Month-on-month growth rates of the port traffic indicators for exactEarth all ships (EE all) and exactEarth cargo ships and tankers (EE cargo/tanker), non-seasonally adjusted (NSA), compared with current price (CP), NSA UK imports of goods (source: ONS)
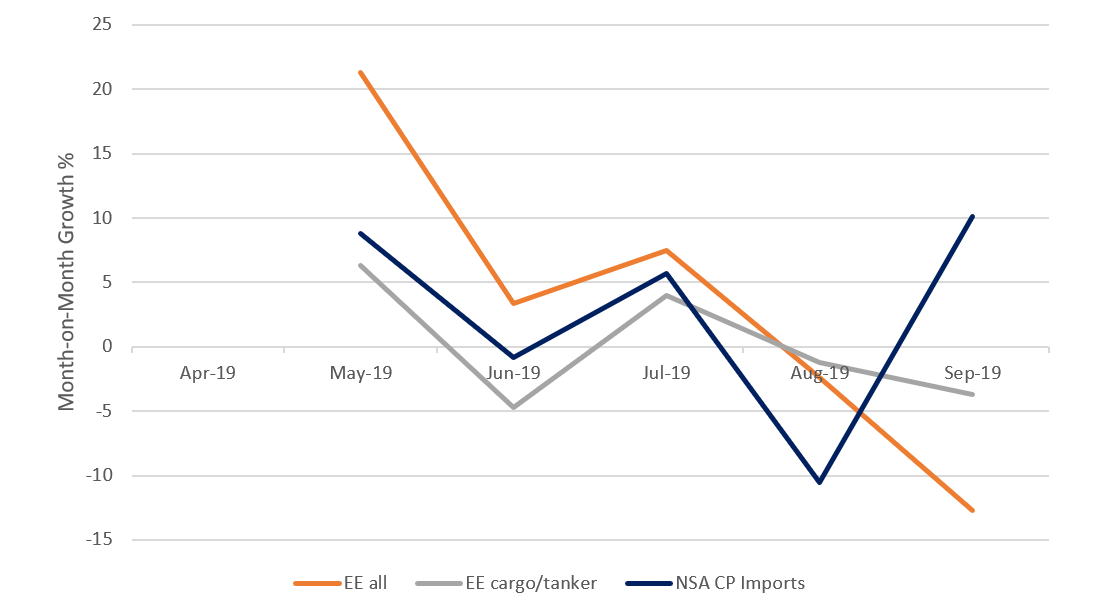
Figure 8: Month-on-month growth rates of the port traffic indicators for exactEarth all ships (EE all) and exactEarth cargo ships and tankers (EE cargo/tanker), non-seasonally adjusted (NSA), compared with current price (CP), NSA UK exports of goods (source: ONS)
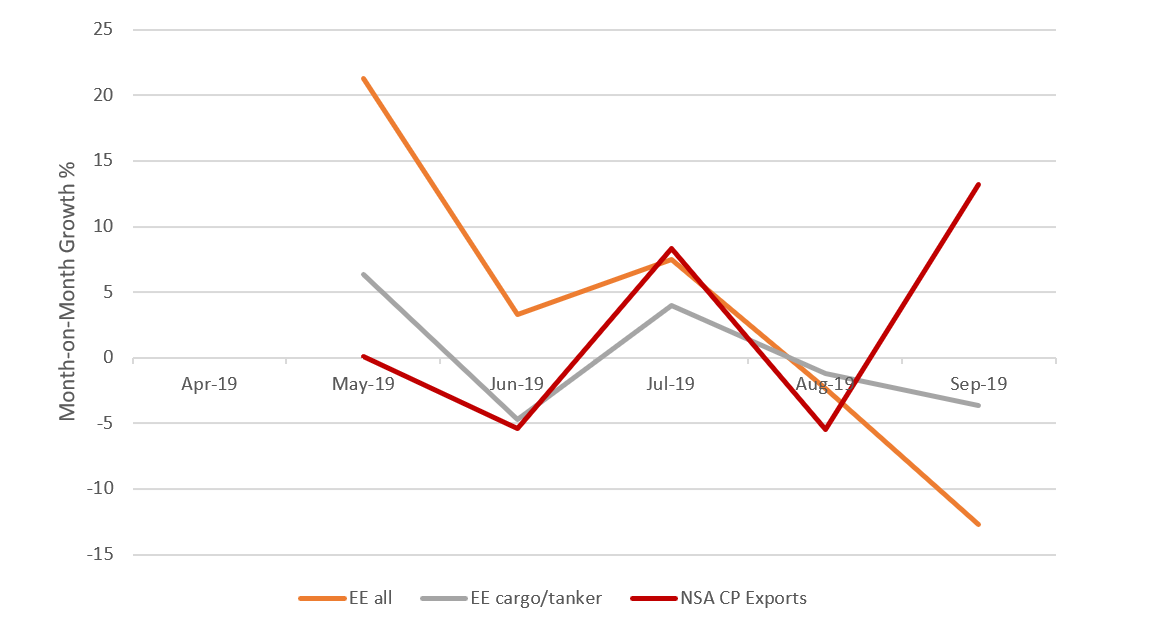
Figure 9: Month-on-month growth rates of the number of visits indicators for exactEarth all ships (EE all) and exactEarth cargo ships and tankers (EE cargo/tanker), non-seasonally adjusted (NSA), compared with current price (CP), NSA UK imports of goods (source: ONS)
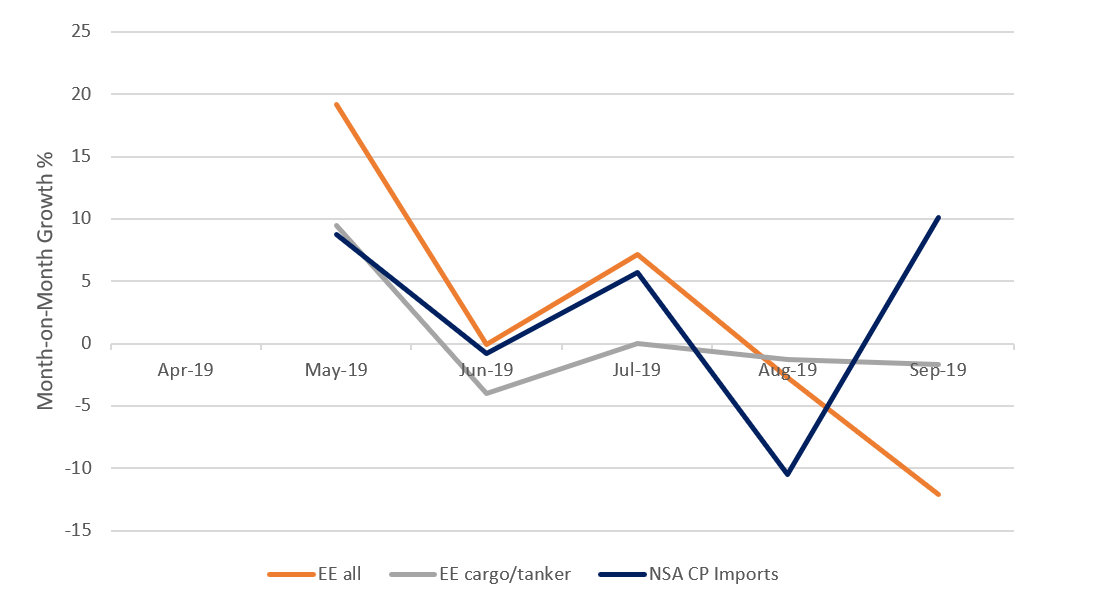
Figure 10: Month-on-month growth rates of the number of visits indicators for exactEarth all ships (EE all) and exactEarth cargo ships and tankers (EE cargo/tanker), non-seasonally adjusted (NSA), compared with current price (CP), NSA UK exports of goods (source: ONS)
4.2 The weekly indicators
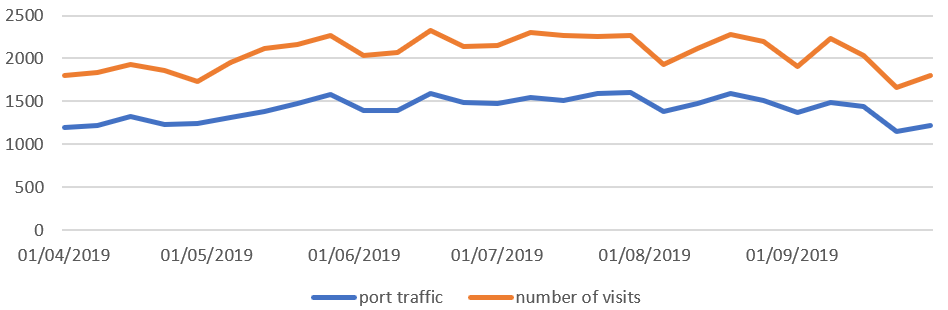
Figure 11 shows the weekly all ships indicators for port traffic and number of visits. As expected, the number of visits is higher than the number of unique visits that the port traffic indicator measures. However, at the weekly frequency, this difference is relatively smaller than for the monthly indicators, suggesting that ships do not, on the whole, visit the same UK port more than once a week.
Figure 11: weekly time series for the exactEarth all ships port traffic and number of visits indicators, non-seasonally adjusted (NSA)
4.3 Indicators by port
We have constructed indicators for 13 UK ports: Grimsby and Immingham, London, Liverpool, Southampton, Milford Haven, Felixstowe, Tees and Hartlepool, Forth, Dover, Belfast, Larne, Holyhead and Warrenpoint, and an all-ports indicator, which is the sum of those ports.
Figures 12 and 13 show the indicators broken down by UK port. Grimsby and Immingham, London, Liverpool and Southampton all have high levels of activity by cargo ships and tankers. Interestingly, although the Port of Dover is identified in the Department for Transport’s UK Port Freight Statistics 2018 as the port with by far the largest number of cargo vessel arrivals in the UK, this is not reflected in the cargo ships and tankers indicator. The same statistical release also shows that 99% of freight shipping at Dover is by Ro-Ro vessels.
As discussed in Section 2.1, the cargo and tankers indicator may be lower than expected because many Ro-Ro ships are classified in the Automatic Identification System (AIS) data as Ro-Ro/Passengers, which are not included in our indicator although it is likely they also carry road freight in addition to passengers. On average, between April and September 2019, nearly one-third of AIS messages from ships arriving at Dover were classified as passenger ships, and just under 5% as cargo ships or tankers. This issue may also affect the indicators for other ports, although not to the same extent. We welcome feedback on this point.
Figure 12: Average monthly totals of port traffic by port for the OrbComm, exactEarth all ships (EE all) and exactEarth cargo ships and tankers (EE cargo/tanker), non-seasonally adjusted indicators between April and August 2019
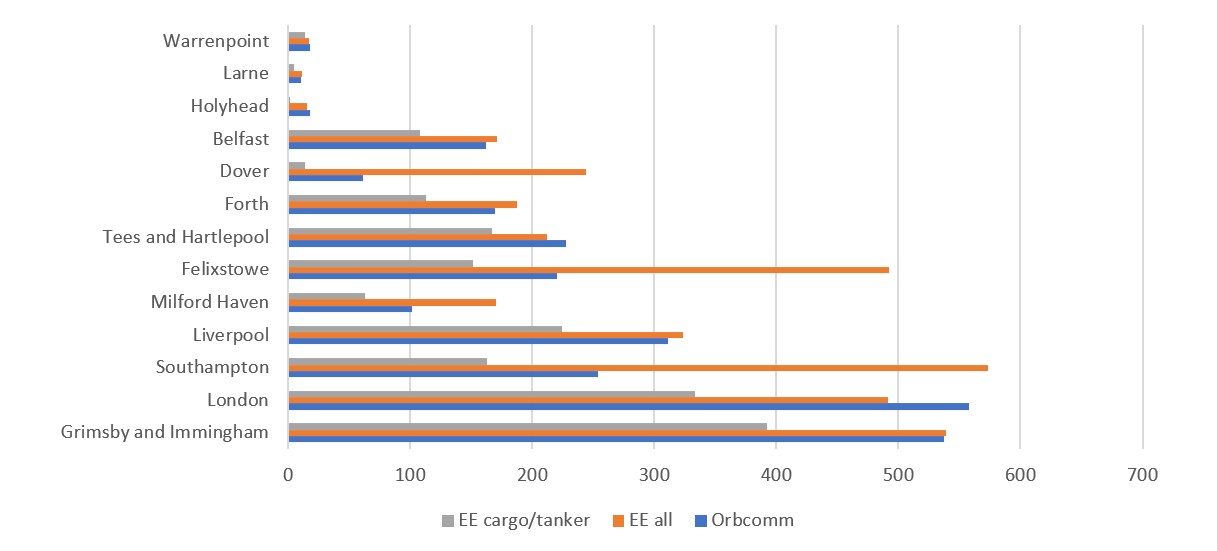
Figure 13: Average monthly totals of number of visits by port for the OrbComm, exactEarth all ships (EE all) and exactEarth cargo ships and tankers (EE cargo/tanker), non-seasonally adjusted indicators between April and August 2019
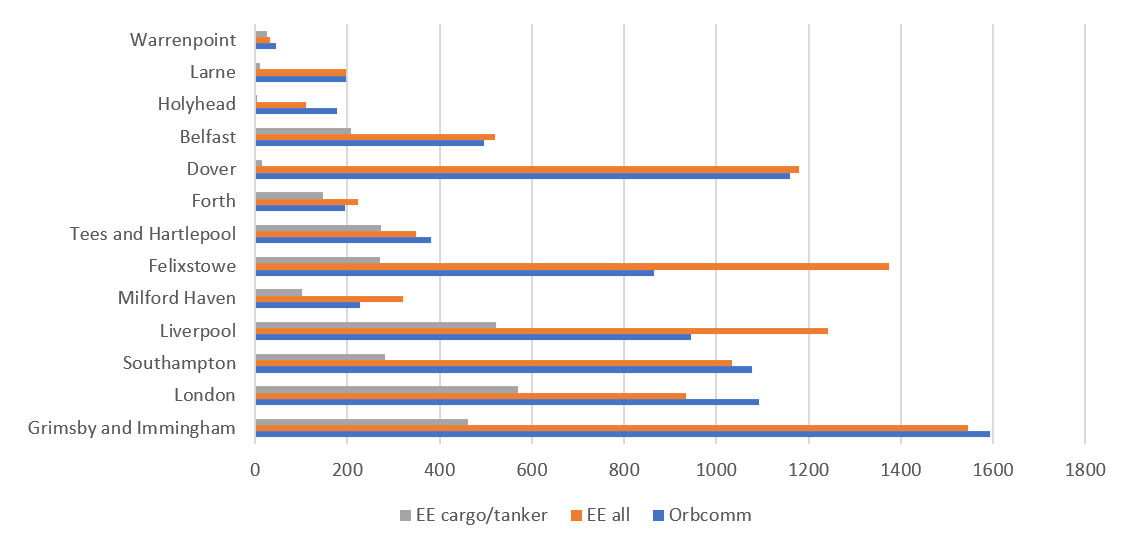
Figure 14 shows how proportion of the total number of visits by cargo ships and tankers for the major ports of Grimsby and Immingham, London, Liverpool, Dover, Southampton, Tees and Hartlepool, and Felixstowe changes by month for the new exactEarth indicators. These data are not seasonally adjusted, so we caution that the month-to-month changes should not be over-interpreted. We require additional data points to fully understand the series, but add this figure to illustrate the kinds of analyses possible with these data.
Figure 14: Proportion of the number of ships visits, for cargo ships and tankers, exactEarth, non-seasonally adjusted, by month, for the ports of Grimsby and Immingham, London, Liverpool, Dover, Southampton, Tees and Hartlepool, and Felixstowe.
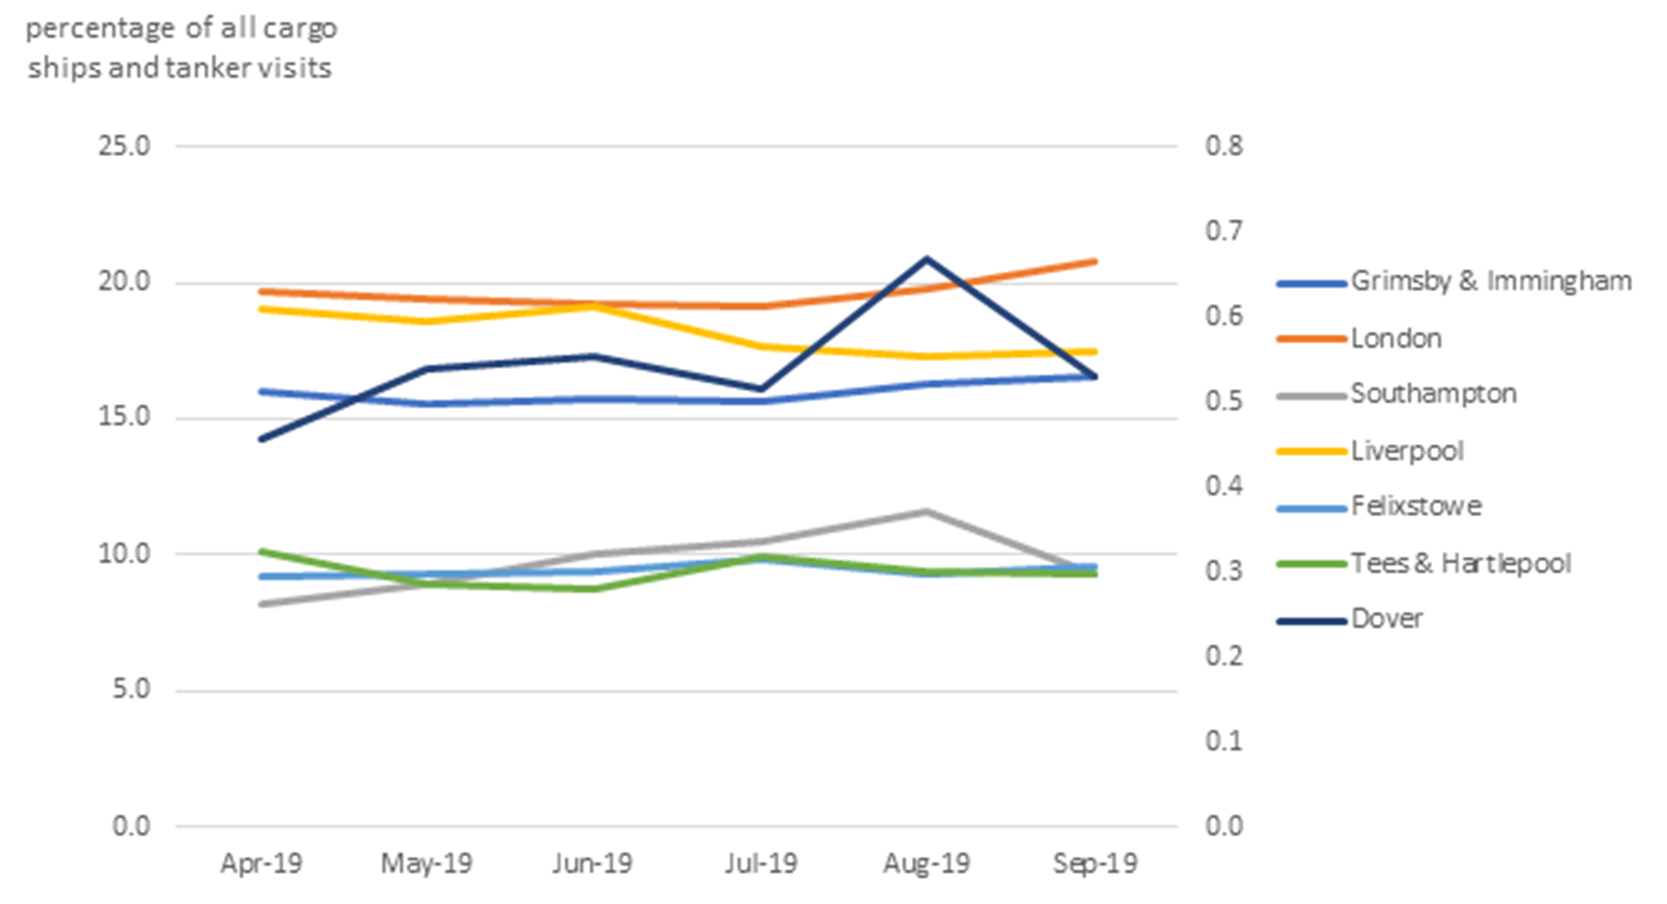
Note that all ports except Dover are on the left-hand axis, and Dover is on the right-hand axis.
5. Conclusions
We have constructed new weekly indicators of the activity of cargo ships and tankers, which will be made available with a four-week lag between the reference period and publication. It seems likely we are missing some freight-carrying Ro-Ro ships in these indicators, especially for the Port of Dover, and future work will explore this further.
The availability of weekly data gives us the opportunity to provide timely indicators of shipping activity. While early results are encouraging, we require additional data points to fully evaluate the relationship between this information and the official UK trade in goods statistics. We do not as yet recommend using them as published as a predictor of official trade in goods statistics.
We make these data available at an early stage of development and invite feedback and commentary on their further development.
The data for the new indicators which accompany this article, for the time period April 2019 to September 2019, can be found in the Faster indicators of UK economic activity: more timely and relevant shipping indicators dataset.