Mapping the urban forest
Urban forest refers to the trees and vegetation present in the streets, parks, gardens, balconies and even green roofs within our towns and cities.
Trees in particular are known to provide a wide variety of social, environmental and economic benefits to the inhabitants of a city. For example, the presence of trees can improve social cohesion, encourage exercise, filter air, reduce flooding, provide habitat for wildlife and even stimulate the local economy.
By 2050, two thirds of the global population are expected to live in urban areas, so understanding the extent of the urban forest is an important issue.
Since the start of 2017, the Data Science Campus in collaboration with ONS’s Natural Capital Accounting team have been investigating the potential to form a nation-wide tree dataset, describing the publicly accessible trees surrounding the urban road network.
The project, which leverages machine-learning expertise within the campus, is part of our Rural and Urban research sub-theme, which in turn, is in line with our principle theme of delivering data science for public good.
From the perspective of the ONS Natural Capital Accounting team, the project is part of a more general initiative to account for and monitor the condition of the nation’s natural capital, which, in addition to trees, includes water, subterranean and other natural assets. The higher-level aim is to improve the representation of natural resources in decision-making processes.
Our Approach
To date, the most reliable method for counting and classifying trees has involved large-scale, manual tree census efforts, which have been conducted by local authorities or involve volunteer-based efforts.
While human cataloguing of trees is the most reliable means of data acquisition, it does, of course, require significant effort, planning and coordination. An automated approach could include the benefits of continuous monitoring, scalability, and could also involve a consistent, repeatable methodology so that meaningful comparisons may be made.
Automated approaches have typically made use of satellite imagery and even Light Detection and Ranging (LIDAR) data to either identify and count individual trees or to derive a percentage canopy cover, which can be immediately useful for comparative studies and indeed urban planning.
While existing tree-counting efforts in the UK have made extensive use of satellite imagery, the accuracy of automated tree-counting methods diminishes in the presence of tall buildings and complex scenery, which is typically the norm in an urban environment.
For this reason, the Data Science Campus has been prototyping the use of street-level imagery, starting with Google Street View, as a means to augment satellite-based methods. The approach could be applied to other potential street-level data sources such as imagery captured by citizen scientists, transport-mounted cameras, or in the future, continuous monitoring by camera-equipped drones.
The main advantage of using images acquired at street level is that the data reflects the point of view of a pedestrian. It includes only publicly accessible places and, in addition to individual tree counting, presents the opportunity to perform species classification and perhaps even some degree of health monitoring, which may be difficult from a bird’s-eye view.
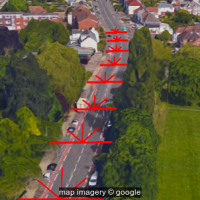
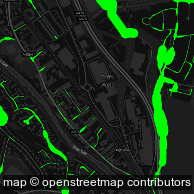
Our prototype makes use of road-network data obtained from the Open Street Map project in combination with street-view images sampled at equal distances along the road network.
At each sample point, a number of images are obtained from the left and right sides. A montage is then created, which is used as input to our foliage-quantification method.
Our first approach measures the amount of green present in the scene and assigns a measure of “greenness” to each point along the road. This technique, inspired by precision agriculture, is common in satellite imagery analysis. However, it fails to distinguish between green trees, grass or indeed a green car. Moreover, the approach is not robust to the inherent seasonality of trees, or the fact that some tree species are red, for example, the maple tree or red oak.
Consequently, we are developing a foliage-detection method utilising techniques based on the current state-of-the-art, in-image processing and deep learning: Convolutional Neural Networks. Our objective is to identify the presence of trees in a scene, regardless of the time of year or the leaf colour.
Our initial results are promising, and beyond foliage detection, we hope to extend the model to include automated species classification and disease monitoring. Species classification is important since a diverse urban forest offers higher resilience to disease and can harbour a more diverse range of wildlife.
In addition to counting and classifying urban trees, the methodology can be re-used in other domains. For example, the method may be used to classify other objects such as cars, to count people or to monitor public infrastructure.
If you are interested in learning more about this project or would like to discuss ideas for future research then you can get in touch via this blog, email or twitter.
2 comments on “Mapping the urban forest”
Comments are closed.
New York has already done this, and its interactive map is already up and running. It’s brilliant.
https://tree-map.nycgovparks.org/
It wouldn’t work in Luton, because it would just help the council find more trees to cut down as a nuisance to the cars.
Hi. Yes, New York have an amazing tree mapping project. This is a nice visualisation of their dataset: http://jillhubley.com/project/nyctrees/