The use of microdata for firm-level analysis of preference tariff utilisation in the UK: technical report

Updated on the 09/10/2025
Overview
Understanding how trade agreements are used, and how to encourage the use of these agreements, has long been an interest of policymakers. Preferential trade agreements (PTAs) are commonly used by countries to promote international trade. However, a small but growing literature on this topic largely uses aggregate data to analyse PTAs. While existing empirical evidence can provide a general picture on the use of these agreements, it fails to provide knowledge of how the use of PTAs varies across firms and how the pattern of such usage changes over time.
Transactional-level and firm-level data with long time-series coverage are rarely used to analyse preference utilisation rates (PURs). A previous analysis conducted by the Data Science Campus and the Department for International Trade helped to fill a gap in existing literature by using firm-level data from business register and transactional-level customs data to analyse the uptake of preferential tariffs by UK importers from non-European Union (EU) countries and established a longer time series that includes the period from 2009 to 2019. Our analysis “Use of preferential tariffs by UK businesses for imports of goods: 2012 to 2023” improves the previous analysis to include additional variables and time period, as well as more non-EU countries and EU countries. The technical report has been updated to reflect the updates to our methodology and data sources.
In this technical report, we go behind our analysis on the use of microdata for the examination of preference tariff utilisation and take a deep dive into challenges of drawing together new, administrative data sources to answer policy relevant questions. We also explain the reasons to use firm-level and transactional-level data to analyse PURs and the strengths and limitations of our methods and analysis.
Important points
- We derived a database containing transactions level information on imported goods linked to businesses and tariffs information by linking the Inter-Departmental Business Register (IDBR), Trade in Goods and International Trade Centre Market Access Map data. This provides near population coverage of importing UK firms.
- Tariff data is complex; different tariffs may apply depending on factors such as the weight of goods and quotas. We are unable to account for all these factors.
- Data sources for international trade in goods with EU Member States changed following the UK departure from the EU. Strong caution is advised when making comparisons between 2022 and earlier years.
- Due to data availability, from 2022 we were unable to match all product codes at the same number of digits between Trade in Goods and tariff data. This influences accuracy of preference eligible trade estimates.
- It is possible for some transactions to be incorrectly identified as eligible/not eligible for preferential tariffs during a certain year.
- The number of countries in our dataset increases as new Preferential Tariffs Agreements are introduced at different points of time.
- Methods are under review and development. Results are experimental and might be subject to revisions.
Background
International trade plays an important role in the UK economy. Total UK trade in goods exports (excluding precious metal) at current prices were around £378 billion in 2023, of which £192 billion was from non-EU countries, while total UK trade in goods imports (excluding precious metal) at current prices were around £604 billion in 2023, of which circa £281 billion was from non-EU countries, as in UK trade: goods and services data set.
Using data on Gross Domestic Product (GDP) at market prices we find thatUK exports of goods as a percentage of GDP was 13.9% in 2023, while UK imports of goods as a percentage of GDP was 22.3% in 2023. These figures show the importance of trade as an economic activity and how increases and decreases in trade activity are likely to have a large impact on the economy.
Palmou and Jones (2025) find that firms in Great Britain that exported or imported goods or services were 35% more productive than their non trading counterparts, after controlling for differences in industry, age, employment and foreign ownership status. It is therefore essential for policymakers to understand what can help to encourage trade activities, how current free trade agreements (FTAs) perform, and how the economic benefits of FTAs could be achieved.
Free trade, or the elimination of trade barriers, can offer economic benefits. These include, for example, more exports, economies of scale, lower prices, and greater choice of products. PTAs enable countries to grant preferential tariffs to imports from their trading partners. Through PTAs, countries can apply tariffs lower than their most favoured nation (MFN) rates for trade with partner countries on certain products.
These agreements are usually reciprocal in a customs union, which means all parties agree to give each other the benefits of lower tariffs. PTAs can also be offered to a trading partner unilaterally rather than on a reciprocal term. The General System of Preferences (GSP) scheme is an example in which developed countries offer preferential tariffs on imports from developing countries. The scheme was replaced in the UK by the Developing Countries Trading Scheme (DCTS) on 19th June 2023.
By analysing preference tariff utilisation, policymakers can:
- better understand the effectiveness of trade agreements
- better design policy and operational actions to improve preference utilisation rates (PURs) to ensure UK businesses maximise trade agreement benefits
- learn lessons for developing and implementing new free trade agreements (FTAs) and improve business uptake of preferential trade tariffs accordingly
The full economic benefits of trade agreements can only be achieved if firms make use of preferential tariffs. However, preference utilisation rates show that businesses do not always use lower available tariffs.
The PUR measures the extent to which preferential tariffs, rather than MFN tariffs, are claimed for preference-eligible dutiable trades. We calculate PURs as the total transaction value of preferential imports of goods by UK businesses divided by the total transaction value of preference-eligible imports of goods by UK businesses.
Information about firm characteristics can either be obtained from surveys or from a business register. Our analysis uses the latter because it has a near-population coverage of UK firms. By linking a business register to transactional-level customs data, we obtain a representative picture of UK traders’ decisions to use preferential tariffs.
As pointed out in National Board of Trade Sweden (2019), details of individual trade transactions are usually hidden in aggregate trade data or trade statistics, whereas transactional-level data provide details of individual transactions or shipments that were declared to customs, the transaction value, frequency, traders’ identifier, and product category.
Our data improvement as compared with existing literature
A combined use of firm-level and transactional-level data to analyse PURs is rare in the growing literature on PURs. Transactional-level administrative data are usually not publicly available and access to them often requires special permission from authorities.
Many existing studies in this topic use aggregate data for analysis. For example, Ando and Urata (2018) use the Trade Compass Database of Deloitte to compute free trade agreement (FTA) utilisation rates as share of imports under FTA schemes in total imports at product level and obtain preference margin as the difference between FTA tariffs and MFN tariffs.
Other studies on the utilisation of trade agreements use data from surveys that are based on defined samples. For example, PricewaterhouseCoopers (PWC) (2018) has conducted a business survey that asks Australian firms about their experience with using FTAs, particularly with China, South Korea, and Japan.
Takahashi and Urata (2008) base their analysis on data from a survey in which 469 firms were asked if they have used FTAs, the reasons for not using them, their experience in the ease of using FTAs, and the impact of FTAs on their sales, costs, and profits.
However, the use of transactional-level data is still quite rare in existing PURs literature. Albert and Nilsson (2016) use transactional-level data to study utilisation of preferential rates. They estimated the fixed-cost thresholds of using preferential tariffs using transactional-level data for EU exports for 2011 obtained from Iceland’s custom authorities.
National Board of Trade Sweden (2019) use detailed-level administrative data, merged with company-level data, to examine the use of the EU’s FTAs in trade transactions with South Korea by Swedish importers in 2016. Their report gives a thorough analysis of how the use of preferential tariffs varies across firm characteristics.
They investigate the importance of tariff preference on total imports; examine PURs across firms, products, and import modes; and obtain transaction values and preference margin by firm size and product. They also use a logit regression to examine the relationship between utilisation of tariff preferences and potential duty saving.
Our study makes two improvements to existing PURs analysis. First, we draw our insights with the aid of data science methods that combine statistical and machine learning techniques. Secondly, we also make improvements in the use of data, which are:
- combining transaction-level custom data with data stored on the UK business register, enabling us to provide a more detailed examination of which importing firm characteristics play an important role in the firms’ uptake of preferential tariffs with a near population coverage
- covering import transactions for over 10 years in our study, allowing us to establish long time series to look at the patterns in PURs over time (with caution)
In the remaining part of this technical report, we will provide an overview of the microdata available in the UK for our analysis of PURs and the characteristics of these data. We will then discuss the challenges in using these data for our analysis.
Data for firm-level analysis of preferential tariff utilisation in the UK
To explore the uptake of preferential tariffs by UK businesses for imports of goods, we derived a database containing transactions level information on imported goods linked to businesses and tariff information.
Our methods involve linking Trade in Goods (TiG) data on imports to the IDBR to enrich the data with business-level characteristics of importing firms. We then identify the transactions eligible for preferential tariffs, as agreed in Preferential Trade Agreements by linking our data set to tariff information from the International Trade Centre’s Market Access Map (https://www.macmap.org/).
We exclude Generalised System of Preferences (GSP) and Developing Countries Trading Scheme (DCTS) from our analysis.
We identify preference-eligible imports as those where a preferential rate is available which is lower than the default MFN rate and exclude those where MFN is equal to zero. We removed transactions with values of less than £135 as they are generally exempt from custom duties and only retain those to which specific custom procedure codes apply, for example direct imports and custom warehousing (only for goods for free circulation). We also exclude monetary and non-monetary gold and diamonds.
The resulting database is a transaction-level dataset containing imports by UK businesses that are preference-eligible and imports that used preferential tariffs.
We conduct our analysis based on the country of origin of imports. The country of origin (COO) is the country in which the goods were originally produced or manufactured. Country of origin can be different from country of dispatch if goods were sold to another country before delivery to the UK.
The method we use for identifying imports eligible for preferential tariff is less sophisticated than the method used by His Majesties Revenues and Customs (HMRC) in their construction of import data by preference due to differences in the data sources used to identify trade eligible for preferential tariffs. In particular, we use tariff data available on a yearly basis and filter out transactions from non-EU countries which were before the starting date of the preferential trade agreement based on additional data from DBT. We are also unable to account for the impact of quotas on preference eligible trade.
It is possible for some transactions to be incorrectly identified as eligible/not eligible for preferential tariffs during a certain year.
Trade in goods
UK trade in goods (TiG) data are collected by HMRC for administration and tax purposes. The TiG data cover a large proportion of UK trade in goods transactions and are used by HMRC for two National Statistic series: Overseas Trade Statistics (OTS) and Regional Trade Statistics (RTS). They are also used by the Office for National Statistics (ONS) as one of the main sources for international trade in goods statistics. For more information on TiG data sources see HMRC trade methodology.
Data sources for international trade in goods with EU Member States changed following the UK departure from the EU. For imports, Intrastat statistical survey covers good movements between Northern Ireland and the European Union since 1 January 2022, while TiG data for imports from the EU to Great Britain (Scotland, England and Wales) are derived using custom import declarations. Although the UK left the EU on 31st January 2020, the Intrastat survey continued for the UK imports from the EU in 2021. This was to mitigate the effect of staged custom controls and to comply with the Northen Ireland Protocol. Changes to data sources for exports to the EU followed a different timeline (see HMRC trade methodology for more information). For our analysis, we use data on imports from the EU member states in 2022 and 2023 and exclude goods entering Northern Ireland from the EU.
For imports from non-EU countries, the source of information remains custom declarations. Custom declarations were mainly completed by businesses through the Custom Handling of Import and Export (CHIEF) system. However, in 2022 CHIEF was replaced by Custom Declaration Service (CDS) system for imports. It is possible that this change might have implications for the variables used in our analysis. Information on Custom Declaration Service is available here. From 2022, imports from Non-EU COO dispatched from EU countries became observable. Strong caution is advised when making comparisons between 2022 and earlier years.
The TiG data contain a rich set of information about each trade transaction that crosses the UK border. Such information includes country of dispatch and country of origin, value of trade, commodity type as given by the commodity code, trader identifier, custom procedure code, and rate of duty being claimed. Rate of duty being claimed is a major variable in the analysis of preferential tariff utilisation as it indicates whether a preferential tariff is being claimed for the transaction.
We removed transactions with values of less than £135 as they are generally exempt from custom duties and only retain those to which specific custom procedure codes apply, for example direct imports and custom warehousing (only for goods for free circulation). We also exclude monetary and non-monetary gold and diamonds
While the TiG data contain information about trade transactions and information on whether preference tariffs have been claimed, they do not provide information about firm characteristics such as geographical location, turnover, and employment. Using these data alone do not allow us to examine how the uptake of preferential tariffs varies across different firms. We link TiG data on imports to the IDBR to enrich the data with business-level characteristics of importing firms.
The Inter-Departmental Business Register
The Inter-Departmental Business Register (IDBR) was developed in 1995 to replace the Value Added Tax (VAT)-based register of the Central Statistical Office and Pay As You Earn (PAYE)-based register of the employment departments. See Review of the Inter-Departmental Business Register (PDF, 745KB) for more details.
The IDBR is a comprehensive list of UK businesses used by government for statistical purposes. The main two sources of input are Value Added Tax (VAT) and Pay As You Earn (PAYE) records from HMRC, with additional information derived from other sources, such as Companies House, Dunn and Bradstreet and ONS business surveys. The IDBR covers around 2.7 million businesses in all sectors of the economy but can exclude businesses below the thresholds of the two main data sources.
The register holds business information such as names, addresses, Standard Industrial Classification (SIC), employment, turnover, ownership, and legal status. A firm can be present on the IDBR as different business units.
The first type of business units is called statistical units, which consist of:
- an enterprise group, which is a group of legal units (enterprises) under common ownership
- an enterprise, which is the smallest combination of legal units, generally based on VAT and/or PAYE records, with a certain degree of autonomy in decision-making; it can carry out one or more activities at one or more locations, and it can also be a sole legal unit, in other words, it does not belong to an enterprise group
- a local unit, which is part of an enterprise located in a geographically identified place where all or part of the economic activity of the enterprise is carried out
The second type of business units is called administrative units, which consist of:
- VAT unit; an enterprise can have one or multiple VAT units. In the IDBR, these VAT units are classified into different types, according to the VAT reporting arrangement adopted by an enterprise
- PAYE unit; an enterprise can have one or multiple PAYE units
The third type of business unit is called observation units, which are known as the reporting units. A reporting unit holds the mailing address to which official survey questionnaires are sent. In many cases, a reporting unit and an enterprise are the same in scope — this is true when a business has a simple structure on the IDBR. However, a large enterprise could arrange with the ONS to have separate reporting units.
This is either to alleviate reporting burden or because the enterprise is involved in multiple business activities that belong to different industries according to the Standard Industrial Classification (SIC). For example, a manufacturing enterprise that also involves retail could have a separate reporting unit for its retail division to answer surveys that are specific for retailers.
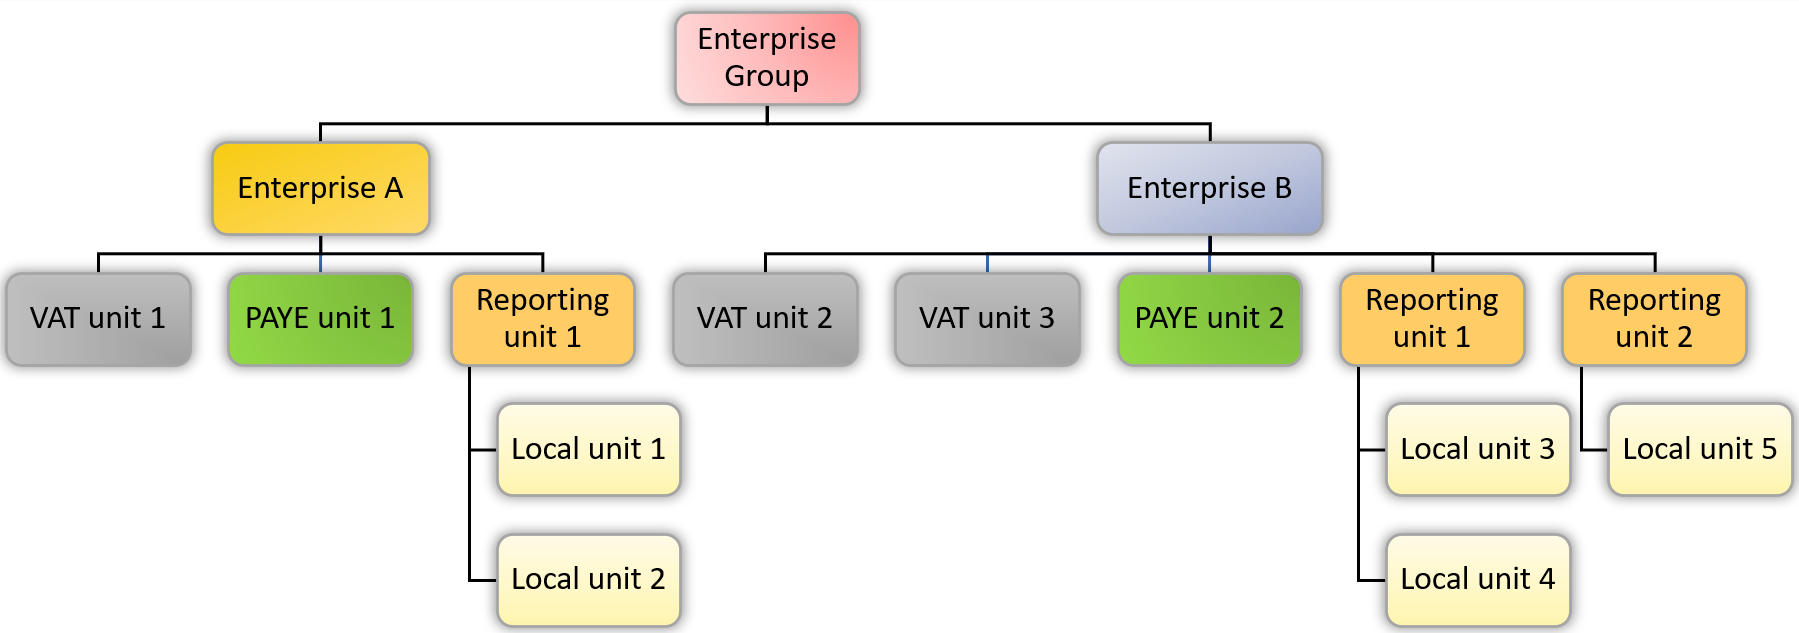
Figures 1 and 2 display examples of a simple and a complex firm in terms of IDBR units. Different information is stored in the IDBR under each of these units, in the form of data tables. These data tables are snapshot data taken from the register at a particular point in time. Those firms with a complex structure as in Figure 2 are usually large firms that are involved in multiple businesses activities. See also Appendix 1 in Lui, Black, Lavendero-Mason and Shaft (2020) (PDF 2367KB) for discussion about the IDBR.
Figure 1: An example of a simple firm on the IDBR
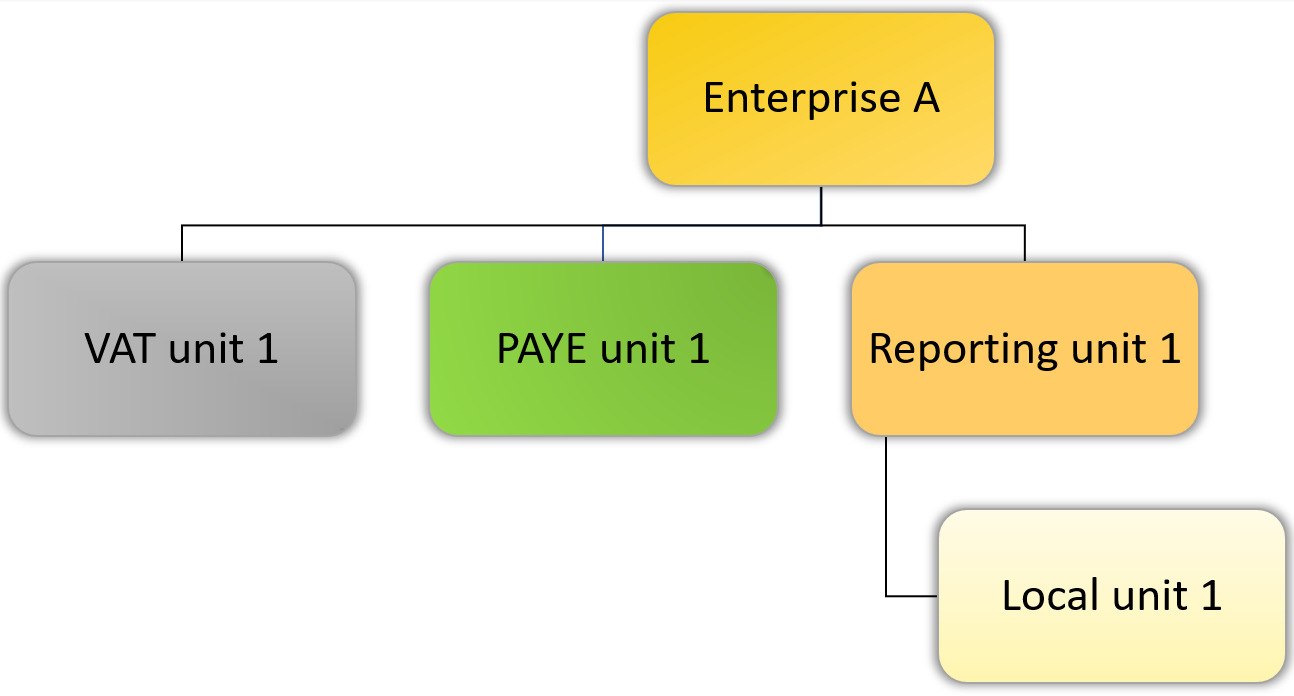
Figure 2: An example of a complex business on the IDBR
Important information required for firm-level PURs analysis
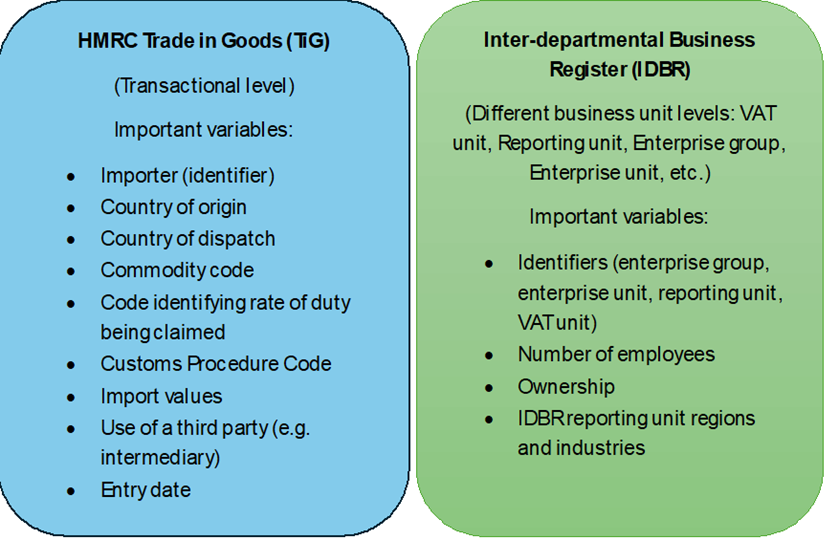
While TiG data provide details of individual trade transactions, the IDBR contains a rich set of information about a firm, and this information is stored in separate data tables of its IDBR units. For our firm-level analysis, we use the information stored on the enterprise group, enterprise, reporting unit, and VAT units. Figure 3 summarises the important information required from the two datasets for our study.
Figure 3: Important information in the TiG and IDBR datasets for firm-level PURs analysis
The TiG data provide us with information about trade transactions declared by the VAT trader. The IDBR provides us with information about businesses. Our project makes use of the data about firm characteristics stored in the IDBR enterprise group, enterprise, reporting unit and VAT unit tables. We produce a linked IDBR dataset to gather details about firms stored in its separate business units using different IDBR identifiers. The TiG dataset can be merged with the linked IDBR dataset using the VAT reference number as the common identifier.
Construction of the IDBR-TiG linked dataset
Our firm-level analysis focuses on the uptake of preference tariffs by UK businesses for imports of goods from a set of non-EU countries (2012-2023) and EU countries (2022-2023). We make use of the IDBR and TiG administrative datasets. A linked IDBR-TIG dataset is constructed to investigate how different firm characteristics relate to businesses’ uptake of preference tariffs on import transactions.
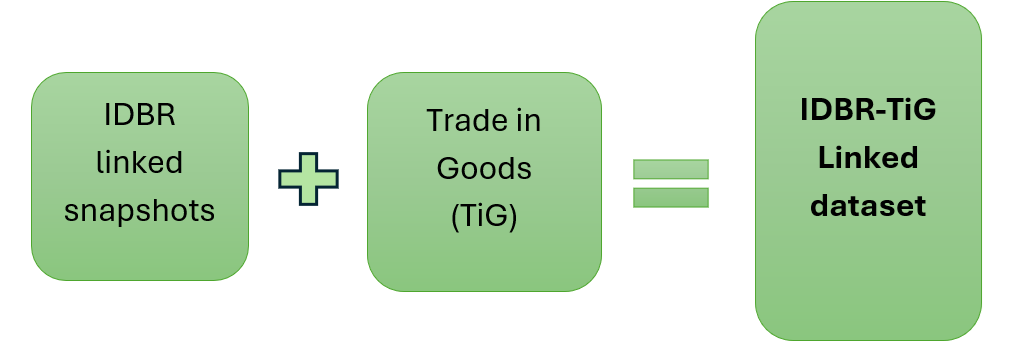
Figure 4 summarises the construction of the IDBR-TiG linked dataset, we start the procedure by first combining the IDBR enterprise group, enterprise, reporting unit and VAT unit data tables using the enterprise reference number as a common identifier to create a linked IDBR dataset. We then merge the TiG data to this linked dataset via VAT reference number.
Figure 4: Construction of the IDBR-TiG linked dataset
Combining these two datasets would enable us to conduct detailed-level analysis. However, the linking process is not a straightforward exercise because of some data limitations. To establish an appropriate strategy to combine these data, it is crucial to understand these limitations. Moreover, a good knowledge of these issues and the challenges involved in using these data for firm-level analysis also enable us to understand the caveats to our findings.
As discussed by Black et al (2018), a proportion of trade in goods cannot be mapped directly to an enterprise on the IDBR, this is due to multiple reasons, such as:
- trade in commodities such as gas and electricity are gathered from administrative sources rather than trade in goods declarations
- some trade is undertaken by businesses which are not registered for VAT
- some trades are reported by foreign companies registered for VAT in another EU country, using an Economic Operator Registration and Identification (EORI) number, rather than a VAT number
- some unmatched trade can also be accounted for by trade in goods declarations which contain unusual VAT reference numbers that cannot be matched to the IDBR
Retaining only TiG records that reflect the above possibilities, we achieve a matching rate between IDBR and TiG for the value of imports of circa 97% on average.
In the next section, we discuss the challenges we face in using these data.
Internation Centre Trade Market Access Map
We need to identify the import transactions from the IDBR-TIG linked data that are eligible for preferential tariffs, as these are required for the estimation of preference utilisation rates, based on the definition we gave earlier. We achieve this by using the International Trade Centre’s Market Access Map (MAcMap).
MAcMap is a database that provides information such as customs tariffs, tariff rate quotas, regulatory requirements and preferential tariffs that apply for trade with each partner country for each product. It also provides an estimate of ad valorem equivalent for complex tariffs. We use this information to identify the tariff regime that applies for imports of products from each partner country and derive potential duty savings associated with the use of preferential tariffs. MAcMap data are available on a yearly basis and tariff data are updated once a year, unless updates are needed.
We linked the IDBR-TIG database to MAcMap by matching the commodity code, country of origin and year from IDBR-TIG to the product code, country of origin and year from MAcMap at the 10-digit commodity level. Due to data availability, from 2022 we were unable to match all product codes at the same number of digits between TiG and MAcMAp. We aggregated data at 8 digits product code by tariff regime and derived average ad valorem equivalent before proceeding to linking IDBR-TiG and MAcMap. For previous years, we used 10 digits product code.
Then, we removed all transactions not eligible for preferential tariffs by dropping transactions that do not have a corresponding preferential tariff rate in MAcMap based on the year, country of origin and commodity code.
The challenges in using UK microdata to analyse PURs
The TiG data and the IDBR are commonly known as administrative data or administrative records. Administrative data are not designed for scientific research but are records created during some administrative operations. They can be used for statistical production, for example, the Overseas Trade in Goods Statistics published by HMRC.
The compilation of statistics based on administrative sources is increasingly common. For example, the HMRC VAT returns data have been used for the production of national accounts, including short-term indicators and for gross domestic product (GDP).
Administrative records are also used for other statistical operations, for example, the IDBR is the sampling frame of ONS business surveys. However, it is not until recent years that the use of administrative data for scientific research has become popular.
There are pros and cons of using administrative data for analysis, and there are also challenges involved (see Hand (2018) and Künn (2015) for a discussion of some of those issues). Access to administrative data usually requires special permission granted by official bodies. These data are not restricted by sample size and usually have population or near-population coverage.
Hence, they allow us to build a representative picture of an economy or of the entities in the economy (for example, businesses and individuals). However, administrative data are also subject to human errors or misreporting. Quite often, these errors are not easily identified, and it is very difficult to verify the accuracy of administrative data.
Challenge 1: The Rotterdam effect (or the transhipment effect)
The Rotterdam effect (also known as Rotterdam-Antwerp effect or transhipment effect) refers to the problem of misreporting trade when goods pass through major ports on their way to their final destinations. This problem distorts calculation of trade statistics.
Rotterdam and Antwerp are import hubs for trade from non-EU countries before it is routed to other EU destinations. Misreporting occurs when, for example, goods trade flowing from Africa to the UK stops at the Netherlands for a short period of time and is wrongly recorded as UK trade with the Netherlands.
The Rotterdam effect potentially affects the representativeness of any analysis using UK trade data, whether the focus is on imports from non-EU countries (underestimation) or imports from the EU (overestimation).
Developing methods to produce better estimates in the light of the Rotterdam effect is beyond the scope of our study. There are existing studies on developing methods to produce better estimates of the share of imports that are destined for re-export; see, for example, Lemmers and Wong (2019).
Challenge 2: Gathering relevant information for firm-level analysis is a challenging task
Firm-level analysis requires information stored in the different IDBR tables, and each of them is specific to a business unit of the same firm (enterprise group, enterprise, reporting unit, and VAT unit). Figures 1 and 2 illustrate how these different units of the same business relate.
It is important to note that not all identity links displayed in the two figures are directly observed. For example, there is no direct link between the VAT unit, through which the TiG data are linked to the IDBR to create a dataset for our analysis, and the reporting unit that contains certain firm-level information.
This is because, according to the IDBR structure, administrative units are directly related to or sit underneath the parent enterprise of their administrative headquarters, but they are not the part of the firm that is responsible for answering surveys.
Moreover, different information is stored in different IDBR tables that are specific to the business units. That is, not all firm-level information of interest to our analysis is stored in the data tables of a single IDBR business unit. This is mainly because of how information is stored on the IDBR and from which channel the information is collected.
For example, details about location and employment are not stored in the IDBR VAT data tables. While the IDBR reporting unit data tables contain reporting unit-level geographical information. Besides, information on the IDBR is not real-time or near real-time, even though administrative information is usually updated on an as-and-when basis. There is often a time lag in the arrival of information.
Pooling information recorded in different business units within a firm is a challenging exercise. It requires us to first construct an IDBR-linked dataset to combine the business units to re-establish the “lost” identity links within the same firms. Once this is done, we can then match the TiG data to the linked IDBR dataset.
Pooling data stored in different IDBR business units also requires us to understand the limitations of the information derived from these different business units. For example, whether this information applies to the whole firm or only part of the firm. This concern arises as not all firms on the register have the simple structures shown in Figure 1. Many firms on the register have complex structures similar to Figure 2, with multiple business units at levels below the enterprise. We will explain in more detail the complications this causes.
Challenge 3: The definition of a “firm” can vary
The concept of “firm” appears to be quite elastic among existing firm-level analysis using the IDBR. For example, Lui, Black, Lavendero-Mason and Shaft (2020) (PDF 2367KB) study business dynamism at the enterprise level, while the ONS regional productivity analysis uses the Annual Business Survey local unit dataset. Hence, a “firm” in an existing study could refer to a local unit, a reporting unit, an enterprise, or a VAT unit. It depends on which IDBR unit(s) the study draws its data from.
This is not an issue if the analysis only requires information related to one IDBR business unit, and if an analysis focuses on firms with simple structures (as depicted in Figure 1). In this case, an enterprise has only one reporting unit, one local unit, one VAT unit, and one PAYE unit. Therefore, information stored in any of these data tables is applicable to the whole firm. However, many firms have complex structures like the one in Figure 2.
In such cases, values directly related to one of the firm’s reporting units or one of its VAT units are not applicable to the entire firm. An import transaction in the TiG data refers to a VAT trader rather than the whole firm, but firm characteristics derived from the IDBR do not always refer to a specific VAT trader.
Our study adopts the assumption that an enterprise (headquarter) is the unit that makes the decision to trade. Therefore, when measuring firm-level characteristics, we prefer information, such as employment, region, and turnover, that is measured at the enterprise level. However, as previously mentioned this is not always possible. We do not conduct any apportionment for our analysis and use the highest level of business units available.
We link the various IDBR tables snapshots to reconstruct firms’ structure and derive a set of business characteristics at either enterprise or enterprise group level (depending on whether an enterprise is part of a group or not), these include business size (defined by number of employees), location of importing business, firms’ turnover and business ultimate controlling parent company status (foreign or domestic). Information on business regional location is available at reporting unit level, and an enterprise might have multiple reporting units (and local units) situated in different parts of the UK. We assign to the enterprise/enterprise group the location of the reporting unit with the largest number of employees. This means that results derived from regional information are subject to further uncertainty and are indicative. Turnover and number of employees are available at both enterprise and enterprise group levels.
Turnover values are currently stored in different IDBR unit tables. The source of such values in the enterprise and reporting unit data table are mainly from the Annual Business Survey (ABS) and HMRC VAT source if the firms are not sampled.
The source of the turnover values stored in the IDBR VAT data tables are mainly from the HMRC VAT returns. Data from HMRC VAT returns are usually a preferred option over data from surveys as the former are more up to date and provide a consistent source of data for all firms. However, as well as having complex business structures, some firms also have complex VAT reporting structures.
A complex VAT reporting structure is commonly observed for those enterprises that participate in multiple business activities. There are usually four different types of VAT reporting arrangements.
Type 1: An enterprise has one or multiple standard VAT units. Each of these units reports turnover for the enterprise.
Type 2: An enterprise is a member of a VAT group; that is, multiple enterprises share common VAT registration. A VAT group contains a representative VAT unit and some non-representative VAT units. Only the representative VAT unit reports for all the enterprises in the group.
Type 3: An enterprise has divisional VAT units. These VAT units could be found in a large firm that carries out its businesses through a number of divisions. These VAT units share the same Companies House number and hence should not be treated as individual VAT traders.
Type 4: An enterprise has standard VAT unit(s) and, at the same time, belongs to a VAT group.
The VAT structure might also influence the reconstruction of the business as we link IDBR and TiG using the VAT reference number. The VAT reference number in the IDBR has 12 digits with the last 3 digits constituting the sub VAT number (SVN) that is used to distinguish the representative VAT unit from the non-representative ones. However, VAT traders in the TiG data are only identified by 9-digit VAT reference numbers. This requires us to convert the 12-digit VAT reference in the IDBR data tables prior to merging the register with the TiG data.
Establishing a strategy to obtaining enterprise-level turnover arrangements from VAT turnover information is beyond the scope of our analysis. Therefore, we take the decision to use turnover values from the IDBR enterprise and enterprise group data table, fully aware that these values are from a mix of survey and administrative sources.
Strengths and limitations
Strengths
• Linking transaction-level customs data to business register provides near population coverage of importing UK firms.
• It is possible to derive a detailed picture of the uptake of preferential tariffs across different types of importing UK businesses and other factors at different points of time.
Limitations
• Business structure is complex, and we have to make choices to derive business characteristics variables used in the analysis.
• Modelling was constrained by the availability of matched data across the three datasets.
• Part of the data for 2022 and 2023 is merged at different product level aggregation with tariff information due to data availability.
• Change to collection system in 2022 might influence the results.
• It is possible for some transactions to being incorrectly identified as eligible/not eligible for preferential tariffs during a certain year.
• We are unable to account for all the factors affecting tariffs.
• All regression results should be interpreted with caution.
• Results might change, depending on further methodology improvements and extension to additional data.
Conclusion
We explain in this technical report what drives us to study PURs using firm-level and transactional-level data, as well as the research questions these data allow us to answer that cannot be answered using aggregate data or statistics.
We provide a brief overview of the data used in existing empirical studies that are largely aggregated data and survey-based data. We then explain the data improvements we have made in our study, along with some of the challenges we have encountered in making those improvements.
We discuss the two UK administrative datasets, the trade in goods (TiG) and the Inter-Departmental Business Register (IDBR), used in our study. Our analysis focuses on UK import transactions form a set of non-EU and EU trading partners. We first construct an IDBR-linked dataset to bring together firm characteristics recorded in the data tables of each unit.
The variables we take from the IDBR indicate employment size, geographic location, turnover and ownership status. We then link the IDBR to TiG data and use certain variables in the TiG data that give us details about whether a transaction has claimed preferential tariffs, its importer as identified by Value Added Tax (VAT) reference number, its value, the custom procedure involved, and its country of origin and dispatch.
There are limitations of the two sets of administrative records that we use. These issues include, for example, misreporting in trade data, “lost” identity links among IDBR business units, updating issues of the IDBR, and complications arising because of complex business structures and complex VAT reporting arrangements. Some of these issues we attempt to address in our study. For example, constructing a linking strategy to re-establish identity links among business units and a strategy to link TiG to IDBR in the face of an inconsistent format of VAT identifiers in the two datasets.
We recognise that some improvements to the data could perhaps be made in future analytical work to increase the quality of microdata for this kind of analysis.
We also recognise that some of the data issues are because of how the administrative data are collected and recorded, and hence cannot easily be resolved by researchers and analysts.
Regardless of the data challenges we faced, our preference utilisation rates (PURs) analysis shows how detailed-level administrative data can be used to conduct firm-level analysis of preferential tariffs and how data science techniques can be successfully applied to analyse these questions — laying the foundations for further analysis of preference utilisation in the UK.