Transformation in the Ghana Statistical Service
Background
Challenges related to the cost of living are having an impact in many countries, with the prices of goods and services rising faster than in recent years. For example in October 2023, prices were more than a third higher than a year earlier in Ghana.
National statistics offices use their Consumer Price Index (CPI) to measure these changes. They identify what is in a typical shopping basket for people in their country. And then they monitor the prices of these items each month to measure overall price changes.
The CPI is a high profile and closely watched indicator. In particular, policy makers track its progress to inform decisions on interest rates, tax and other measures that could affect or control price changes.
The ONS Data Science Campus has been working with colleagues in the Ghana Statistical Service (GSS) to improve the effectiveness and efficiency of their CPI production process using automation techniques. We have also been using this collaboration to build the skills of GSS staff in coding, collaborative working and other areas of data science capability.
The UK is committed to supporting progress in low and middle income countries through its programmes on international development. Much of this is done through the work of the Foreign, Commonwealth and Development Office. But the ONS also has its own International Development Strategy with a focus on high quality statistics to improve lives globally.
As part of this, the Data Science Campus works closely with national statistics offices to deliver data science projects and build the capacity for colleagues in these organisations to use and embed data science best practice in their work.
The GSS is at the start of its journey to embrace data science. But it is committed to this as set out in their recent roadmap. Our engagement around CPI automation was therefore particularly timely and strategic as we were able to incorporate training to build their skills and knowledge on data science tools, project management and delivery, which will support them as they implement their data science plans.
For this project, we worked for around ten months with GSS colleagues in the Consumer Price Index (CPI) team and some new recruits in the recently established Data Science and Research Directorate. Our focus was to identify and implement automation techniques that could be used to update and transform their CPI production and reporting processes.
Project overview and impact
Our main project outcome was to deliver increased sustainability of the CPI process so that a wider range of GSS staff could use and adapt it. We did this through developing a reproducible analytical pipeline (RAP).
GSS already had a CPI workflow pipeline written in R by a member of staff who had moved on from the organisation. But when Ghana underwent administrative boundary changes, the pipeline no longer delivered the correct regional analysis.
Although the original code contained all the correct methodology to calculate the CPI, its structure and documentation made it difficult to update and maintain. This was particularly the case given the CPI team’s limited experience of using R. As a result they reverted to the old semi manual process of using Stata and Excel.
Our initial task was to restructure the code in a modularised version, breaking it down into multiple small sections and functions. This made it easier to understand with clear and transparent descriptions for each module. The functions also make updating the code easier: this can be done in one place, which is then re-used throughout the pipeline, thus reducing the risk of errors.
Alongside the new code, we also delivered extensive documentation. This supports the sustainability of the process allowing GSS statisticians and analysts to take ownership of the work and operate the system. It will also enable them to maintain and update it when, for example, new weights are added or a new base year is introduced.
We included extra data validation and quality checks to the pipeline, to improve its transparency and robustness. Previously some of these checks were being done manually, with the potential for human error.
A phase of parallel running for five months between the old and new systems was also crucial for quality assurance and testing. And, in fact, during this phase we and GSS colleagues observed that the indices diverged for one region for a small group of items (oils and fats) between the two processes. The version control and documentation processes in the R pipeline gave us confidence in those figures. And this helped us quickly identify where an error had crept into the old Stata and Excel results. This would not have been picked up so quickly, if at all, under the old system.
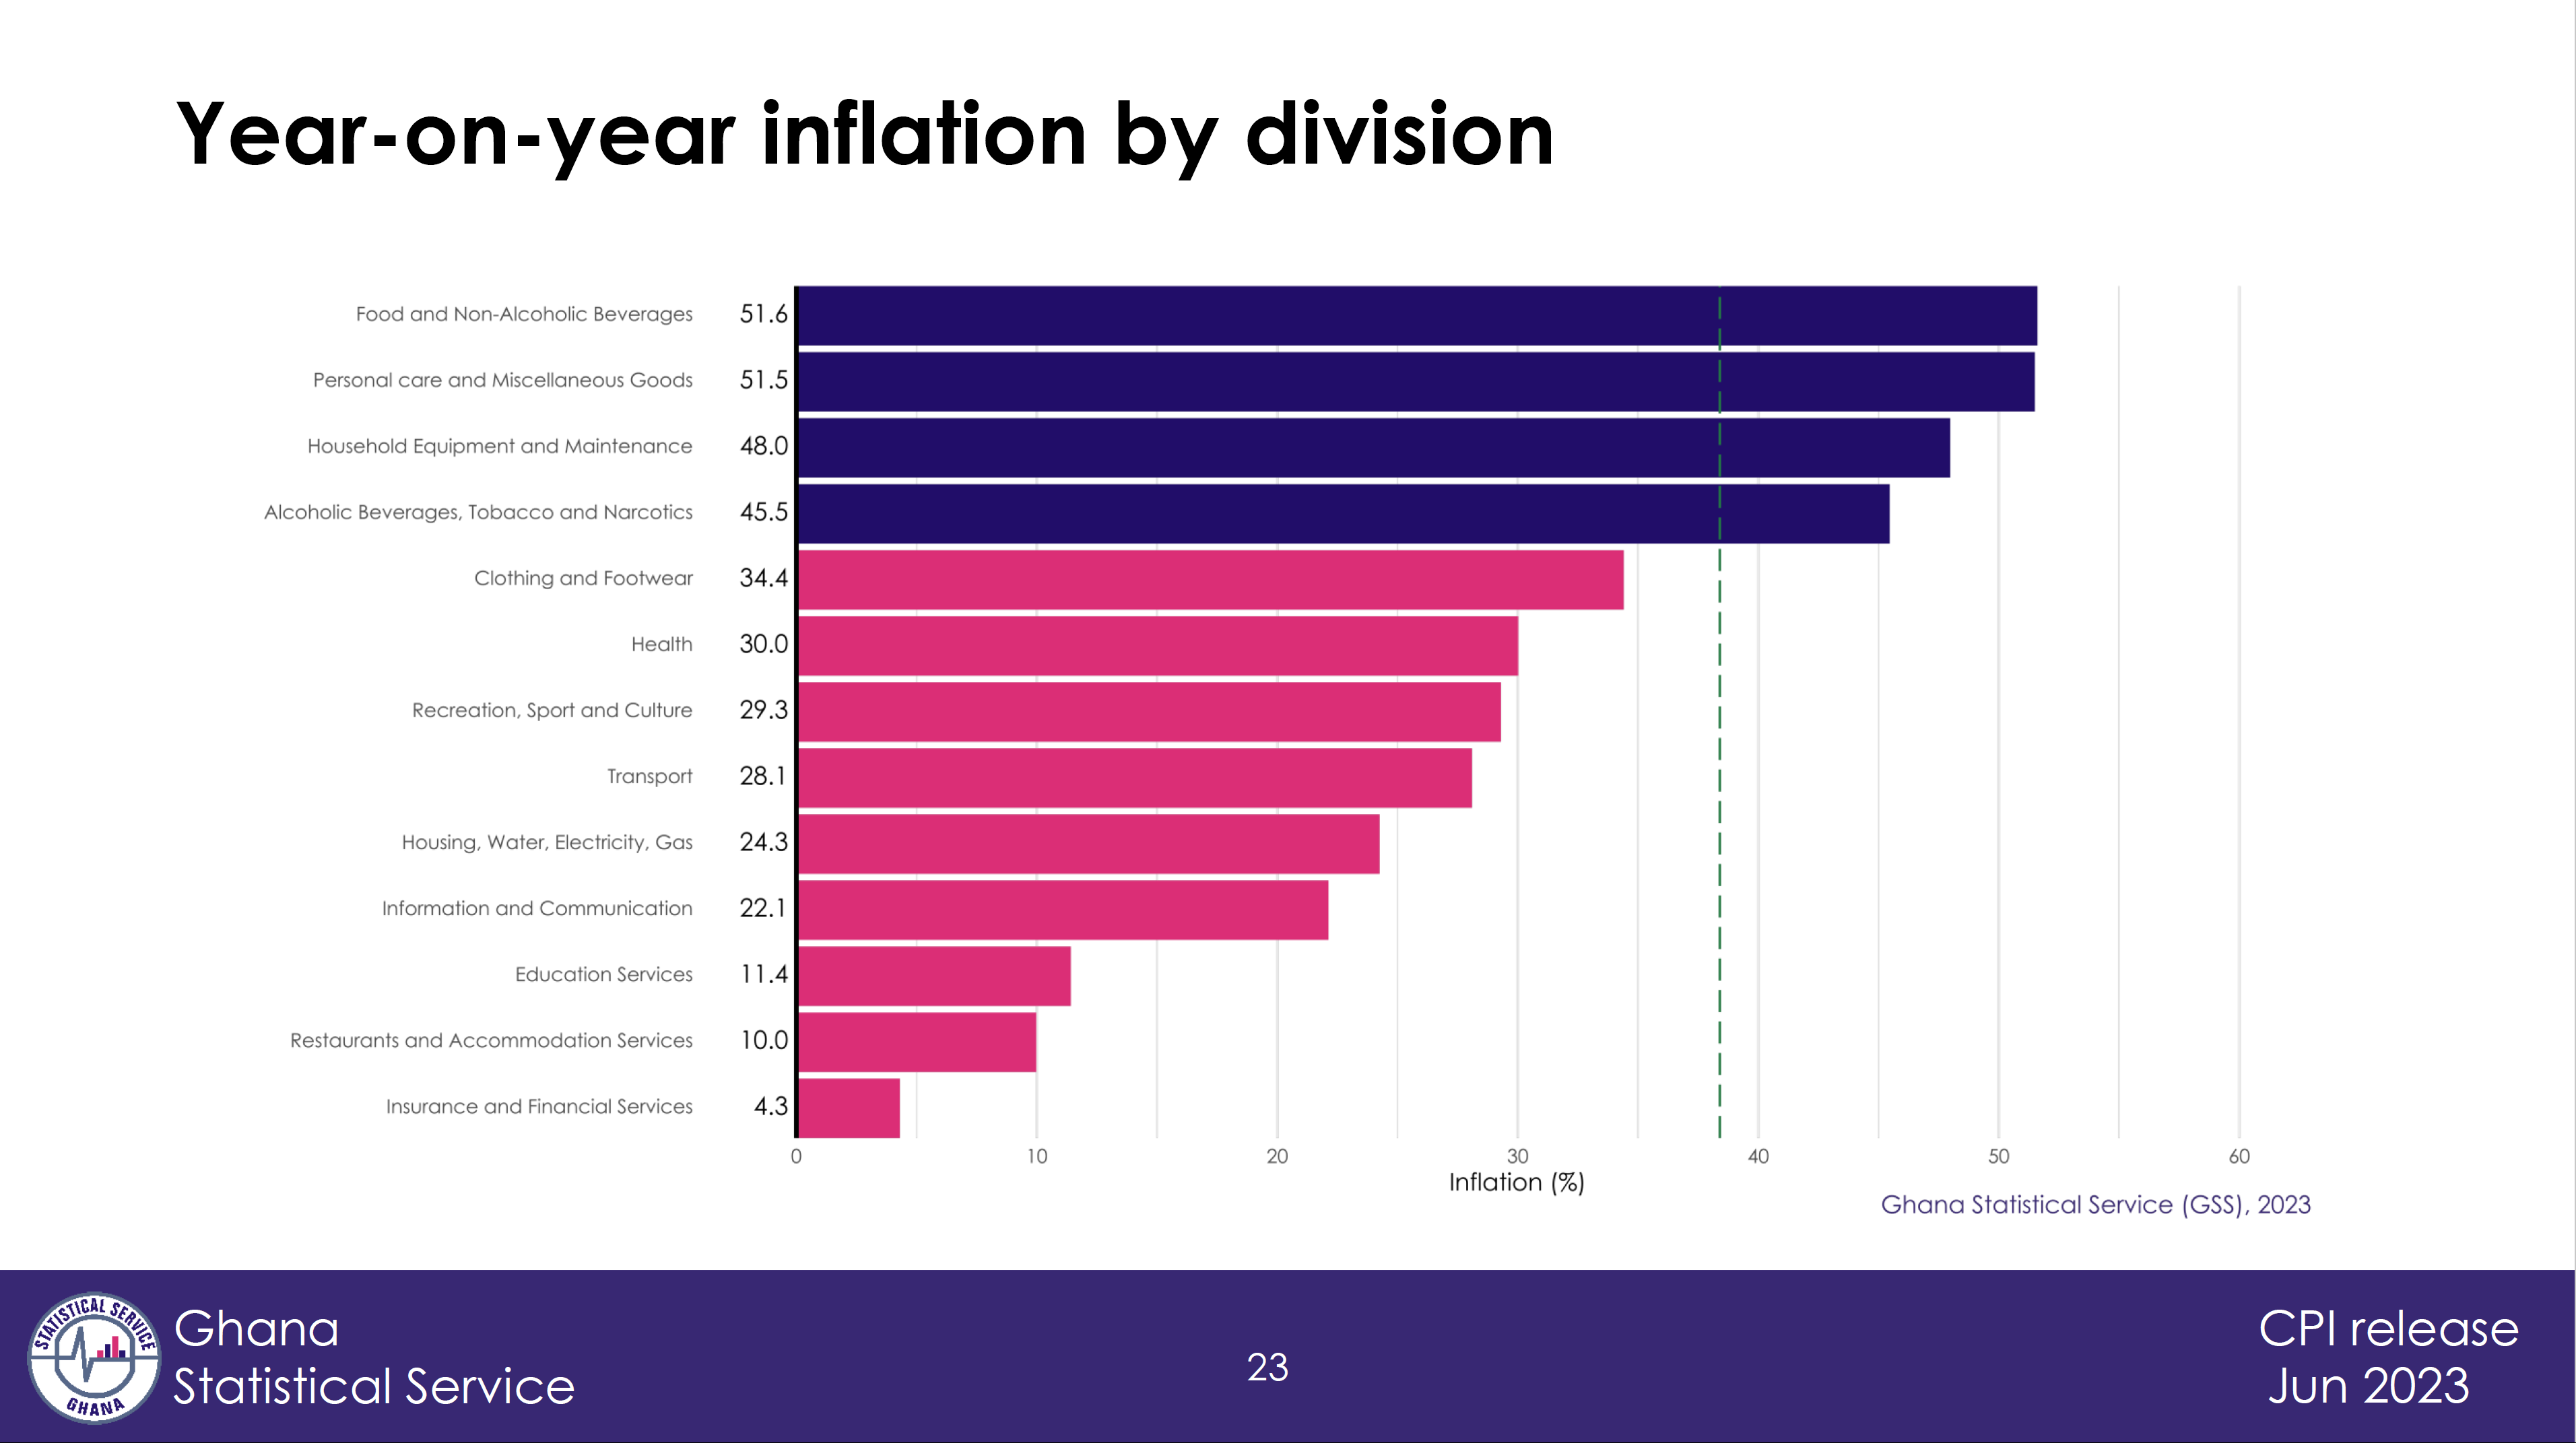
We also identified another way to improve efficiency: automating the production of the monthly presentation. This presentation is given to the national press and public every month and contains the latest CPI and inflation figures. Crucially, the content is largely the same every month but updated to reflect the latest data. This made it ideal for automation, freeing the team’s time to concentrate on topical or specific analyses for that month, and reducing the likelihood of human introduced errors during manual production.
Within the presentation, the visualisations were also reviewed and improved. The graphics were modified to make them more accessible, particularly to colour blind users. The colour schemes used were updated in line with the new GSS corporate colour palette, and the code to produce the graphs and charts was refined to make it easier to change the colour schemes for all of them in one simple step.
The CPI press briefing automatically produced by the new pipeline.
A key part of the closing stages of the project was to ensure that there is a wider group of people in the CPI and data science teams able to run and maintain the pipeline. One of the reasons why the previous R process could not be maintained and modified was the limited engagement with the pipeline and the lack of coding skills within the CPI team.
Our support has widened the group of GSS staff that understand the pipeline and have the skills to run and maintain it. It has also built the skills within the CPI team so that, by the end of the project, it was people from the GSS who were explaining the new system and providing training to wider groups of colleagues. This will deliver sustainability and security for the delivery of this key statistical output in the event of staff changes and absences.
Overall the project has led to significant efficiencies and time savings. This will free up time for staff to conduct more specific bespoke analyses for CPI users. GSS estimated that the old Stata and Excel system took three people working for most of one week to process the price data and deliver the CPI outputs each month. The new pipeline can be run by one person in a matter of minutes, with additional staff input likely to be reduced to one person over the publication week.
“The use of the Reproducible Analytical Pipeline for our CPI has been of great benefit to the Price Statistics and Inflation Team. Every month it dramatically reduces the time to do the processing and produce the press briefing presentation, and it minimises the need for human intervention. With our newfound data science skills, the unit anticipates delivering more automations in other areas of GSS work.” (Jibril Fuseini, GSS CPI Statistician)
As well as these key impacts on the CPI processes and outputs, the collaboration has delivered clear gains in the capacity of GSS staff and the impact of data science across the office. The weekly mentoring sessions covered a range of topics with GSS staff and discussed the tools and techniques that are key for successful delivery of data science projects. These included version control, project management, quality assurance and good practice in collaborative.
Skills learned during the ONS mentoring sessions have already been used in wider GSS work. Dora, one of the data science mentees, commented:
“Using the skills we learnt in Quarto and markdown, I was able to make other automatic reports that were used across other GSS work such as survey monitoring.”
And the mentees have also been able to pass on their skills to other colleagues in the GSS. Simon, another mentee, explained:
“We have been adopting the use of Github across different data science projects and we have had a request to help train and develop colleagues across the office in these data science tools.”
Future plans
Speaking on a recent ONS podcast, Prof Samuel Annim, the Ghana Government Statistician, highlighted the benefits of the wider partnership between ONS and GSS:
“Partnerships that we’ve seen between National Statistical Offices over the years have always taken the dimension of statistical production partnerships … but our partnership with ONS has taken a different dimension. In addition to focusing on the traditional mandate of the institute, we really have over the period achieved some milestones from the perspective of transformation, and injecting technology or contemporary ways of dispensing our duty as a National Statistical Office.”
The work with the CPI is a key example of the transformation that contemporary methods and new technologies can bring to statistics offices. And the plan is that the benefits of this work will spread beyond the production of price statistics and measures of inflation. The CPI automation project will feature in forthcoming training sessions for all GSS section heads, which will showcase the impacts that data science and automation have had.
This will be followed by workshops to help additional areas in GSS identify where data science can be embedded into their work through automation and other projects. The aim is that the lessons and experience from the ONS and GSS collaboration on CPI can have a positive impact on the way leaders in GSS think. And, as a result, data science can continue to support the transformation of official statistics in Ghana.