Quality and methodology: Extent and change of surface water statistics
This is a report on the quality and methodology of data used to produce extent and change of surface water statistics, detailing the strengths and limitations of the data, methods used, and data uses and users.
Table of contents
1. Output information
| Non-official statistics produced under the Voluntary Application of the Code of Practice for Statistics | |
| Data collection | Sustainable Development Goal indicator 6.6.1: Change in the extent of water-related ecosystems over time |
| Frequency | Annual |
| How compiled | Secondary data derived from satellite imagery |
| Geographic coverage | UK |
| Related publications | UK data for Sustainable Development Goals |
2. About this report
The data described here are estimates the Office for National Statistics (ONS) has curated as part of their role in reporting UK data to measure the Sustainable Development Goals (SDGs). The ONS is not publishing these data as official statistics. This is because they are extracted from a new data source that uses innovative methods, subject to amendment, and so further understanding is need around it’s fitness-for-purpose and continued quality.
This report has been compiled as part of the ONS Data Science Campus’s ambitions to comply with the Voluntary Application of the Code of Practice for Statistics and the standards of Trustworthiness, Quality and Value that underpin the Code.
This report is based on the format of a Quality and Methodology Information (QMI) report. It contains information on the quality characteristics of the data (including the European Statistical System’s dimensions of quality) as well as the methods used to create it.
The information in this report will help you to:
- understand the strengths and limitations of the data
- learn about existing uses and users of the data
- understand the methods used to create the data
- decide suitable uses for the data
- reduce the risk of misusing the data
3. Important points
- The indicator has been estimated using data on water extent automatically classified from satellite imagery rather than being captured by topographic ground survey.
- It is important to understand sources and levels of uncertainty in data produced in such a way; these include classification accuracy, quantity of valid observations made and the resolution of the imagery.
- Currently, the data only measure a subset of the complete indicator: the spatial extent and change of inland, lake and reservoir, open waters.
4. Quality summary
Overview
The Sustainable Development Goals (SDGs) are a set of ambitious goals and targets designed to make the world a better place by ending poverty, halting climate change and reducing inequalities. This work programme is part of the country’s commitment to the 2030 agenda on sustainable development.
The Office for National Statistics (ONS) is fulfilling the mandate placed on all National Statistical Institutes (NSIs) by the UN General Assembly to coordinate and report on the global SDG indicators. We aim to shine a light on who is being “left behind” so policymakers can act, and we aim to support colleagues across the world develop capability.
Target 6.6 is to protect and restore water-related ecosystems, including mountains, forests, wetlands, rivers, aquifers and lakes by 2020.
These data are being used to report on SDG indicator 6.6.1: Change in the extent of water-related ecosystems over time. The UN metadata for this indicator are available. Currently, these data only measure a subset of the complete indicator: the spatial extent and change of inland, lake and reservoir, open waters.
Uses and users
There are various user types that have been identified for the UK SDG data site (for more information on user research, see the
- concerned citizen – “Tell me what the goals are and what is being done about them”
- connected influencer – “Give me a tool that will support my ambitions and give me a louder voice”
- fact gatherer – “I just need to quickly see what progress is being made and check the facts”
- involved analyst – “I just want the data so I can do my own thing from it”
- custodian agencies – UN bodies responsible for compiling and verifying country data submitted by national bodies
- Civil Society stakeholders (for example, the UK Stakeholders for Sustainable Development)
Strengths and limitations
The main strengths of these data are:
- the underlying Global Surface Water data have been produced by water experts at the UN Environment Programme and the European Commission Joint Research Centre for the purposes of monitoring this SDG; this was done in recognition of a lack of alternative data sources for monitoring change over time in both transient and permanent water
- the methods to produce the data are comprehensively described and peer reviewed; the accuracy of results has been tested against 400,000 samples
- the data are open and available for the entire world, providing data that can be compared internationally
The main limitations of these data are:
- in using the underlying data source, certain quality trade-offs have needed to be made, which have favoured the ability to measure change over time over the accuracy and spatial resolution of the data, if compared to surveyed topographic sources.
- the complexity of producing the underlying data means they are only generated once a year
- the underlying data have been restricted to authoritative national boundaries, which may mean some divergence from figures reported internationally
- at this time, the data only report on a subset of water ecosystems covered by the indicator and do not discriminate categories of water within this (for example, anthropogenic versus natural water bodies)
Recent improvements
Plans are currently being developed to produce a data series using higher resolution Sentinel imagery. It is envisaged this product will be available over the next two years.
5. Quality characteristics of extent and change of surface water data
This section describes the quality and characteristics of the data from a range of perspectives, and it highlights issues in using this information that may result from these.
Relevance
Relevance is the degree to which the statistical product meets user needs for both coverage and content.
These statistics have been produced in relation to the measurement of Sustainable Development Goal (SDG) indicator 6.6.1: Change in the extent of water-related ecosystems over time. The indicator focuses on a variety of water-related ecosystems important to the provision of services to society including wetlands, open waters (rivers and estuaries, lakes, and reservoirs) and groundwater aquifers. The methodology (PDF, 802KB) for the indicator identifies four sub-indicators: the spatial extent of water-related ecosystems; the quantity of water contained within those ecosystems; the quality of water contained within those ecosystems; and the health or state of them.
The statistics draw on a global dataset that has been produced by the UN Environment Programme (the custodian agency), the European Commission Joint Research Centre and Google for the purposes of measuring this indicator. This applies a consistent algorithm to classify water annually and across 35 years of historical Landsat satellite imagery.
This provides a historical baseline against which to measure the indicator, allows consistent statistics to be generated for the entire UK and provides a basis for international comparability.
However, while this resource fills a gap in data available to measure indicator 6.6.1, it only provides a part of the information targeted by the methodology. Specifically, it measures the spatial extent or area (sub-indicator 6.6.1a) for inland, lake and reservoir, open waters as:
- annual extent of inland surface water broken down by i) permanent and ii) seasonal for each of the HydroBASINS areas
- change in mean extent of surface water broken down by i) permanent and ii) seasonal for each of the HydroBASINS areas
The change in extent is calculated as:
\(\)
\( \text{Percentage Change in Spatial Extent} = \frac{\text{γ – β}}{\text{β}} \)
where:
β = the average national extent from 2001 to 2005
γ = the average national extent of any other five-year period
Accuracy and reliability
Accuracy and reliability are the degree of closeness between an estimate and the true value.
The statistics have been derived from satellite imagery, which measures characteristics in the electromagnetic spectrum of sunlight reflected by the Earth’s surface at the point of capture. The approach employs a model that classifies this spectral information in different places as “water” or another type of land cover. This approach differs from methods used to capture water in topographic mapping, where trained surveyors measure the boundaries of every individual water feature either in the field or using very high-resolution aerial photography.
This difference in approaches means that data derived from satellite imagery have more error and uncertainty. This will be related to:
- the resilience of the model to subtle variations in the appearance of water, resulting in misclassifying water as non-water (errors omission or false positives), or misclassifying non-water as water (errors of commission or false negatives)
- obscuring of the earth surface because of the presence of cloud when satellite observations were taken, which can particularly result in changes in seasonal water being missed
- uncertainty in classification of a pixel where spectral profiles are mixed together from multiple land cover types at that location, for example, along the edges of a waterbody
- the lower level of human intervention in the process to check every instance of water that was automatically classified
- the resolution at which the satellite imagery being classified was captured at, below which water features will not be detected; these data used Landsat imagery with a pixel resolution of 30m (900m2), though in general it is safer to assume that only water bodies of double that resolution will be actually detected (around a third of a hectare)
The source data have been validated across the globe and over time using over 40,000 reference points. Based on this, it is estimated the model produces less than 1% false-positive detections of water (commissions) and less the 5% false negatives (omissions).
An analysis of the data over time has been conducted to identify anomalies and better understand their reliability. The Global Surface Water data contain two periods of anomalous data: 1991 to 1997 and 2004 to 2008. The former is because of either missing or misclassified Global Surface Water data resulting in the absence of spatial extent (excluding 1994). The latter is because of cloud cover diminishing suitable images for the Global Surface Water Explorer (GSWE) to derive water. Despite anomalies, with the introduction of Landsat 8 from 2013, the data become consistent and suggest an improvement in reliability. Further analysis of reliability is reported in Annex 1: Source data quality assurance.
To understand the effect that the pixel resolution has on the data’s omission of water features, much higher resolution SPOT imagery (6m) of Kent, UK was resampled to 10m, 20m and 30m. These were then used to classify water. As expected, using a higher resolution (6m and 10m) enables the classification of finer “water” features as well as delineating smoother water boundaries. However, using a higher resolution also introduces additional noise and begins to classify roads and buildings as water. Using the 6m and 10m images, 73% and 57% of classified water features are below 180m2. When using a 30m resolution, finer water features such as rivers are not captured. A 20m resolution can capture finer features in the image, such as rivers, while minimising additional noise. Additional analysis is described in Annex 2: Pixel resolution.
The spatial resolution of the source data means that most rivers as well as fine-grained, but extensive, wetland ecosystems are not captured by the underlying dataset, for example, the Fens and the Somerset levels. For the most part, these types of water ecosystem are out-of-scope for the sub-indicator being estimated. However, small but potentially significant ponds and lake bodies will also have been missed. The resolution might be compared with that used in reporting for other national initiatives for water bodies. In England and Wales, only water bodies of at least five hectares are typically designated under the Water Framework Directive, substantially larger than the area of those captured in this dataset, though smaller water bodies may also be designated because of their significance (for example, Sites of Special Scientific Interest).
In consequence, the statistics are likely to be less sensitive to changes in areas where the surface water is mainly confined to channels or very small water bodies than areas with significant inland water bodies or flood plains. Even then, changes in the extent of such water bodies below the 30m pixel resolution are unlikely to be detected.
Coherence and comparability
Coherence is the degree to which data that are derived from different sources or methods, but refer to the same topic, are similar.
Comparability is the degree to which data can be compared over time and domain, for example, geographic level.
The extent of permanent water bodies in the UK is captured by the national mapping agencies: the Ordnance Survey and Ordnance Survey of Northern Ireland. In Annex 3: Coherence, we compare the coherence in locations of water between different Great Britain sources having (approximately) accounted for differences in spatial resolutions. We identify errors of commission and omission of around 2% by area, though much of this can also be accounted for in terms of the approximation in the methods to make the datasets a comparable resolution. A very small number of notable anomalies are identified related to artificial waterbodies, for example, a dockyard. Such occurrences were rare and within the stated accuracy levels of the source data.
Accessibility and clarity
Accessibility is the ease with which users are able to access the data, also reflecting the format in which the data are available and the availability of supporting information. Clarity refers to the quality and sufficiency of the release details, illustrations and accompanying advice.
The underlying Global Surface Water data are made available online and through the Google Earth Engine, an open platform for Earth observation analysis. The release includes complete technical documentation on how the product is created and a user guide.
The statistics for the UK are made available online through the national reporting platform. This site follows the Web Content Accessibility Guidelines (WCAG 2.1) and has achieved AA standard. It allows statistics to be presented online with interactive charts, maps and tables and downloaded free of charge in CSV format. Background information and supporting documentation are provided alongside data.
Timeliness and punctuality
Timeliness refers to the lapse of time between publication and the period to which the data refer. Punctuality refers to the gap between planned and actual publication dates.
Owing to the intensity of computations involved in running the global algorithm to produce the underlying data, the GSWE product is only produced on an annual basis. This is planned for the end of February each year (for example, the monthly data for January would only be available in February 2019).
To allow time to extract and process these data for national reporting, the updates on the national reporting platform are planned for March in each year.
Concepts and definitions (including list of changes to definitions)
Concepts and definitions describe the legislation governing the output and a description of the classifications used in the output.
Permanent water is land surface that is permanently underwater throughout the year.
Seasonal water is land surface that is underwater for less than 12 months of the year, in a given year.
Ephemeral water is land surface that is episodically underwater in different years.
HydroBASINS are spatial boundaries defined by the World Wide Fund for Nature (WWF) based on the watersheds of major hydrological systems (for example, rivers).
Geography (including list of changes to boundaries)
Estimates are produced for the UK aggregated by HydroBASINS.
Why you can trust our data
The fitness-for-purpose of the data for reporting change in surface water in the UK has been considered using the Voluntary Application of the Code of Practice for Statistics and its pillars of Trustworthiness, Quality and Value. This has included:
- close engagement with the provider of the source data
- use of the Quality Assurance of Administrative Data (QAAD) framework for systematically reviewing non-conventional sources of data, in consultation with statisticians from the Government Statistical Service (GSS) Quality Centre
- the production of this report on quality measurement
6. Methods used to produce the extent and change of surface water data
How we collect the data, main data sources and accuracy
The statistics are derived from the Yearly History imagery product produced by the UN Environment Programme and the European Commission Joint Research Centre and obtained using the Google Earth Engine platform. Statistics are extracted from this site to allow the application of authoritative mean high water national boundaries for reporting UK statistics.
The code performing the extraction is available on the Data Science Campus’ GitHub page.
How we process the data
Preparing the statistics undergoes the following processes:
- Global Surface Water Explorer (GSWE) imagery is extracted from Google Earth Engine with a mask applied that excludes pixels that had no observations because of cloud cover during baseline years
- the HydroBASINs are clipped to the national boundary (mean high water mark) as of December 2018
- both the HydroBASINs and GSWE exports are reprojected into a projected coordinate system (UTM zone 30N) from latitude and longitude (WGS84).
- pixel counts are aggregated to the clipped HydroBASINs and output tables are produced (that is, any data falling outside the national boundary are removed from the analysis)
- imagery classes are reclassified to ephemeral, seasonal and permanent water classes
How we analyse and interpret the data
The data are made available through the national reporting platform. The platform includes functionality for users to view and analyse the statistics using tables, charts and maps. An example from another indicator is shown in Figure 1. Metadata describing methods and definitions are also provided.
Figure 1: Sustainable Development Goal indicator example
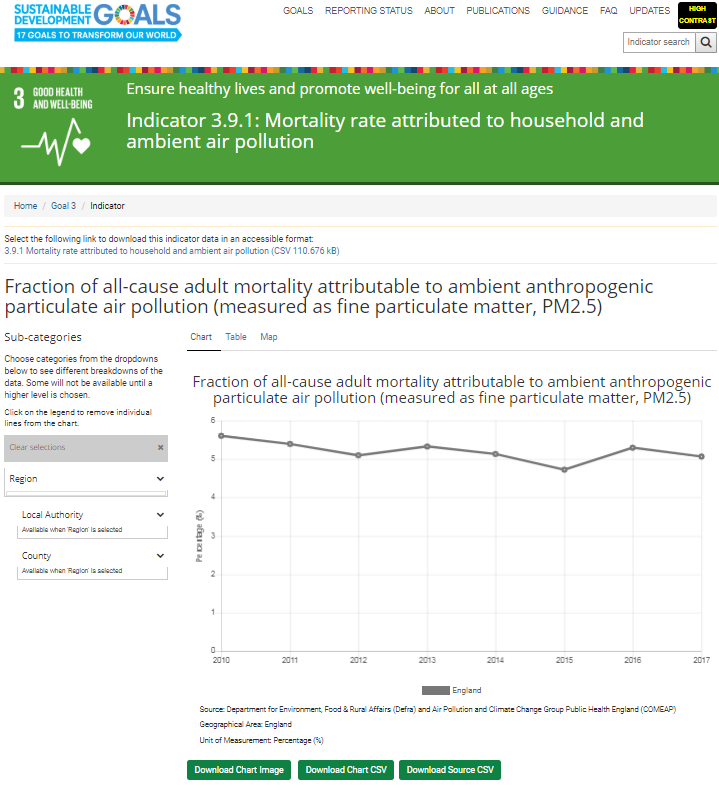
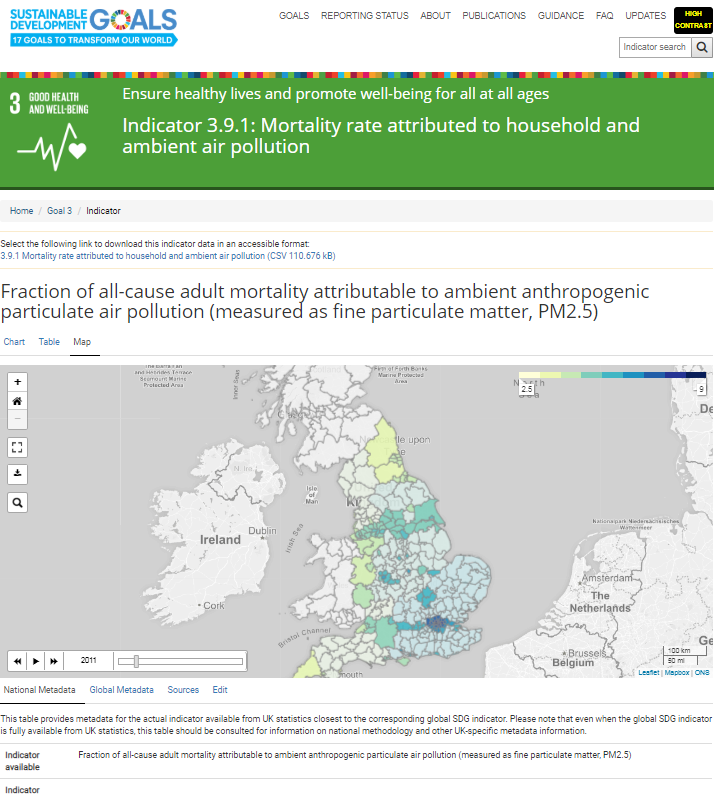
Source: The open source Open SDG platform
How we quality assure and validate the data
Since this is a new source of data, we have conducted an initial detailed review of its quality in respect to national reporting requirements as outlined earlier and in the Annexes. We have also established a set of ongoing assurance tasks to be undertaken on subsequent updates to the data:
- review metadata on number of valid water observation and locations where confidence is low.
- review trends in permanent water over time for plausibility
- compare changes in permanent water against previous year and investigate areas where significant differences are observed
- review locations of large changes in seasonal and ephemeral water and seek corroboration for these, for example, from flood reporting
How we disseminate the data
The data are made available online as graphs, maps and CSV files through the national reporting platform (UK SDG data site). Links to the UN methodology and national quality information are provided. In addition, important quality information is highlighted after the chart to ensure data are not misinterpreted by users.
How we review and maintain the data processes
The quality assurance process outlined in this report has been reviewed by colleagues in the Office for National Statistics (ONS) Quality Centre as well as statisticians at the UN Environment Programme.
The data and supporting metadata are uploaded onto a feature branch of the UK SDG data website by a member of the SDG data team. This is checked by a second member of the team following a quality assurance checklist. A URL hyperlink of the feature branch is then sent to data providers (as the topic experts) for a final quality check. Once the feature branch has been checked and signed off, it is uploaded to the staging site and subsequently pushed to live. Regular contact is maintained between the data providers and SDG team, so if issues arise with the data these are communicated and acted on.
7. Annex 1: Source data quality assurance
The source data, Global Surface Water Explorer’s (GSWE’s) Yearly Water Classification product, was used to aggregate water extent by type (permanent, seasonal and ephemeral) to the UK’s HydroBASINs. The HydroBASINs were clipped to the UK’s 2018 mean high-water mark to exclude open water extending past coastlines and estuaries. A time series of the national water extent for each water type is shown in Figure 2.
Figure 2: Annual national extent of inland surface water separated by type (permanent, seasonal and ephemeral)
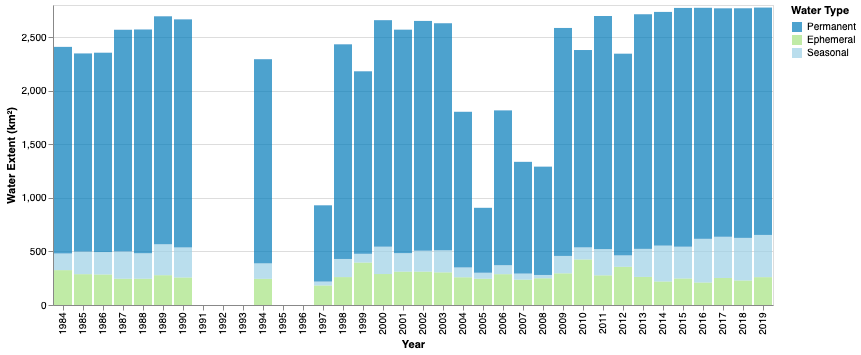
Source: Global Surface Water Explorer data; European Commission Joint Research Centre; and Google
Yearly water extents from 2013 onwards were found to be the most reliable, likely because of the use of Landsat 8 satellite observations launched in that year. During this period, the GSWE data show consistency with little variability, compared with previous years. The time series also shows anomalous periods, spanning multiple years, of water classification within the UK. There are two periods of anomalous data from 1991 to 1997 and 2004 to 2008.
From 1991 to 1996, the data suggest an absence of all water types, except for 1994. Further analysis of the source data shows that it has been labelled as “0” (no data) in locations of known permanent water bodies within the UK and the rest of Europe. This misclassification is also true for the monthly water classification dataset within these periods. It is unclear if this misclassification is an issue with the Google Earth Engine platform or an error in the dataset itself. The water history datasets will be made available in the near future.
For the second period of anomalous data (2004 to 2008), national water extent was considerably lower than years either side of this period. This is because of a lack of availability in suitable satellite imagery from which to derive water, as a result of cloud cover when observations were made. Yearly water classifications are derived from the monthly dataset, where a pixel is classified as “0” (no data), “1” (not water) or “2” (water). Each pixel in a month can therefore be reclassified to represent “no data” or an “observation” (“0” and “1” respectively). A summation of each pixel, over a given period, would show a pixel’s total observations over time.
Analysis of the total observations across this anomalous five-year period, shown in Figure 3, shows that data availability diminishes as latitude increases, likely because of cloud cover. Despite the maximum observations a pixel can have being 60, during this period the observed maximum was 35. The absence of observations therefore results in the lack of available GSWE data and accounts for diminished surface water extents during this period.
Figure 3: Total number of observations each pixel had from January 2004 to December 2008
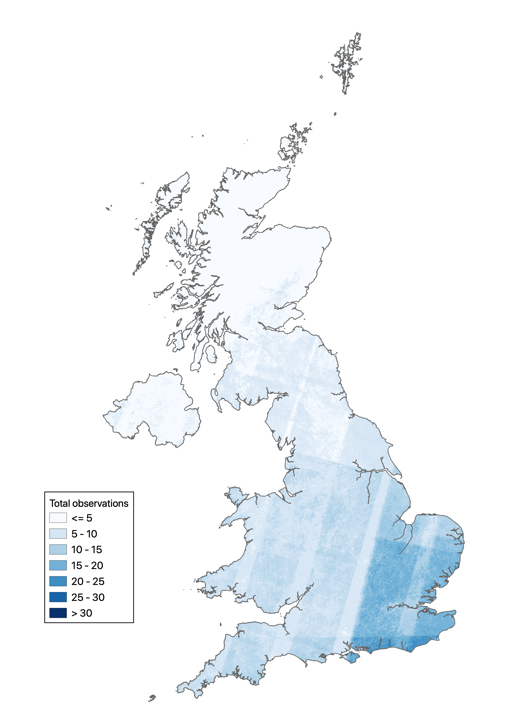
Source: Global Surface Water Explorer data; European Commission Joint Research Centre; and Google
Furthermore, 2004 and 2005 fall within a baseline period (2001 to 2005) used to calculate percentage change in spatial extent. To mitigate the impact on the calculation from missing data within the baseline period, the modal value of each pixel was used to create the average baseline. A very small number of pixels with no observations over the baseline period were masked in subsequent years to prevent comparison to no data values.
8. Annex 2: Pixel resolution
To understand the implications of pixel resolution on water classification, high-resolution SPOT imagery of the River Medway in Kent was obtained through the Space for Smarter Government Programme and resampled to varying resolutions. The high-resolution SPOT image (6m) was downsampled to 10m, 20m and 30m images. Normalized Difference Water Index (NDWI) was carried out on each of the images, and “water” features were classified using an adaptive triangle threshold. With water features identified for each image, they were upsampled back to a 6m resolution for comparison (see Figure 4).
Overlapping each layer’s water classification shows that, for the most part, a resolution of 30m is sufficient to identify major (but not minor) water bodies (see Figure 4). As expected, the higher the resolution the more water identified. A greater resolution provides greater detail around water features and the ability to detect smaller features (for example, creeks). However, there is additional noise as a result of increased variability introduced at a greater resolution (Figure 5, image B). At a resolution of 10m, road networks begin to be misclassified as water as they can have similar reflectance properties. This type of misclassification is less abundant with coarser resolutions of 20m and 30m.
While an image at a 30m resolution adequately classifies large areas of surface water, it fails to identify smaller areas of inland features, for instance, further up the course of the River Medway (Figure 5, image C), whereas the 10m images are able to classify the continuous body of water. However, as previously shown, noise resulting from additional resolution incorrectly identifies a road that crosses perpendicular to the river as “water”. Figure 5 image C shows that the 20m resolution image is a compromise between the two resolutions, with the ability to classify water to a reasonable level of detail without incorporating additional noise.
Figure 4: Overlaying of “water” features classified using a 6m SPOT image of the River Medway, Kent, and the image resampled to 10m, 20m and 30m
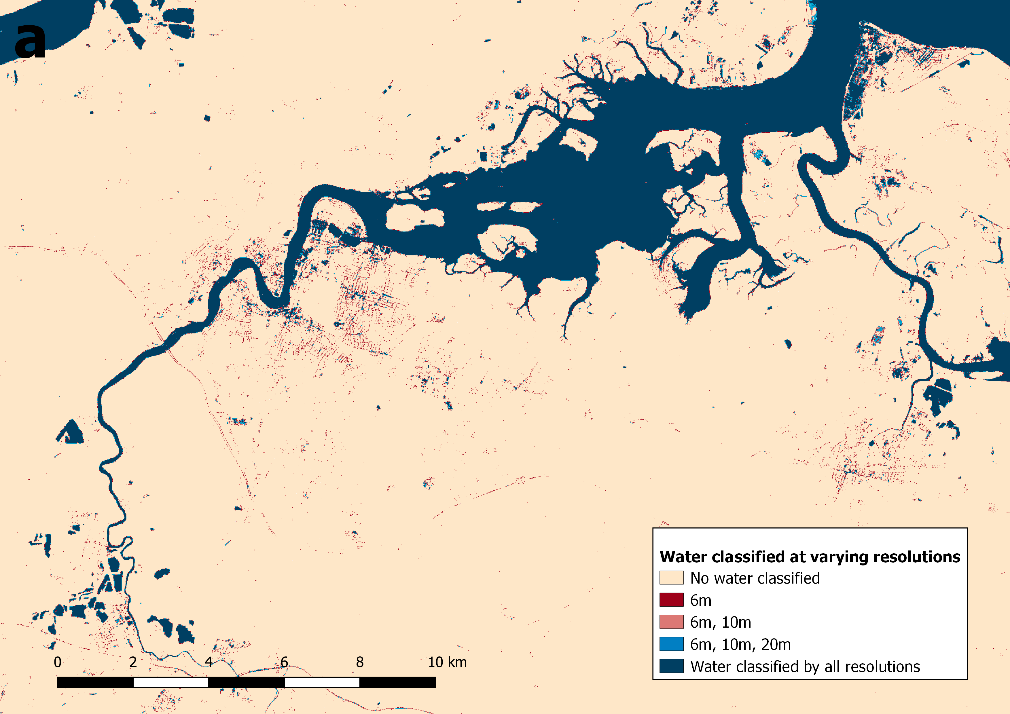
Source: Image Copyright © AIRBUS Defence & Space
Figure 5: Examples where “water” classification varies between resolution in figure 4
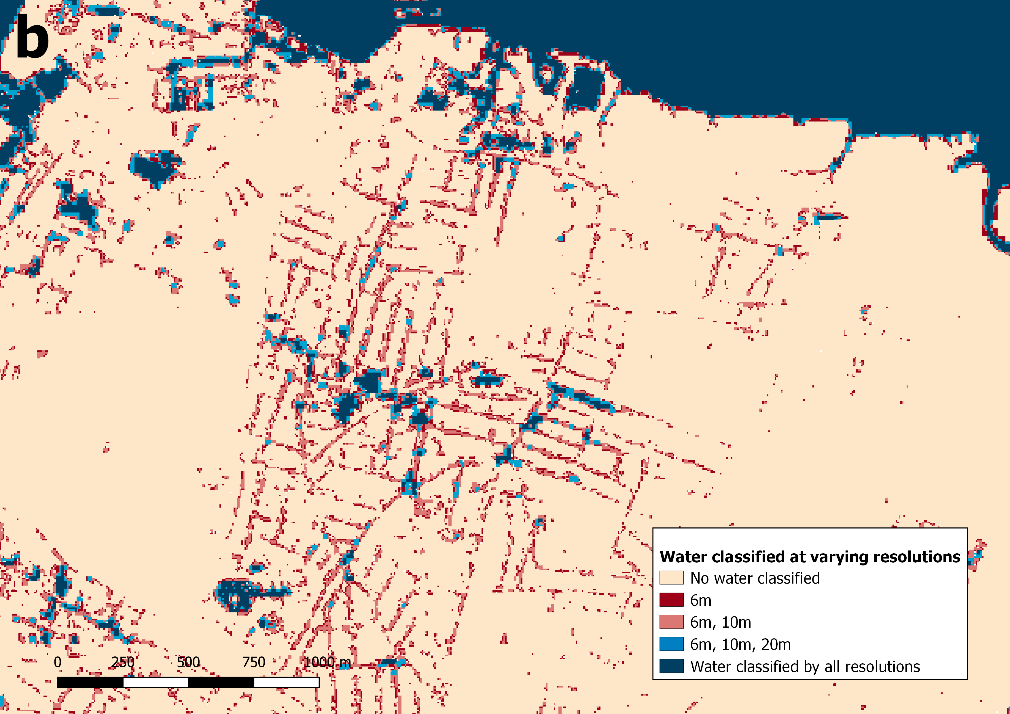
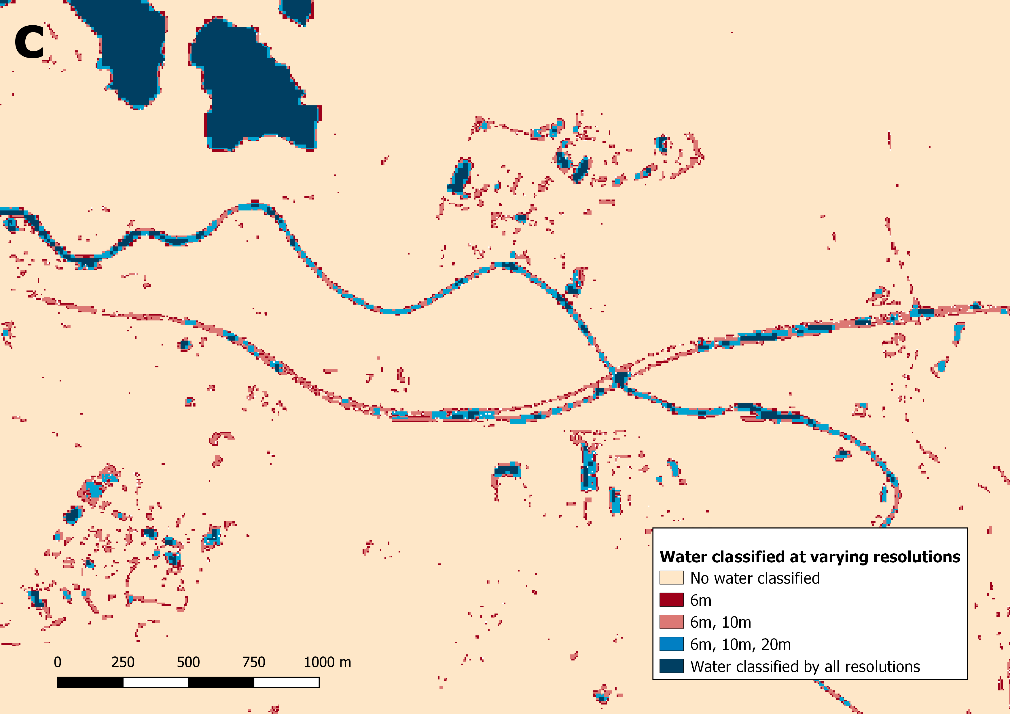
Source: Image Copyright © AIRBUS Defence & Space
The additional noise that higher resolution images add to the NDWI classification can be illustrated by removing small features of connected pixels classed as “water” (see Figure 6). At a high resolution, connected objects of less than a few pixels are more likely a result of increased variability and are less likely to be part of a wider water-related ecosystem. They can, therefore, be considered to be noise. Removing small objects reduces roofs of buildings and roads being classed as “water”. As shown in Figure 6, removing small objects of less than five pixels (180m2) removes 73% and 57% of all water features classified by NDWI using a 6m and 10m resolution images, respectively.
Comparatively, using a 30m image for classification perhaps lacks the necessary detail to identify smaller bodies of water shown by the number of pixels required to remove water objects. As shown, there are advantages and disadvantages to using high- and low-resolution imagery. Therefore, the most fit-for-purpose resolution would be one that is able to identify water bodies of sufficient area while reducing the incorporation of noise and computational costs. For general purposes, using an image resolution of 20m provides adequate detail without additional noise, as shown by a more gradual curve in Figure 6.
Figure 6: The impact of removing water features of varying pixel sizes and the proportion of water features remaining
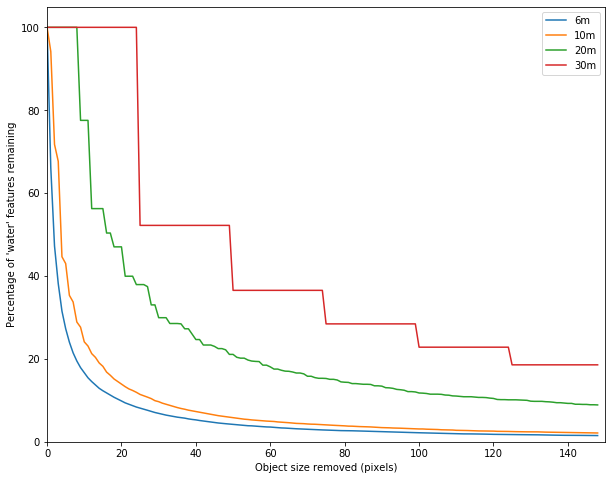
Source: Data derived from SPOT and Pléiades images from AIRBUS Defence & Space
Notes:
- 10m, 20m and 30m water classifications were upsampled to a resolution of 6m for comparison.
9. Annex 3: Coherence
Coherence is the degree of similarity between data derived from different sources or methods (but on the same topic).
To analyse the coherence of the Global Surface Water Explorer (GSWE) dataset, it has been compared to an authoritative topographic data source for Great Britain produced by the Ordnance Survey. The following describes coherence in terms of the omission and commission of patches of water between each data source.
Overall comparison
Figure 7: Maps comparing the extent of water bodies captured by the two data sources
-

- Source: Ordnance Survey Open Map – Local Contains OS data © Crown copyright and database right (2020)
-
- Source: Global Surface Water Explorer data; European Commission Joint Research Centre; and Google
The amount of detail captured in the Ordnance Survey data is clearly much higher and includes fine hydrological features like rivers and wetlands, which are not captured by the GSWE.
One reason for these differences is that the Ordnance Survey data capture the outlines of water features using high-precision surveying methods either directly in the field or using very high-resolution aerial photography. In contrast, the GSWE explorer data do not capture the outlines of features but rather classify pixels from a satellite image according to whether they are likely to be water or some other type of land cover. This means the resolution of the two sources is very different with features that are smaller or narrower than the pixel resolution (approximately twice the actual pixel resolution) being missed.
While there are limitations to the size of features captured, the GSWE data enable monitoring of change over time, which is an important aspect of the indicator. They include annual extents over the past 30 years, and within each year they include permanent and transient water (for example, seasonal flooding). Water features in the Ordnance Survey data are more static and permanent. The main purpose of using the GSWE data here is to measure sub-indicator 6.6.1a, which relates to inland open water (rivers and estuaries, lakes, and artificial waterbodies). For example, the UN indicator methodology proposes that changes in the extent of rivers and estuaries are measured in terms of flow (quantity) in addition to spatial extent. Therefore, while rivers are not well captured in the GSWE data, there are other measures by which these features can be monitored.
Harmonisation
Given the sources use different methods and capture different levels of detail, comparing them at face value does not tell us anything about the quality of the GSWE data beyond those differences. To consider coherence, the datasets need to be made more comparable. There is no simple or exact method for doing this, given the differences in how the datasets were collected. However, approximations can be made by reducing the resolution of the Ordnance Survey data to be similar to that of the GSWE data. The following processing was undertaken to achieve this:
- generalise the boundaries of water features using erosion followed by dilation morphological operators with their distance parameters set to the GSWE pixel resolution (30m); the effect of this operation is to collapse narrow features such as rivers and streams as well as to replace narrow necks of land within or between waterbodies with water
- remove small areas remaining that are below the effective resolution of the imagery (60*60m)
- remove any water bodies not contained within the mean high-water boundary of Great Britain; similarly mask out pixels in the GSWE data that are outside the national boundary
Figure 8 compares the result of applying the harmonisation processes in two locations: the Lake District and the Fens. Red boundaries represent the generalised Ordnance Survey water features. Grey (seasonal water) to black (permanent water) is the GSWE data overlaid. Ungeneralised water features can be seen in blue.
Figure 8: Comparison of applying the harmonisation processes to the Lake District and the Fens.
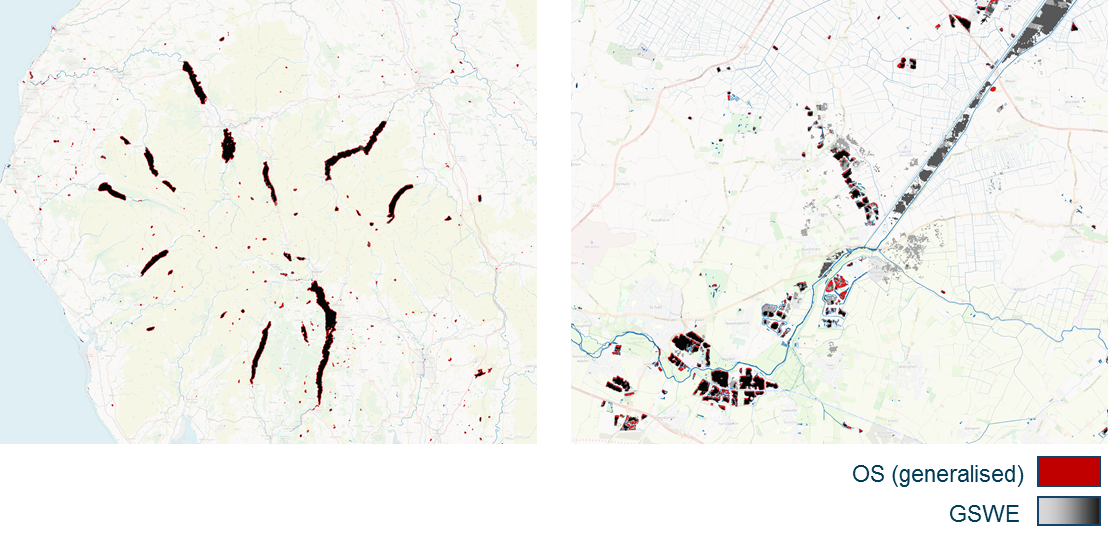
Source: Contains Global Surface Water Explorer and OS data © Crown copyright and database right (2020)
Omission – how much of the water recorded by Ordnance Survey is missing in the GSWE source
The purpose of this analysis is to understand how much of the generalised Ordnance Survey water is missing in the GSWE dataset, whether these omissions are systematic and what reasons can be given for this.
Because of the differences in how the datasets have been produced (described earlier), the analysis measures whether any GSWE water was found in the same location as an Ordnance Survey water feature, rather than the areal extent of agreement.
A significant disagreement between sources is found if individual waterbodies are counted with around 18% missing. However, in terms of overall area this is less than 2%. The histogram (Figure 9) illustrates this relationship. It accumulates numbers of waterbodies by their relative size, using the log of their area to aid visualisation.
Figure 9: Histogram of waterbodies by their relative size
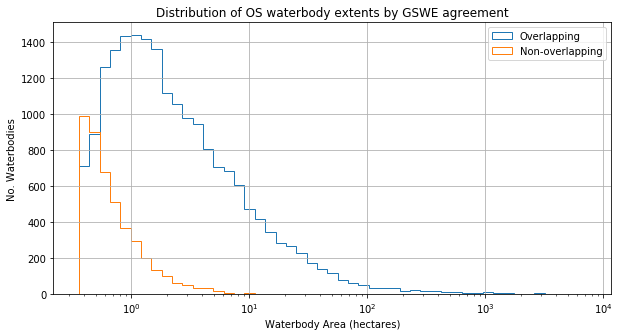
Source: Contains Global Surface Water Explorer and OS data © Crown copyright and database right (2020)
It can be seen in Figure 9 that most of the missing (non-overlapping) waterbodies are small (under one hectare). To a large part, these are because of differences in the resolutions between the two data sources that were not resolved by the harmonisation procedure. Investigation of the larger missing waterbodies identified a number of anthropogenic features including the dock of a naval dockyard and a boating lake. This suggests misclassification resulting from the atypical characteristics of these features.
Commission – how much of the GSWE water is missing from the Ordnance Survey dataset
This analysis identifies patches of contiguous water pixels in the GSWE dataset and then looks at coherence of these patches with waterbodies identified in the Ordnance Survey data.
Around 10% of the GSWE patches (by area) are found in locations where no water from the Ordnance Survey dataset was recorded. However, unlike the Ordnance Survey data, the GSWE data include transient water (for example, seasonal flooding).
Figure 10: Comparison of area (number of pixels) of patches that are matched and unmatched, by the types of water they contain
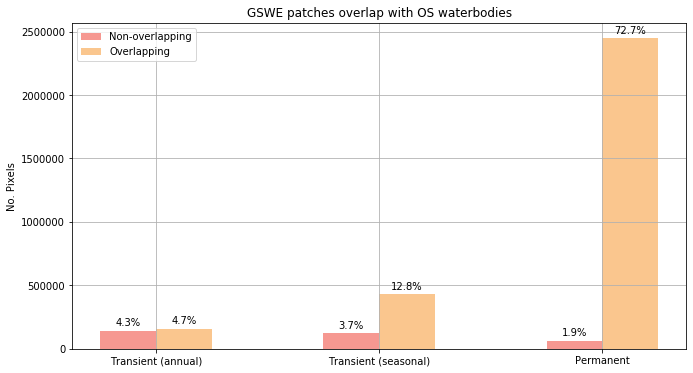
Source: Contains Global Surface Water Explorer and OS data © Crown copyright and database right (2020)
It can be seen from Figure 10 that less than 2% of the unmatched (non-overlapping) area relates to permanent water, as most falls within one of the transient water classes, as might be expected.
Some of the matched (overlapping) water is classed as seasonal, which may be seen as counter intuitive. This is generally because of pixels grouped into patches containing both types of water, for example, representing the extent of a permanent water body that floods seasonally, which results in some mixing between classes.
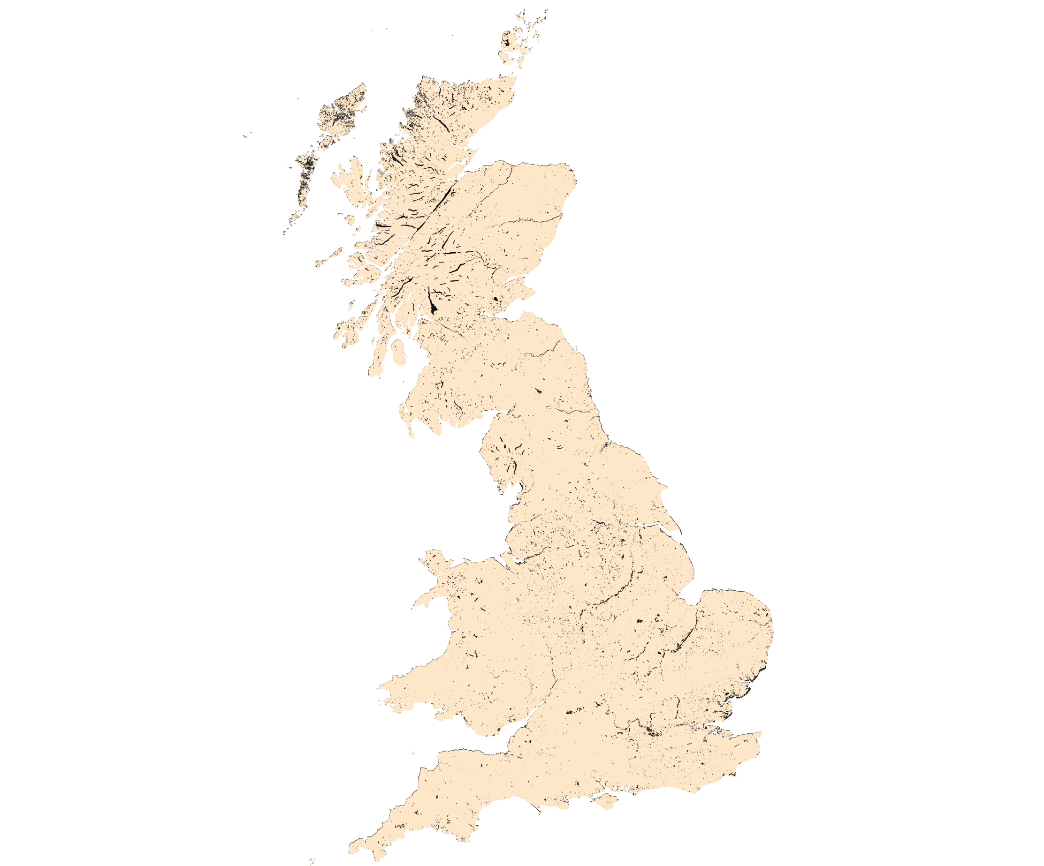
Figure 11 explores the spatial distribution of unmatched water to identify trends and outliers. Perhaps unsurprisingly, areas with the most unmatched pixels are those areas where there is more water generally, for example, the Scottish Highlands. The main unexpected outlier falls in the Somerset levels and relates to a set of artificial reedbeds that form part of a bird reserve. Under the UN metadata, this would be classed as reedbed rather than open water.
Figure 11: Spatial distribution of unmatched water. Contains OS data © Crown copyright and database right (2020)
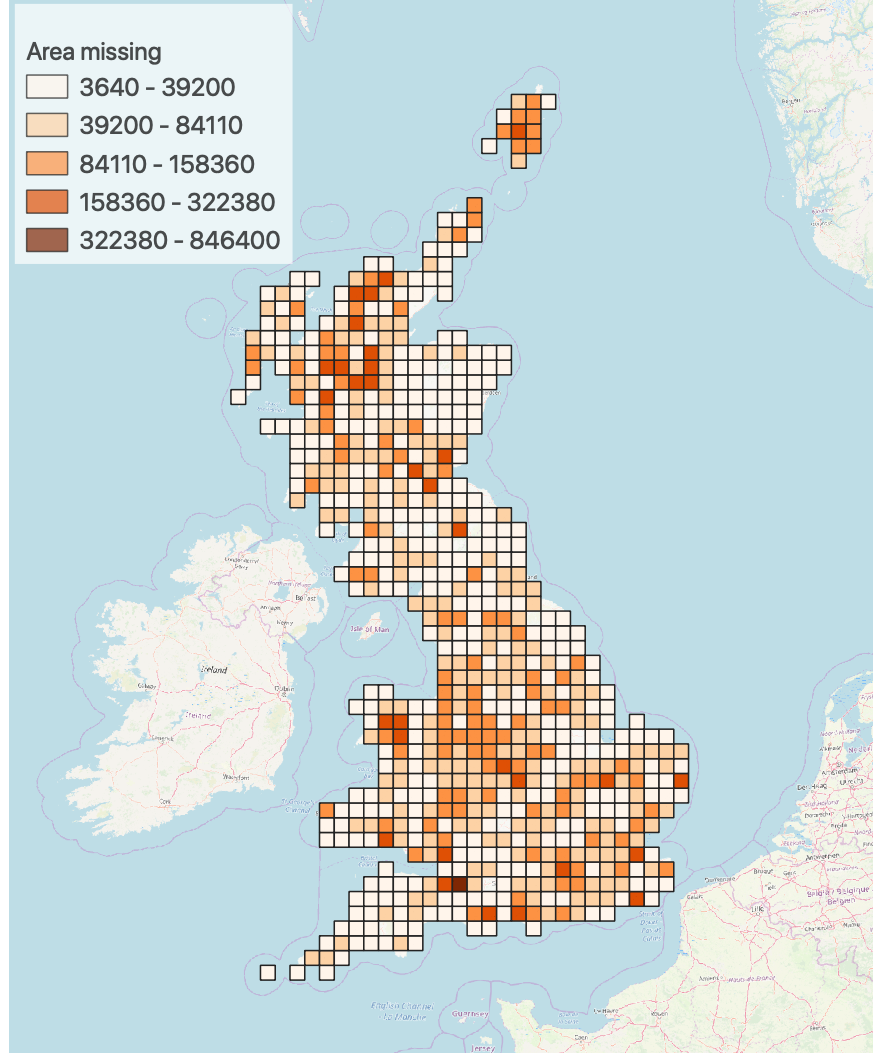
Source: Contains Global Surface Water Explorer and OS data © Crown copyright and database right (2020)