Optimising the ONS site search function with Google Analytics and Natural Language Processing
In this study, we investigate challenges related to the site search function of the ONS website and make recommendations on possible improvements. Although there is a wealth of literature on search engine optimisation (SEO), most solutions are designed for commercial websites that do not share similar goals and constraints as public sector websites. We will discuss why off-the-shelf solutions are not always suitable and where there is a gap, we explore dedicated approaches. We will report on ideas that we found promising, as well as experiments that have not led to successful outcomes. We hope that our research will inform the web analytics community and invite suggestions for new ideas.
Keywords: Search Engine Optimisation, Natural Language Processing, Unsupervised Machine Learning, Google Analytics
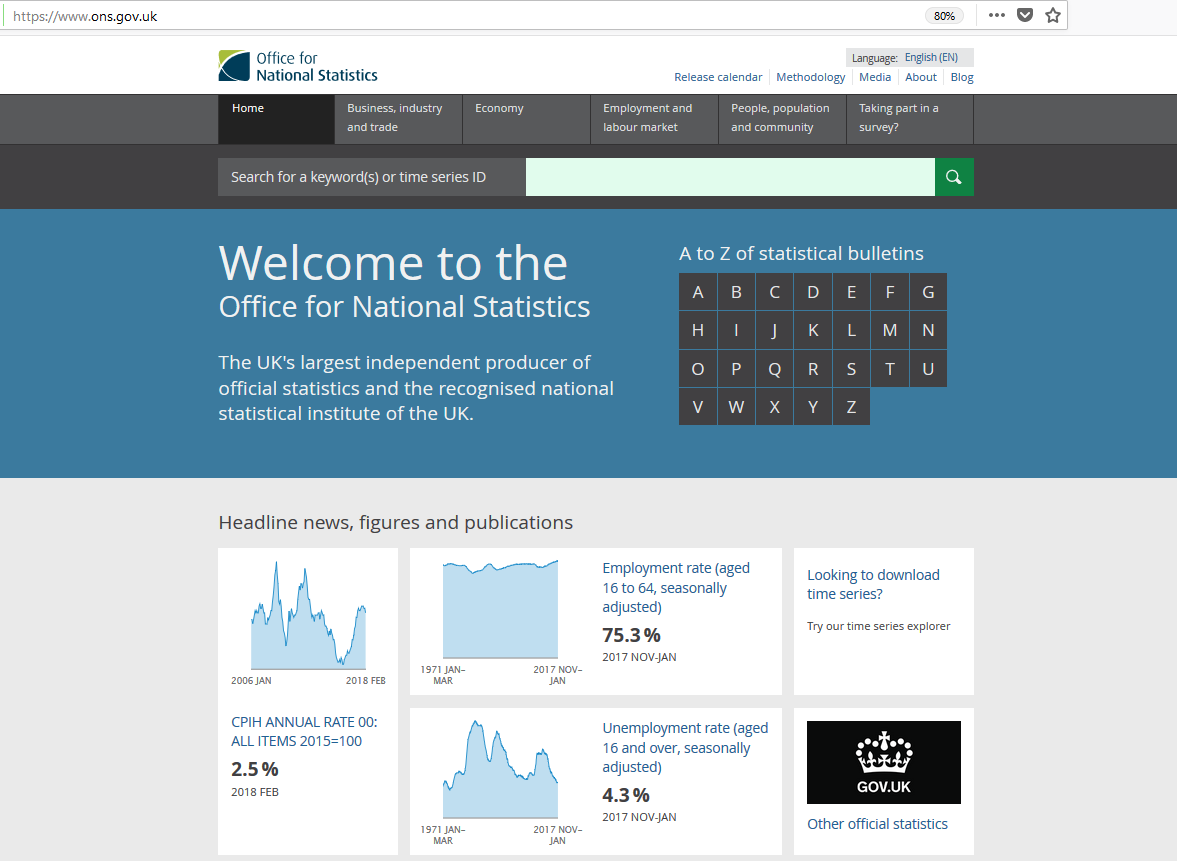
Figure 1 – The ONS website home page
1 – Introduction
The new ONS website was officially launched on 25 February 2016. This was a key milestone after months of intensive consultation with users of ONS statistics. More than 600 individuals representing more than 80 key organisations have provided detailed feedback throughout the process, testing functionality and suggesting features.
Further consultations have taken place since the launch, and it becomes clear that the site search function needs improvement. Rob Chambers, the ONS website product owner, summarises the problem as follows: “… more than 60% of traffic to the ONS website comes from Google […] It is clear that Google is our homepage and that we need to react accordingly”. As part of a wider improvement effort, the ONS Digital Publishing team have launched a project in partnership with the ONS Data Science Campus (DSC) to investigate and optimise the site search capability.
This report describes the work the DSC has undertaken to analyse site search problems and identify specific areas where data science can help. This research focuses essentially on understanding users’ behaviours and intents. The main aim is to inform ONS web developers and content designers on how to retrieve and rank search results in a meaningful way.
2 – Problem formulation
Because of the exploratory nature of the work, our study was first organised around three very broad research questions: 1) Understand who the users are, 2) Understand what problems they encounter, and 3) Understand their intent.
- Understand who the users are helps to better meet their needs. David Sullivan from the Digital Publishing team explains: “One of the greatest challenges in delivering a dedicated search functionality is to first understand the language barrier between users and the content. Here at ONS, we often find that the language we use in our publications doesn’t always match up particularly well with terms entered in our search box”. This is a common problem in SEO, and commercial websites are usually designed to speak their users’ languages. However, government organisations such as ONS adhere to official language rather than adopting users’ terminology. Thus, we need a different approach: a function that bridges the gap between styles of speech.
- Understand what the problems are implies we can tell whether a search is successful or not. Mainstream SEO usually identifies success in terms of number of clicks or number of visitors making a purchase, which indicates that they have found the right product. In the ONS context, knowing whether the users have found the information they were looking for is not obvious. To reduce uncertainty, we analysed users’ feedbacks to identify the main search problems and investigate dedicated solutions. Three problems may occur after the user enters a search: 1) The search returns no result, 2) The search returns irrelevant results, and 3) The search returns correct results but the content could be better organised.
- The third research question is probably the most challenging: understand the users’ intents. To give a real example, we have found users who search for “1kg of potatoes”. What information are they actually interested in? If the search was entered on a supermarket website, the intent would be to buy potatoes. However, on the ONS website, the intent is not to buy potatoes but more likely to find the typical price for 1kg of potatoes, perhaps to track its price over time. In this context, relevant search results would be expected to include statistics related to the basket of goods, living costs, price indices, inflation, etc., sorted by relevance so that information on potato would be displayed at the top. Our solution needs to capture the context of the search in order to correctly infer users’ intent.
In the remainder of this report, we will first describe the Google Analytics data (GA) that is used for the study. We perform the “Long-tail-of-search” analysis on various GA metrics to understand how well the site search function is currently performing. We also discuss which of these metrics could be used for benchmarking performance. Then, we investigate how data science techniques such as Natural Language Processing (NLP) and Unsupervised Machine Learning can be used to: 1) Bridge the barrier between users’ language and ONS terminology, and 2) Gain a better understanding of what content our users are trying to find on the website.
3 – Initial data analysis
At the early stages of the project we decided to query GA data and highlight areas needing attention. Hence we decided to produce a sorted frequency graph and explore the characteristics of various keywords (search phrases) that were input to our search engine during the year 2017, a total count of approximately 740,000 unique search phrases. The keyword frequency graph shows a common pattern in search engine terms that of a chunky head with search term frequency greater than two accounting for 9.5% of the total cohort, a middle section representing 10.1% and a long tail containing 80.4% of the total population for search terms occurred just once. We decided to partition GA metrics into head middle and tail sections as displayed on the frequency graph aiming to highlight patterns needing attention in those sections. The chosen metrics were query length, session duration, number of refinements, number of result views and search exits
The query length histogram demonstrates the fact that the head section consists of shorter length queries and the trend is that queries get longer as we move towards the tail. The duration box plots show that head section sessions between the 1st and 3d quartile tend to be longer and session duration decreases as we move towards the tail. The number of refinements histogram show that there are more refinements as we move towards the tail and head section queries at approximately 80% need no refinements. The final two metrics number of result views and depth are mostly associated with the ability of the search page to rank results optimally. Regarding the number of result views we can see that most users seem to find what they intended within the first page and a small percentage of 17-24% need to look at the second or third results page. Here we can see again a small but consistent trend of head section queries that need less result page views in total followed by the mid and tail section searches. Finally, the exits graph interestingly shows no consistent pattern and it seems that long tail searches demonstrated approximately 14% search exits and the head and mid sections approximately 16 and 17% respectively.
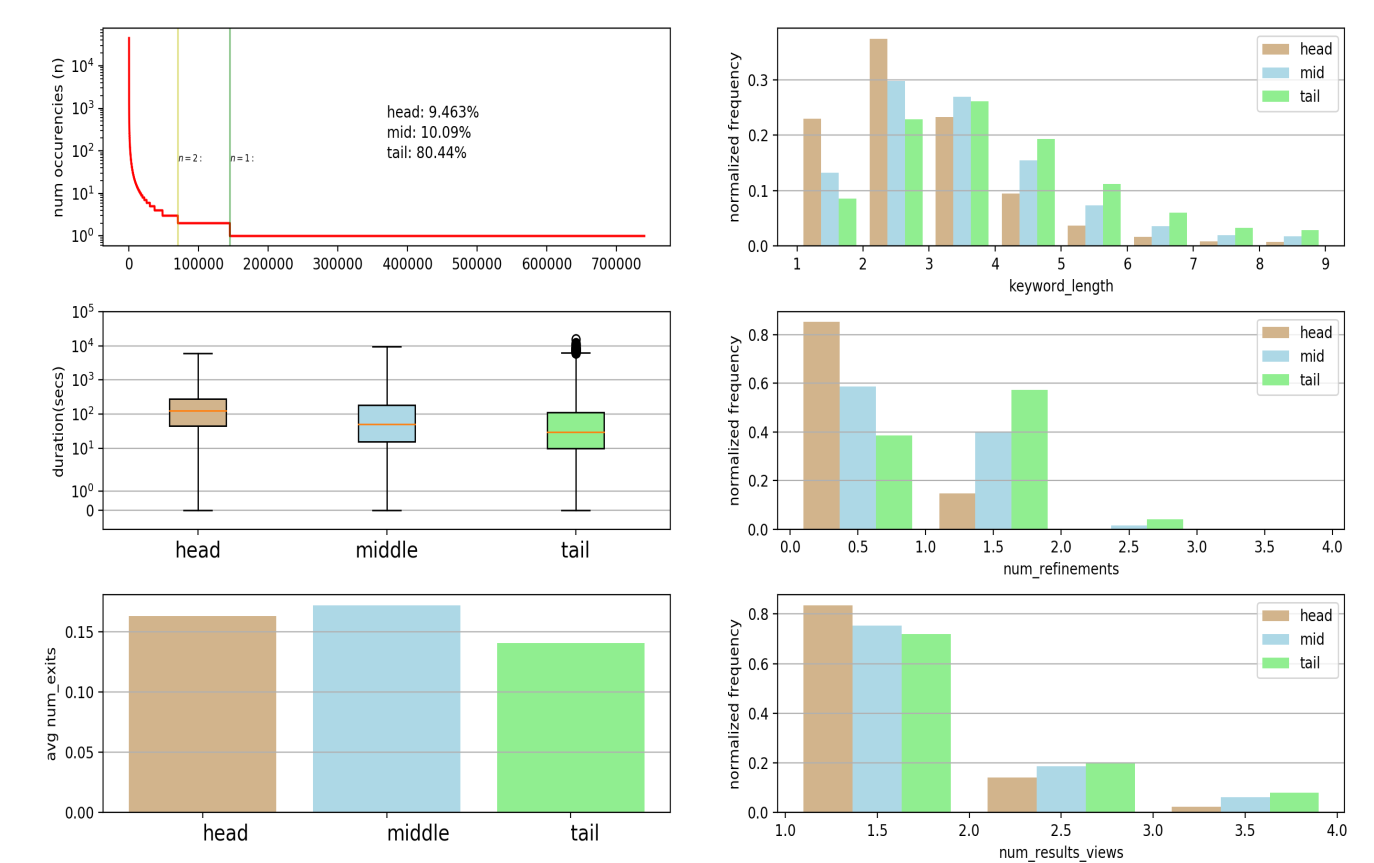
Figure 2 – A dashboard with Google Analytics metrics
The above dashboard highlights some problems and usage patterns of our search engine. We deem that it can be complimentary to the SEO efforts in order to show the impact after the launch of the optimized service. One can run the python code with different date ranges and compare and contrast the metrics a year before and a year after the launch of the new search engine service and observe the difference in respect to the above metrics. Following this introductory analysis we decided to switch focus to the most significant metric of search exits, since it is the one that demonstrates the search engine’s failure to display correctly ranked results back to the user.
4 – Search terminology and Natural Language Processing
In this section, we investigate whether we can draw insights on users’ behaviours and intents from their styles of speech. To this end, we apply data science techniques – Natural Language Processing (NLP) and unsupervised machine learning – to analyse the search queries.
Our hypothesis is two-fold. Firstly, the longer the search query, the more specific. And secondly, domain experts tend to use longer and more specific keywords, which gives the search engine a better chance to match relevant documents. In comparison, members of the public tend to use shorter and broader terms (layman’s terms), which causes problems for the search engine.
This hypothesis draws from SEO literature. In the context of a commercial website, a user who is closer to the point-of-sale tends to use longer and more specific search phrases (e.g. ‘laptop 64-bit Quad core Windows 10 with 4GB RAM 64GB Storage’). Such specific query is expected to return more relevant products compared to shorter and broader terms (e.g. ‘laptop’).
First of all, we apply descriptive statistics to examine the search terms. As shown in Figure 2, we observe that most people use short queries of up to 5 words, with more than half using 2 or 3 words. Figure 3 shows a sample of the 30 most popular search terms for the period between March and September 2017. We observe that broad terms get searched many times (e.g. London, rpi), while longer and more specific terms get searched less (e.g. London population, rpi all items index). There is also evidence of seasonality, for example, “baby names” get a relatively low number of searches over the year, except in September when the statistics were released. For a better readability of the graph, we limit the visualisation to show 7 months of data and only the 30 top most popular words, but the analysis was performed on all search queries.
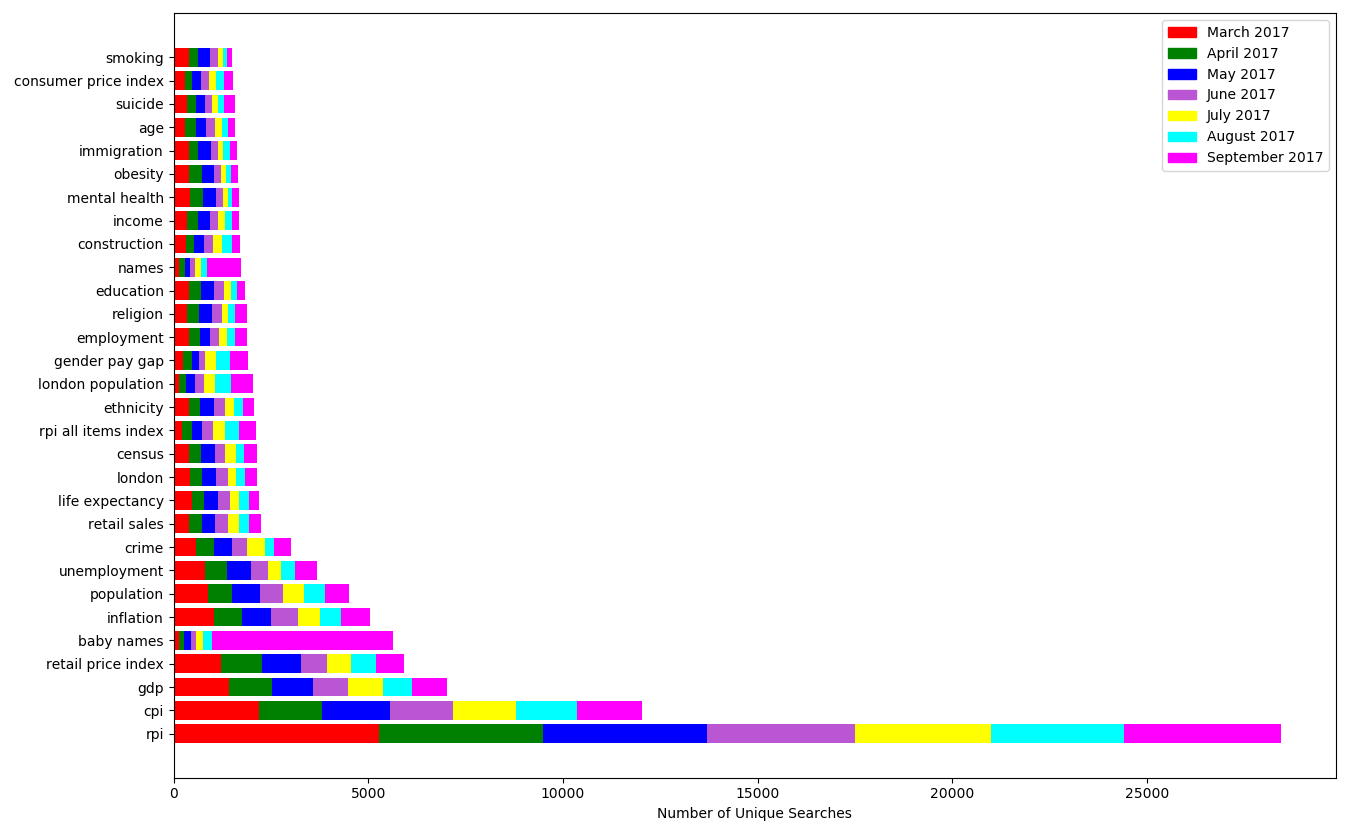
Figure 3 – The 30 most popular search terms for the period between February and September 2017
Looking at how often the generic broad terms get searched, we speculate that members of the public and occasional visitors to the ONS website employ broad terms because they don’t know exactly what to look for at the beginning, so they explore broad concepts to see what results come out, then progressively refine their terms to narrow down their searches. An interesting in-depth analysis would be to follow the users’ web journeys to see how they refine their searches, what they click on, so we can infer their intents and develop personas of different types of users.
Unfortunately, at the time when we carried out this study, we only had GA data, while a better data source would have been the log data, which was not available. Interestingly, as many technical blogs have pointed out, Google Analytics was not developed with data science in mind. One of its main limitations is that it only provides aggregates, so we have not been able to tap into the individuality of behaviours.
It would be interesting to analyse the log data in the future. But, for now, the main information available to us is the length of the search phrases and their semantic quality. Examining hundreds of thousands of unique search terms, we observe that short phrases include not only broad terms (e.g. London, cancer, unemployment) but also very specific terms such as earno2 and ROYL that are survey variables. Of equally long queries – say, 10 words – we can find specific phrases such as “public sector net borrowing excluding financial interventions”, but also phrases such as “eenagers [sic] and young adults went to the cinema most frequently” and “eu-born workers in the uk fell 50,000 to 2.3 millions”. In extreme cases, some users copy and paste entire paragraphs from news articles into the search box. Longest search queries can be up to 350 words.
Thus, the latest observations contradict our hypothesis. Although generally, longer queries seem more specific than short ones, there are frequent exceptions such that the query length is not a sufficient indicator of its specificity. Furthermore, we cannot use the query length to differentiate expert users and members of the public. Short terms such as earno2 and ROYL are very specific and show that the users are domain experts who know exactly what they are after.
One interesting insight from analysing the search phrases is that, the choice of terms determines how specific the query is, hence, it is a good indicator of the type of user. For example, a domain expert would use the term ‘gender pay gap’, while a member of the public would employ search phrases such as “female wages compared to men’s”, or also “male female salary inequality”. As they mean the same thing, we need a way to group similar terms together, such that ‘gender’ is closely related to ‘female’, ‘men’, and ‘male’; ‘wages’ is closely related to ‘salary’ and ‘pay’. This way, we can retrieve the same content regardless of the terms used. This can be achieved with topic modelling, a field within Natural Language Processing. There are two main tasks:
- We need to parse the search queries and clean it. This includes not only the basic pre-processing as explained later in section 4.1, but also a semantic cleansing to remove or substitute words that are irrelevant in the context of ONS data. This can be achieved with Latent Dirichlet Allocation (LDA), as explained in section 4.2
- We need a function to recognise synonyms and group them together. In the remainder of the report, we discuss two methods. One light-weight approach using WordNet, a popular online thesaurus, and a more complex but powerful approach using Word2vec, as explained in section 4.3
Both LDA and Word2Vec belong to the class of unsupervised machine learning models. They have been successfully used in numerous case-studies but to our knowledge, never in the context of web analytics for the UK government.
4.1 – Data preprocessing
Prior to building the models, we need to prepare the data. There are 3 types of datasets:
- Search queries: what users type into the search box. Typical problems include typos, spelling mistakes, use of layman’s terms as well as domain experts’ terms, synonyms (e.g. pay, salary, income, remuneration need to be recognised as the same thing), use of name entities (e.g. person names, organisations, locations, times, quantities, currencies, etc.)
- Training data: the LDA and Word2Vec models need to be trained such that they capture the ONS context (e.g. ‘1kg of potatoes’ relates to basket of goods rather than purchasing potatoes). For the proof of concept, a small corpus of 250 ONS publications has been chosen that cover various topics from labour market to health and wellbeing, population and economy, etc. We transfer the pdf into text using the pdfminer3k package in Python 3.
- Large text data corpora: these are large public data corpora that are representative of layman’s terminology. A good example is Wikipedia that contains 1.9 billion words in more than 4.4 million articles. Other examples include the Brown Corpus, Project Gutenberg, GoogleNews, Wiktionary, to name only a few. There is no need to download the datasets, as there exist pretrained models that can be downloaded and reused.
Both of the first datasets need to be preprocessed to remove stopwords and special characters. Further processing will be needed to convert the text into lowercases, correct typos, tokenise and apply lemmatisation (better than stemming). Then, we need to extract Part-of-Speech tagging (POS) that automatically recognise if a word is a noun, a verb, an adverb, etc. And finally, we apply Name Entity Recognition (NER) to recognise locations, organisations, and proper names. We also extract unigrams and bigrams.
4.2 – Topic modelling with Latent Dirichlet Allocation
Latent Dirichlet Allocation (LDA) was introduced in 2003 by Blei et al. It is a very popular generative probabilistic model that is the state-of-the-art in topic modelling. In simple words, it takes as input a large text corpus and automatically detects words that appear together and group them into topics. The assumption is that each document contains a finite number of topics, and each topic use only a small set of words frequently.
For our search problem, the idea is to train an LDA with ONS publications covering various topics on Economy, Labour Market, Population, Health and Wellbeing, etc. The model would recognise various topics in the text corpus and cluster together words that belong to the same topic. Unlike Kmeans clustering, LDA allows clusters to overlap, such that generic words (e.g. statistics, year, period) can belong to many topics, whereas specific words (e.g. knife, murder) would belong to only one topic of ‘crime statistics’.
We train our LDA model using the Python package gensim and use the visualisation package pyLDAVis to produce the interactive graph shown in Figure 4. If we select topic 2 (highlighted in red), the bar chart on the right handside displays words that belong to that topic. Parameter λ can be tuned to show terms that are more or less relevant to a given topic. If λ is close to 1, the graph shows words that are more generic (e.g. year, statistics, period). If λ close to 0, the graph shows only words that are specific (e.g. crime, offense, police, victim, violence, etc.).
Let us examine a typical scenario of how we can use this model to improve search. A user types a search query into the search box, say, ‘Latest regional firearms statistics in the UK’. Figure 5 shows the search result page where wrong documents are displayed. We can see that the search engine tries to match documents with as many of the words in the search query as possible. In this case, ‘regional’, ‘statistics’ and ‘UK’. It does not recognise that the keyword here is ‘firearms’, which should get more weight, while other words (e.g. regional, statistics) are contextual and should be weighted down. Our LDA model provides the means to measure the semantic significance and assign the correct weight.
Figures 6.a and 6.b show the significance of the word ‘firearm’ and ‘statistic’ within the corpus. In Figure 6.a, if we mouse select the word ‘firearm’ in the bar chart, we can see on the left hand side that the word only belongs to one single topic 7. Examining the word cluster of that topic, it seems to deal with crime statistics.
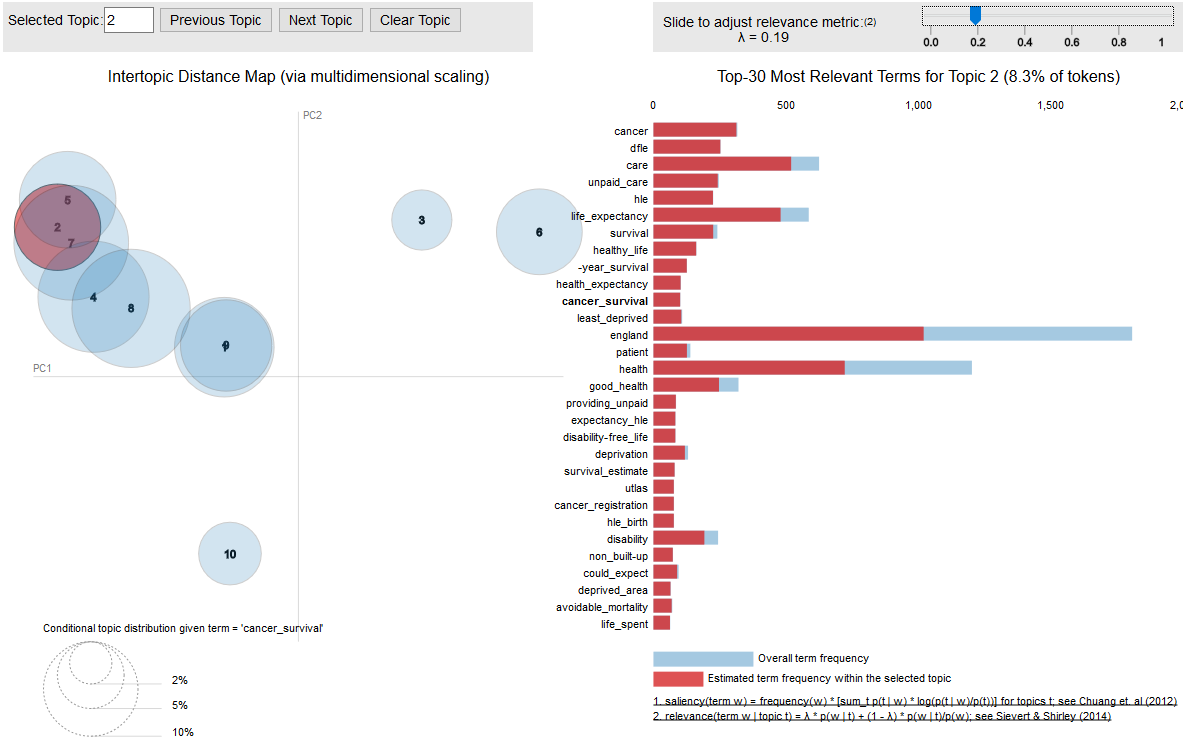
Figure 4 – Topic Modelling with Latent Dirichlet Allocation. The model was trained on a text corpus of 250 ONS publications on Economy, Labour Market, Health and Wellbeing, Populations etc. The interactive graph shows clustering words belonging to various topics.
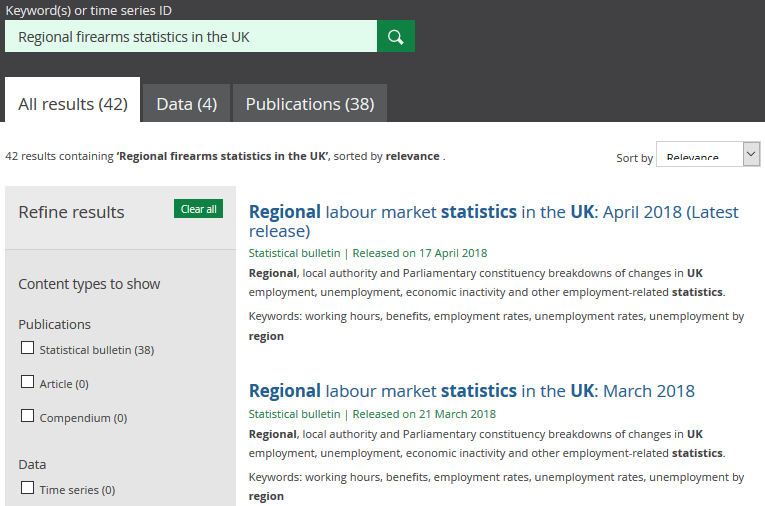
Figure 5 – Example of search query with irrelevant result
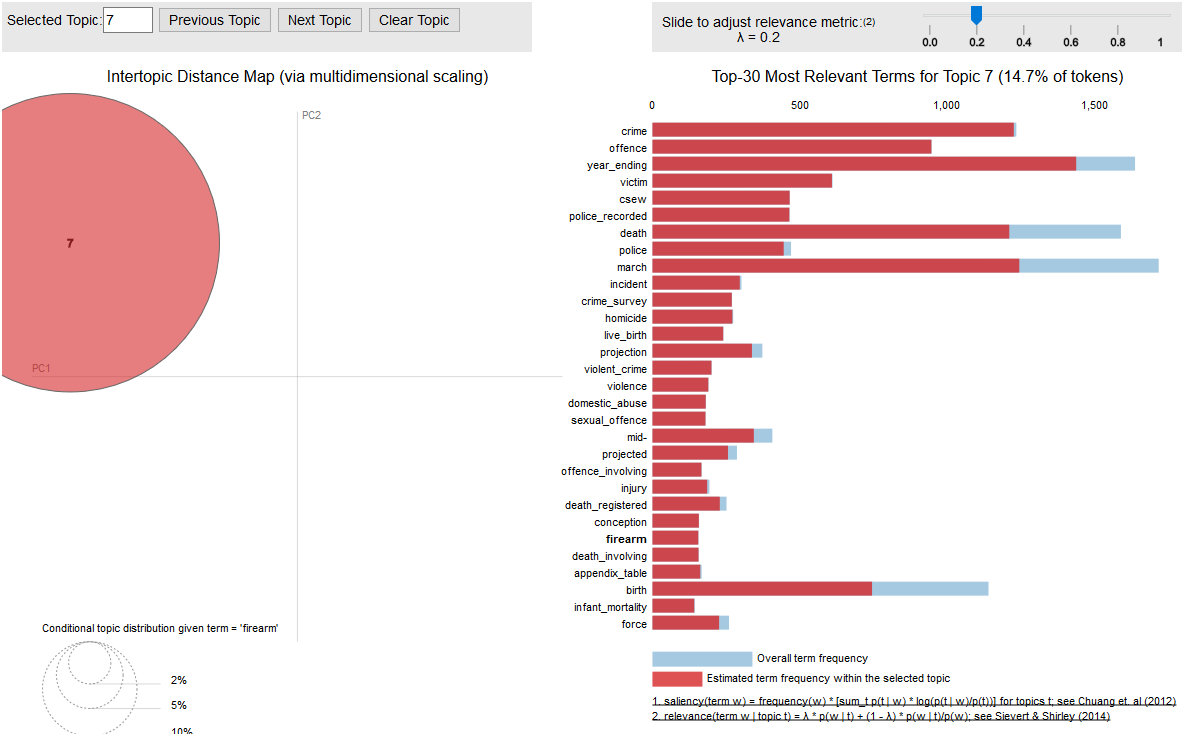
Figure 6.a – The highlighted word ‘firearm’ is specific to topic 7 on crime statistics
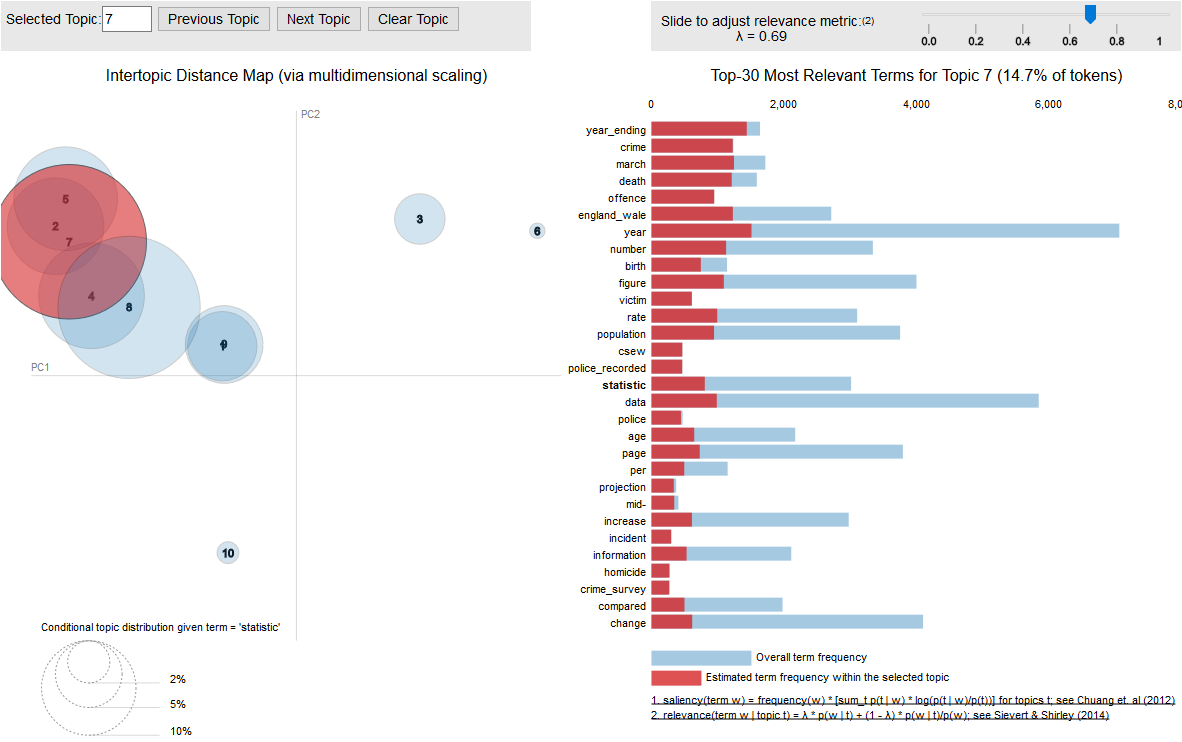
Figure 6.b – The highlighted word ‘statistic’ belongs to all topics
On the contrary, Figure 6.b. shows that the word ‘statistic’ belong to many topics. So, it is less significant, or less meaningful. Similarly, we can observe that the words ‘regional’ and ‘UK’ are also very generic, so they should all be weighted down. The words ‘in’ and ‘the’ ate stop words and should be removed from the search query. Thus, this example shows how we can use topic modelling to assess the importance of words in a search query to tailor the search result.
Another scenario where the LDA model could be used is when the search query is too vague to find a match (e.g. ‘factors behind the October improvement’). We can feed the query into the LDA model, and if it turns out none of the words belong to any specific topic, then the query is deemed too broad to find a match and we can output a message saying “Sorry we don’t have that information. Do you mean…”, and make suggestions of related information that the ONS hold. To be able to do this, we need another model – Word2vec – that can recognise similarity between words.
At the moment, we are still exploring possible solutions. The LDA model shows promising capability, but it is not production ready in the sense that it works better on some scenarios and less on others. It still requires a lot of parameters tuning before it can be deployed. As any model, the LDA has its advantages and limitations. Therefore, we explore other solutions for comparison.
4.3 – Uncover search context and intent with Word2vec
The Word2Vec model was introduced by Mikolov et al. in 2013. It is a two-layer neural network – a continuous bag of words (CBOW) and a skip-gram – that allows to reconstruct linguistic context of words by detecting how these are embedded in a text.
In this section, we discuss two ways to use the Word2Vec model to improve the ONS site search. The first application is to use the model to rank search results by relevance and make suggestions on related information. The second application is to translate layman’s terms into ONS terms. Both applications use the same model, with the difference that, in the first scenario, we train the model with ONS publications, and in the second scenario, we train it with a layman’s terms corpus.
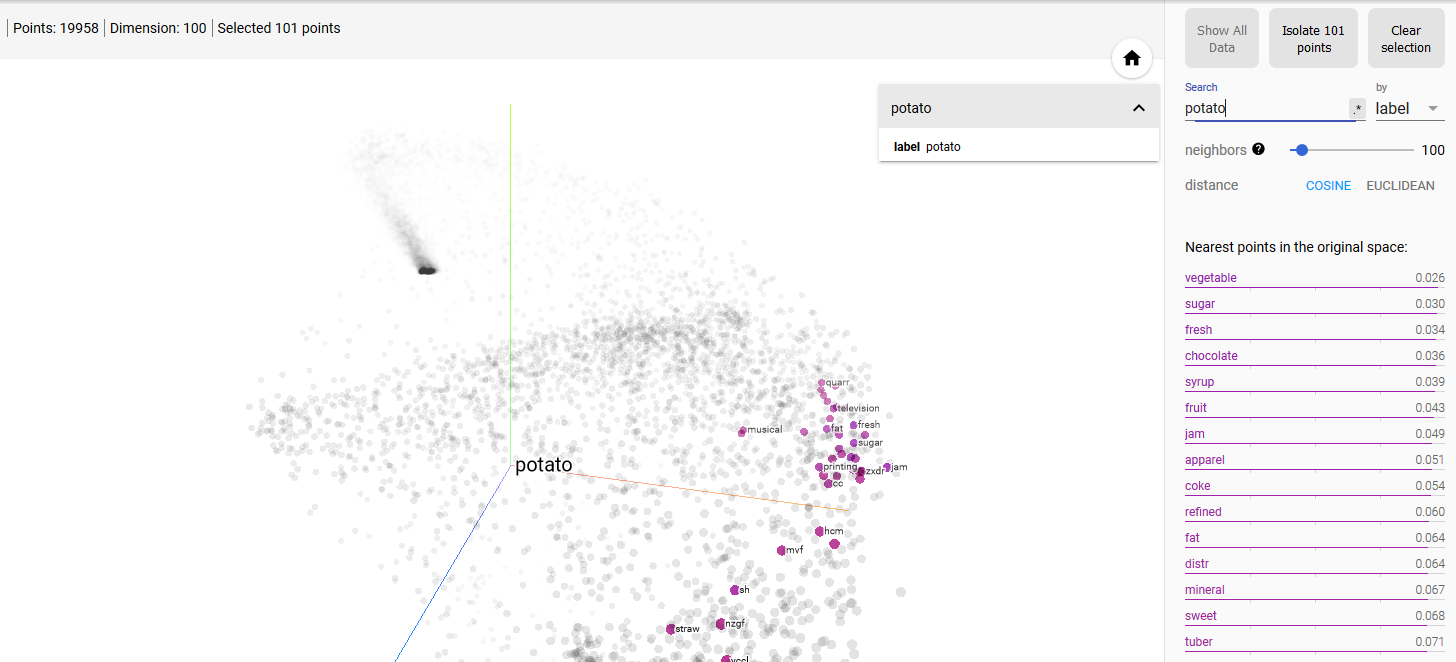
Now, let us examine the first scenario and try to rank search results by relevance. We train the model with ONS publications, using the gensim package. The model learns the linguistic context of each word in the corpus and project them into high dimensional vector space of typically several hundreds of dimensions. To visualise the corpus, we use TensorBoard. A Principal Component Analysis (PCA) and a t-distribution Stochastic Neighbourhood Embedding (t-SNE) analysis are performed, and the result is shown in a 3D graph in Figure 7.
Figure 7 – Visualisation of the Word2vec model in TensorBoard. Search result for ‘potato’
Within this vector space, similarities between words can be measured using either cosine or euclidian distances, such that we can identify the nearest neighbours of words based on their similarity in the context of ONS data. In Table 1, we show some examples of typical search terms on the ONS website and their nearest neighbours.
| ________________ | ________________ | _____________________ |
| Search terms | Top 5 nearest neighbours | Similarity scores |
| ________________ | _______________ | _____________________ |
| cpi | cpih | 0.910668611526489 |
| rpi | 0.888143718242645 | |
| inflation | 0.814201951026916 | |
| consumer | 0.791597843170166 | |
| weight | 0.775012135505676 | |
| ________________ | _______________ | _____________________ |
| murder | manslaughter | 0.945433974266052 |
| discharge | 0.933208942413330 | |
| pierce | 0.919405043125152 | |
| harassment | 0.917254686355590 | |
| acquitted | 0.910094141960144 | |
| ________________ | _______________ | _____________________ |
| unemployment | inactivity | 0.894222676753997 |
| redundancy | 0.769022583961486 | |
| employment | 0.708088994026184 | |
| graduate | 0.696786284446716 | |
| headline | 0.683894395828247 | |
| ________________ | _______________ | _____________________ |
| debt | borrowing | 0.847236156463623 |
| liability | 0.838865101337432 | |
| hcpk | 0.826269328594207 | |
| deficit | 0.821577072143554 | |
| maastricht | 0.809797525405883 | |
| ________________ | _______________ | _____________________ |
Table 1 – Use Word2Vec model to find most similar words in the ONS context. For example, users who search for cpi may also be interested in cpih, rpi, inflation, etc.
This can be interpreted as follows: users who search for ‘unemployment’ may also be interested in statistics on inactivity, redundancy, and the unemployment headline figures. This way, we can use the Word2Vec model to make suggestions “Users who search for ‘unemployment’ also search for…”. This can be used in conjunction with GA refinement metrics and log data analysis. The main difference is that GA refinement makes suggestions based on other users’ search behaviours, while our Word2vec model that has been trained on ONS publications would act as an ONS data expert chat bot to guide non-expert users what they should browse for.
For this method to work, we assume that all the words in the user’s query are known to ONS vocabulary (i.e. they can be found in the ONS publications). When a word is known, it has an associate vector in the embedding space and therefore, nearest neighbours can be found. However, it falls over when a word is not known to the training corpus. For example, we have users searching for ‘magic mushrooms in the uk’. Currently, the search result shows statistics on normal mushrooms, which is irrelevant, given the context. The problem here is two-fold. First, we need to construct ngrams so that ‘magic mushroom’ is seen as a single word. Secondly, as ‘magic mushroom’ is not a word in ONS vocabulary, we need to train a second Word2Vec model on layman’s terms corpus. This latter model should be able to recognise that ‘magic mushroom’ is closely related to the word ‘drug’, that is known to ONS vocabulary.
Of course, we use an extreme case to illustrate the concept. However, there are many cases where this approach is needed. Let’s take the example we mentioned earlier, where a domain expert would uses the term ‘gender pay gap’, while a member of the public would search for “female wages compared to men’s”, which currently does not return any result. We first tested the WordNet thesaurus from the Python package nltk to find word synonyms. It is a very light-weight solution and works well on simple words, but less well on more complex concepts. As we did not find an easy way to extend the WordNet, we aim for the more powerful approach using Word2vec trained on large public corpora such as Wikipedia. There exist many pre-trained models and tutorials in the public domain. To apply this to our example, we would use the model to find that ‘female’ and ‘men’ are closely related to ‘gender’, ‘wages’ is close to ‘pay’ and make the substitutions.
Finally, this approach also provides a way to understand what content our users are trying to find on the website, without the need for direct keyword matching as we currently do. Although this latter approach is straightforward and elegant, one can only associate so many keywords to a document. For example, some of ONS crime statistics data are currently indexed to the keyword ‘homicide’. Thus, when users search for ‘murder’ or ‘manslaughter’, there is no result even though these words appear in the body of the documents. Using the model, we would find that these words are nearest neighbours. For our proof of concept, we use a small corpus of 250 ONS publications, of which only two are related to crime statistics. ‘homicide’ is among the 100 nearest-neighbours of ‘murder’. We should obtain better result with a larger corpus.
5 – Conclusions and future works
In summary, we applied Natural Language Processing techniques to analyse the search queries that users type into the search box on the ONS website. Examination of the style of speech has allowed to differentiate two main types of users. First, domain experts who are specific in their searches, we need to take them as quickly as possible to the relevant information. Secondly, members of the public and occasional visitors to the site, who use broad terms to explore what is available, we need to guide them through the site by making suggestions on related information. In many cases, we need to translate layman’s language into ONS terminology to help the search engine.
In this study, we explore two unsupervised machine learning models – Latent Dirichlet Allocation and Word2vec – and demonstrate how they can be used to augment the current site search engine. The main improvement could be achieved by applying better weights on words in the search queries using LDA, such that we give more importance to topic-specific terms and less importance to generic terms. The Word2vec model can be used to assess relevance of search results, and as a fallback mechanism when the indexing mechanism does not work to satisfaction.
It is a long and winding road from a proof of concept to a working solution. Natural Language Processing is a relatively new field. Models require careful parameter tuning and testing. The Data Science Campus needs to work in close collaboration with the ONS Digital Publishing team if we are to bring the proposed solutions into production. LDA and Word2vec may be the right solutions, otherwise, there exist other models that we can investigate, such as FastText, TF-IDF and Kmeans clustering, GloVe, to name only a few. There is also better data sources than Google Analytics that we can exploit, such as the log data. We hope that our research informs the web-analytics community and we invite suggestions and feedbacks.