Mapping the urban forest at street level
Urban trees provide a wide range of environmental, social and economic benefits, such as improving air quality and are known to be associated with lower crime levels and greater community cohesion. In collaboration with the Office for National Statistics (ONS) Natural Capital team, we have developed an experimental method for estimating the density of trees and vegetation present at 10 metre intervals for all 112 major towns and cities in England and Wales.
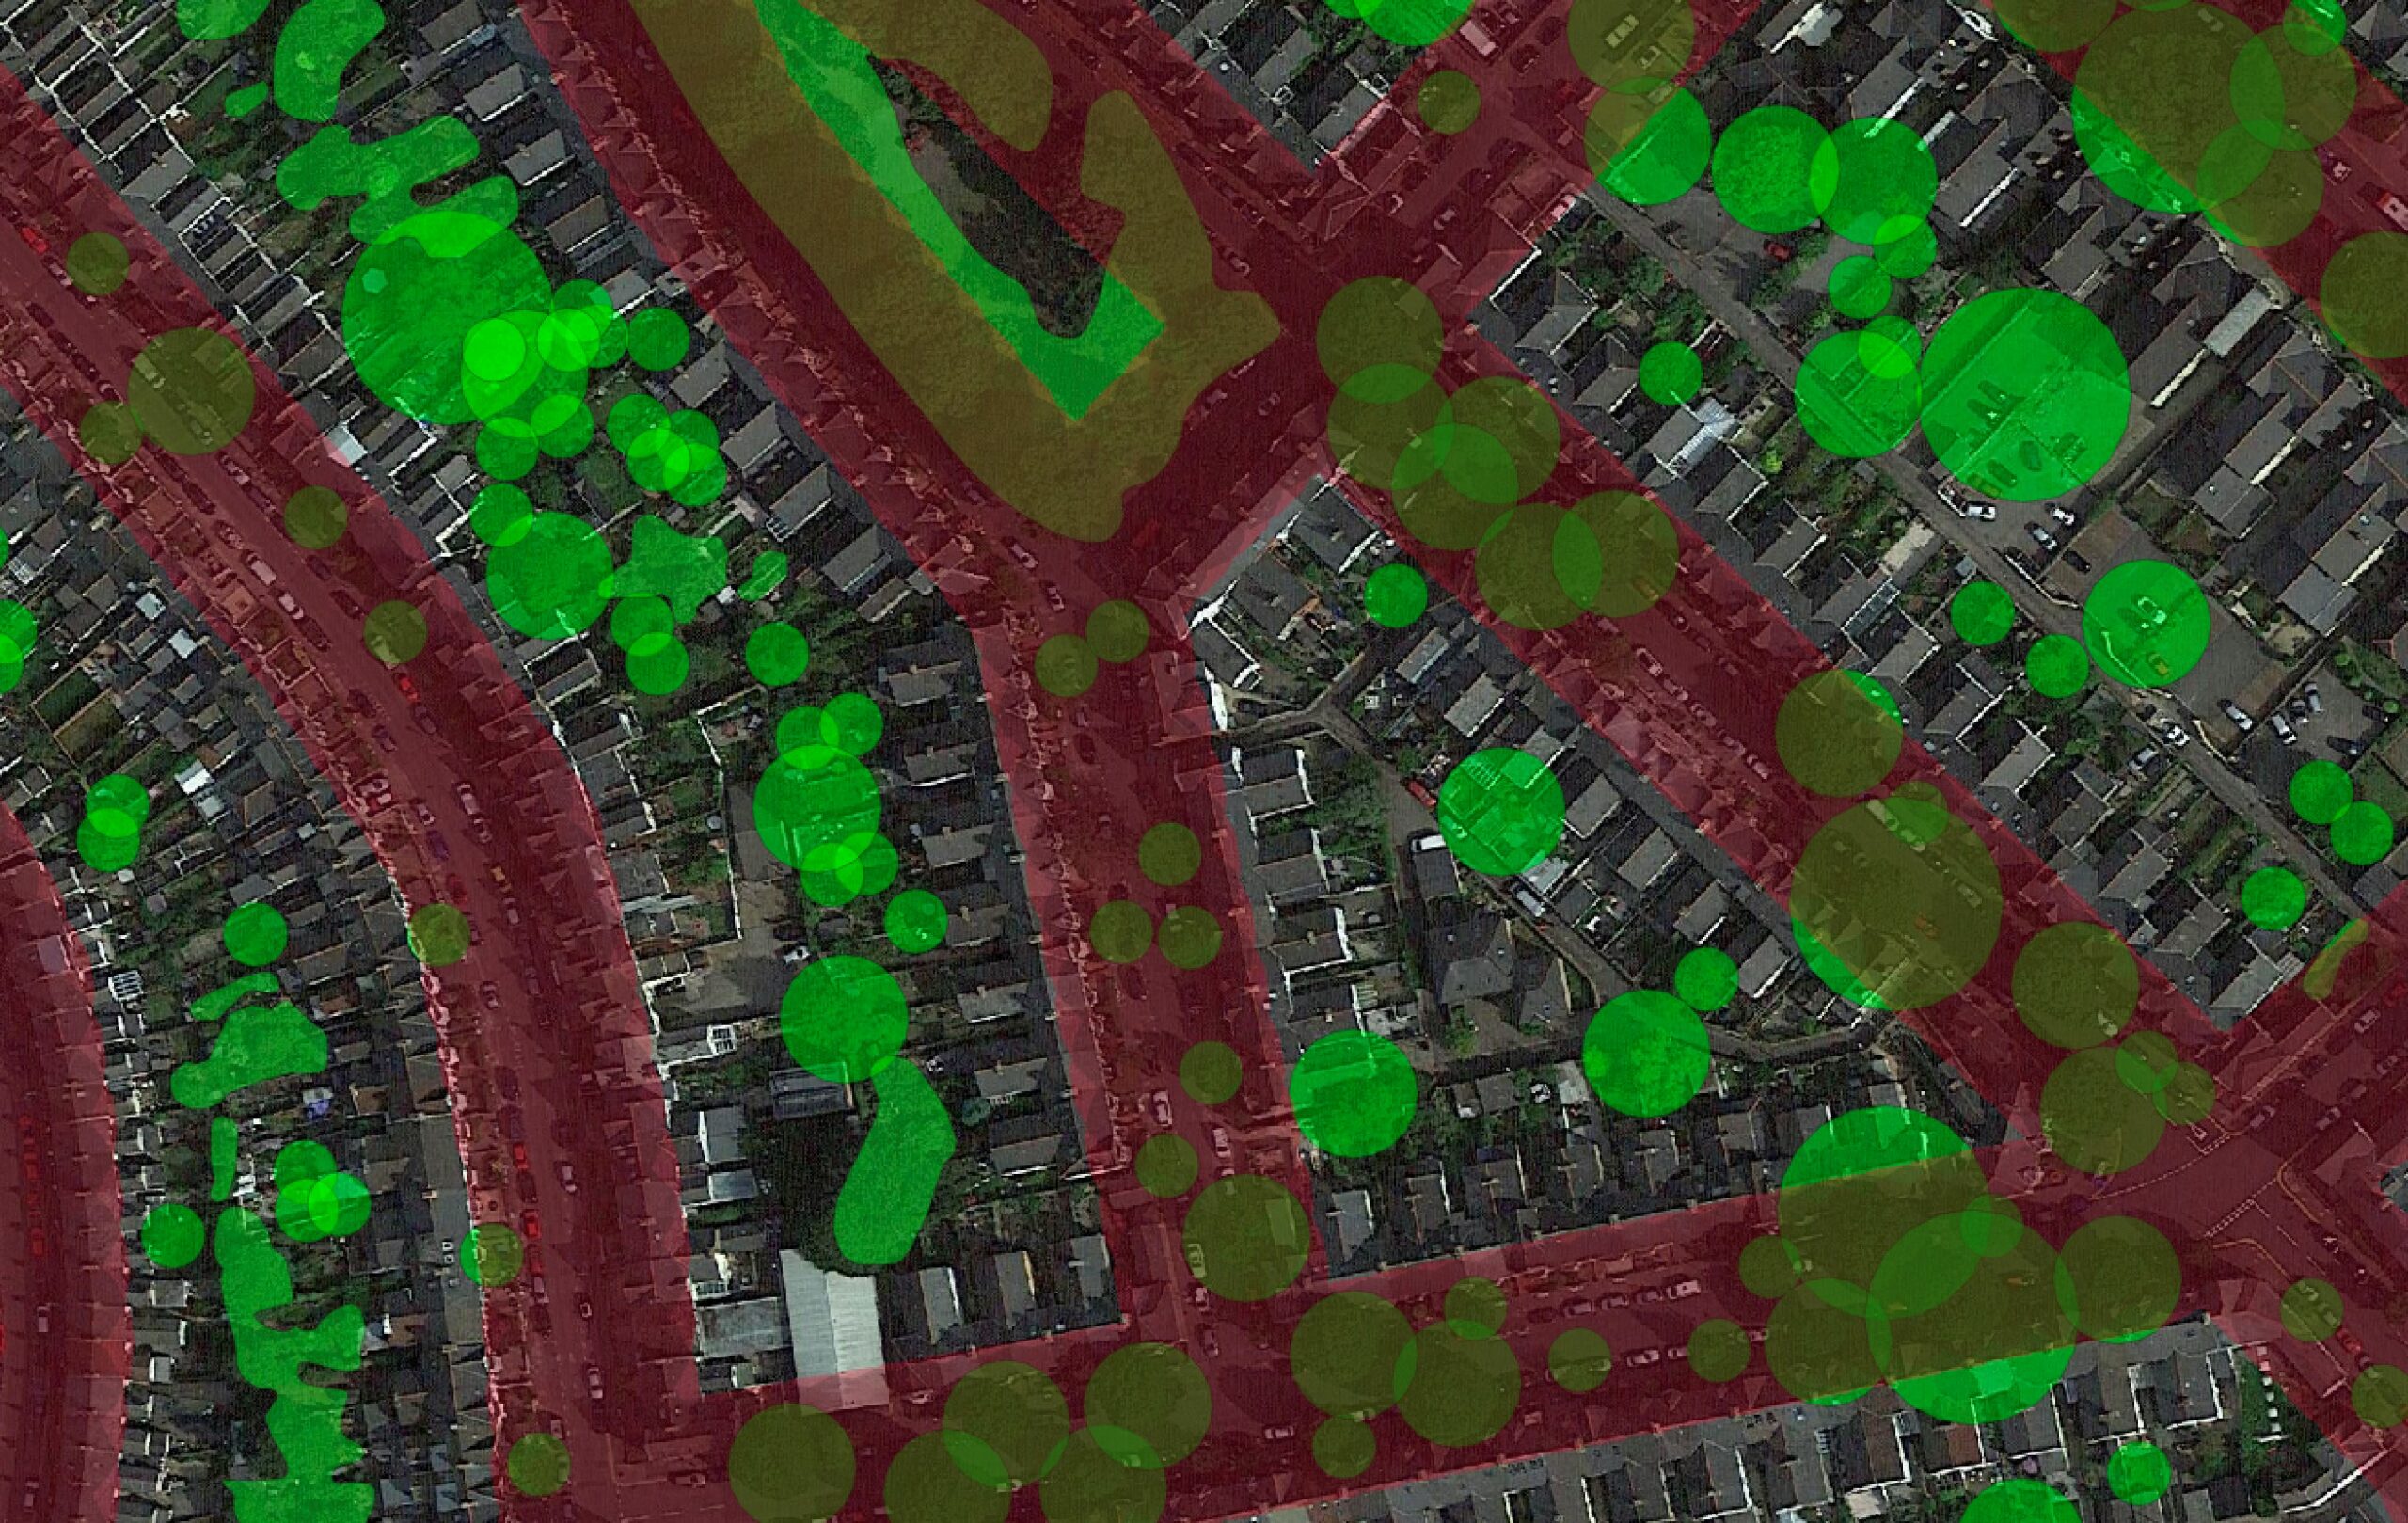
Our approach uses images sampled from Google Street View as the input to an image segmentation algorithm. This has enabled us to derive a vegetation density map by percentage, for the road network of an entire city. The developed system is built on recent advancements in the field of deep learning for semantic image segmentation.
This blog summarises the approaches in our research to establish a city-wide geospatial vegetation indicator. Beginning with attempts to identify green vegetation in arbitrary scenes, we then move to evaluate models of increasing complexity, finishing with the use and validation of deep image segmentation neural networks for visual scene understanding.
A full report with detailed findings is available, as well as the repositories via Github.
Introduction
In a recent study produced for the Office for National Statistics (ONS) Natural Capital Accounts, the UK’s trees were estimated to remove 1.4 million tonnes of air pollutants in a single year. This would result in an annual saving of £1 billion in avoided health damage costs. In another study, London’s 8.42 million trees have been estimated to remove 2,241 tonnes of pollution per year, which in addition to other services, is estimated to provide £132.7 million in annual benefits.
Our project attempts to estimate the amounts of trees in an area, by deriving a national urban vegetation index in a scalable and consistent way. We make use of an automated tree detection procedure coupled with street-level image data. The result is a consistent methodology that can be used to add value to existing tree valuation approaches, with the capability to assess urban vegetation from a remote location. Such benefits are important for policy making and urban planning.
This project has three distinct phases, starting with the development of an image processing pipeline, further development and improvements to this vegetation detection method and finally an evaluation of this using 3 case studies.
The approach
We have considered three different ways to demonstrate the effectiveness of our approach at identifying street-level vegetation.
In the first evaluation, we described three different classification techniques of increasing complexity. Metrics are also provided to demonstrate the performance of the approach, specifically in terms of its ability to identify vegetation in arbitrary images, in a non-geospatial context.

In the second evaluation, we have shown that our approach yields similar results when applied to an existing study, ranking Lower layer Super Output Areas (LSOAs) by vegetation. Besides demonstrating the validity of our prototype from a geospatial perspective, the result demonstrates a relationship between the observed density of trees at street-level and overall “greenness” of an area.

Finally, we had hoped to demonstrate a higher resolution relationship between the National Resources Wales (NRW) study and our own method by attempting to reconstruct a vegetation index by estimating visible tree density at specific points from the NRW data. Whilst we found a relationship, we note that the third evaluation methodology is flawed and would require a detailed view-shed analysis to produce more meaningful results.

Our initial attempts to address the problem assumed that the presence of green in a street-level scene would be a crude, although approximate indication of vegetation. A green pixel thresholding method based on the L*a*b* colour space was then developed as to provide a baseline or minimal viable prototype.
Whilst this technique can work well in controlled environments such as in the plant-phenotyping domain, the reliability of the thresholding technique breaks down in complex urban scenes. We attempted to refine the threshold model by parameter optimisation and later by introducing a non-linear threshold method based on a binary threshold mask derived from a random forest model.
Our best model came nowhere close to the performance of a (pre-trained) Pyramid Scene Parsing Network (PSPNet) model. We report the results of our early model and initial attempts to improve it as to illustrate the progression of this project.

Although not covered here, a significant component of this work focused on data-engineering, in which we developed an end-to-end distributed image processing pipeline, API and geospatial backend. During that phase we were faced with a number of technical challenges relating to the scalability of the approach.
Perhaps most significantly, we would require 80 million images to sample the entire UK road network. As such, the intention of the L*a*b*-based threshold method served its purpose well as a minimum viable product.
Details of our image processing pipeline and associated code have been published on our Github page.
Summary and future work
The performance of the PSPNet in terms of its ability to identify vegetation is somewhat remarkable given the fact that the model used here had previously been trained on a completely different dataset. Furthermore, we only consider the use of the model as a binary vegetation classifier: the pre-trained model can segment a scene into many classes.
The pre-trained model used in this evaluation represents a high-quality benchmark for future work to improve on. We hope to focus later iterations of the work on tree species identification.
One of the most exciting outcomes of this project has been the creation of a high-resolution dataset describing the observable vegetation density at 10-metre intervals across an entire city, in this instance, Cardiff (220,000 sample points).
We have also sampled Manchester, Newport and Walsall with partial samples of another 108 cities. Having deployed our prototype image processing pipeline, our dataset is improving daily.
We are now able to describe, in detail, the visual components of a city in high resolution, including building density, number of cars, bicycles, people, signage, street furniture and various other objects describing an urban scene. This is a highly interesting geospatial dataset from which we aim to produce a textual representation of towns and cities.
We plan to extend this approach to form a topological description of a city, combining the quantitative information (for example, percentage vegetation) detected at specific locations with abstract descriptions derived from image captioning techniques.
Beyond the production of this dataset, our work is intended to be of use in the urban-analytics domain. The NRW report used for comparative purposes in this article, describes a relationship between urban green-space and levels of deprivation including health, income and presence of crime. There are numerous studies linking green space to various social, environmental and economic indicators. Exploring the relationship between green-space (and other features), from the point of view of a pedestrian and other factors, such as indicators of well-being, offer an exciting direction for future research.
Read the full report here.
One comment on “Mapping the urban forest at street level”
Comments are closed.
I really am excited that this data is being produced about the Urban environment. In my locality approaching the top of the very exposed Pennines the few older gnarled trees are stunted. The ones existing in peoples larger gardens seem to flourish. Perhaps they are less exposed to the winter and summer blasts we get fairly constantly.
But this summer has been better than usual or so it seems.
I can’t wait to extend the treeline to the “desert” so close to my location that is the top of the Pennines which was burning this summer.