Guest blog: Is loneliness associated with movement for education?

Earlier this year, the Office for National Statistics (ONS) and The Jean Golding Institute ran a data competition, asking participants to put forward a research question related to loneliness and movement for education. They attempted to answer it using our Loneliness Prescription Index, alongside other data sources.
The winners, Nina DiCara (Bristol University) and Tiff Massey (Ernst and Young), created novel metrics looking at the relationship between loneliness and movement for education and developed a ‘school desirability score’ (SDS) to model the quality of schooling in each area.
Is loneliness associated with movement for education?
Recent research has shown that loneliness is a common underlying factor for many illnesses and, whilst a direction of causality has not been established for this association, it has prompted an increased interest in understanding loneliness in our population.
The ONS Data Science Campus has developed a ‘Loneliness Index’ which determines the levels of loneliness associated with each GP practice in England, using prescribing data for loneliness-related illnesses. This data is available for the years 2016 to 2018.
The data challenge by the ONS and the Jean Golding Institute at the University of Bristol tasked us with exploring whether there was an association between the Loneliness Index scores and movement for the purposes of education.
Details of the datasets and code used in this report can be found on our GitHub repository.
Why do people move for education
To develop our research question, we first considered the main reasons why people move for education:
- Undergraduates (individuals) move en-mass to new places from August to October every year. 19-year-olds represent the highest movement of people every year for this reason.
- Families with under 4s will move to new catchment areas to apply for new schools.
- Families of 10 to 11-year-olds (& siblings) will also move to new areas for better secondary schools.
- Children will move as individuals to boarding schools at primary or secondary age.
- Other individual moves may occur throughout adulthood to pursue educational opportunities.
Bearing this in mind, we assumed that in most cases, movement for primary and secondary education is associated with upward social mobility. That is, moving to try to get into a better school than is available in the local area.
Using this assumption, we decided to pursue the following research question, which is concerned with the movement of primary and secondary school children, and their families:
“Is community-level loneliness associated with the quality of local schools, and how far can this be attributed to the movement of families pursuing upward social mobility through education?”
The data we used
To answer our research question using open data we decided to create two new metrics:
- School Desirability Score (SDS)
- Mobile School-Age Population
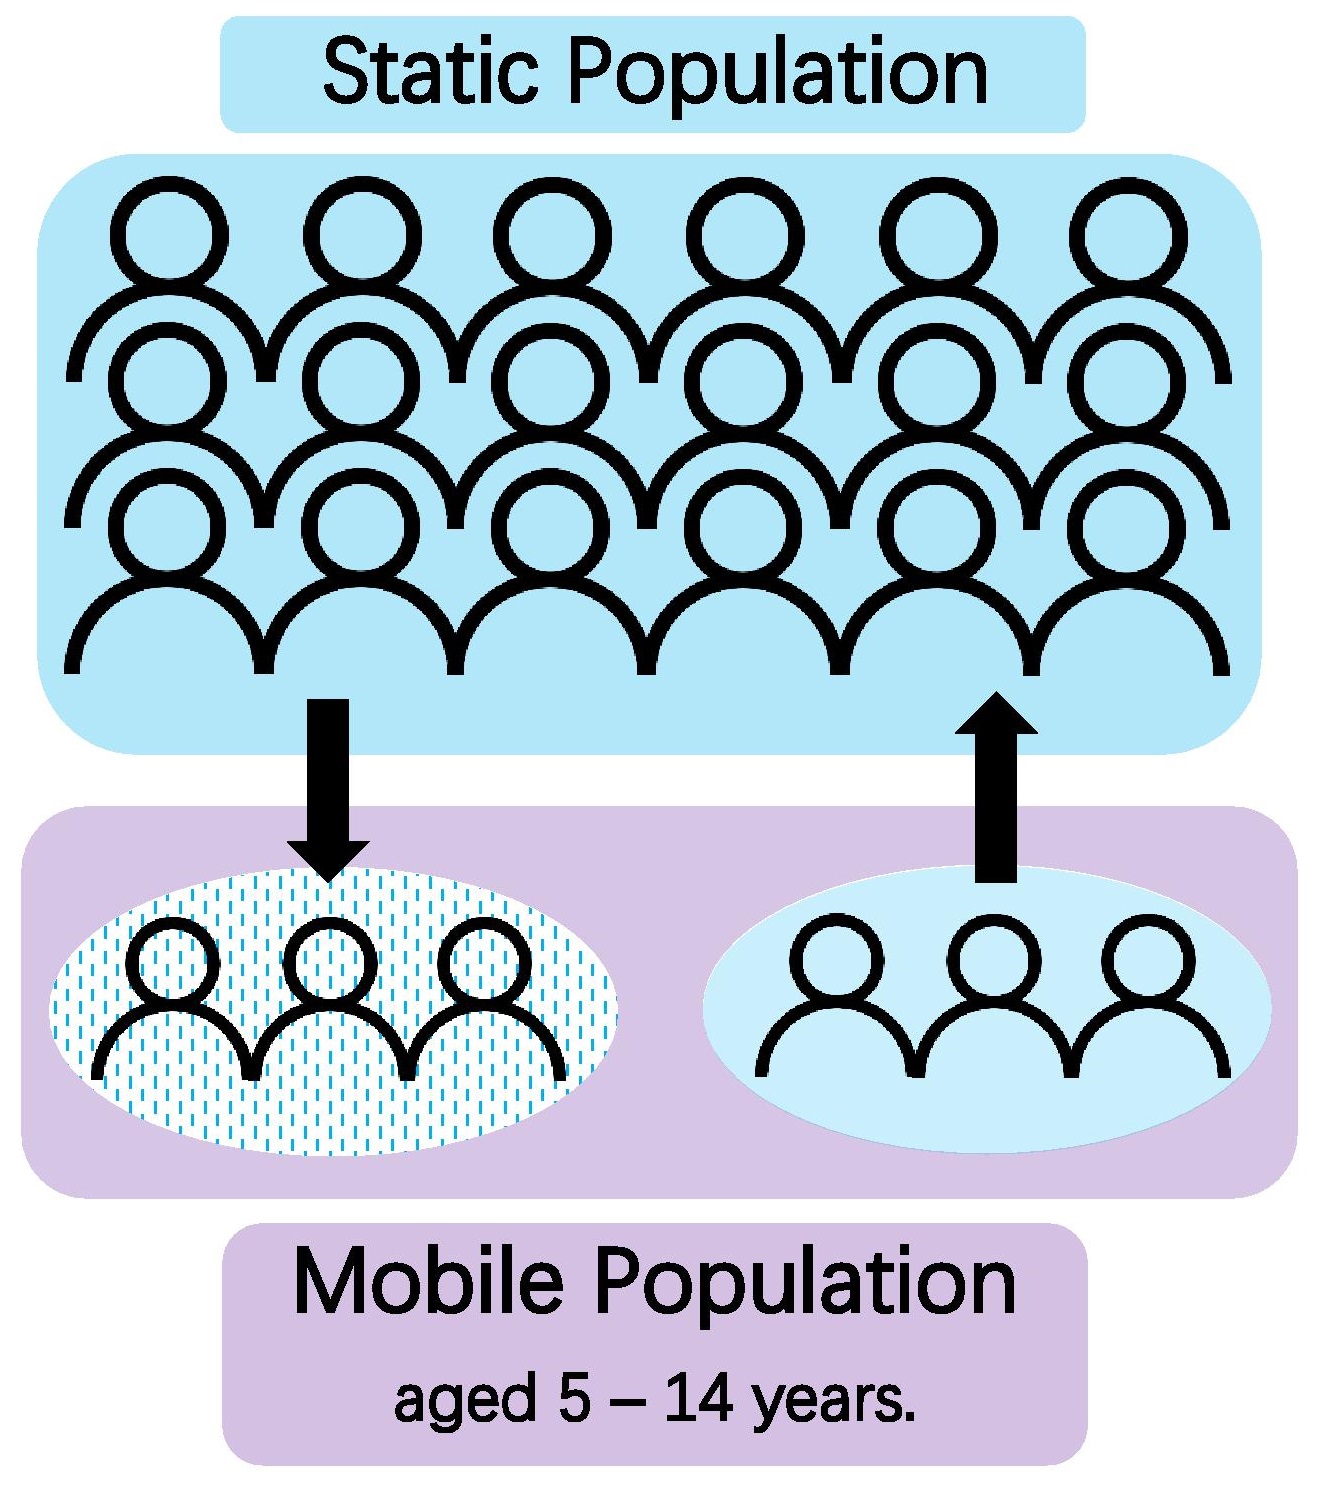
The first concern was how to model the movement of people so that it was representative of movement for education. We theorised that if loneliness was being created by frequent changes in communities due to very good or very poor education in the local area, then the net migration score would not represent this. For instance, if half the population moved away, and an equivalent number moved in the net migration would be zero, despite there being a huge change in the community. So, we decided to model population change as the sum of the inflow and outflow of people, against the total population.
In order to capture those moving for primary and secondary education, in Figure 1 we decided to consider the movement of just 5 to 14-year-olds. We did not include 14 to 19-year-olds as this would capture the huge volume of people moving to university each year.
Figure 1: Static Population and Mobile Population
Next, as shown in Figure 2, we developed a ‘School Desirability Score’ (SDS), to model the quality of schooling in each area. Using the open data available we identified four variables which may relate to the quality of education, and thus its desirability. We standardised the variables, and then combined them to create an overall SDS for each school, and thus an overall score for each Local Authority.
Figure 2: School Desirability Score (SDC)

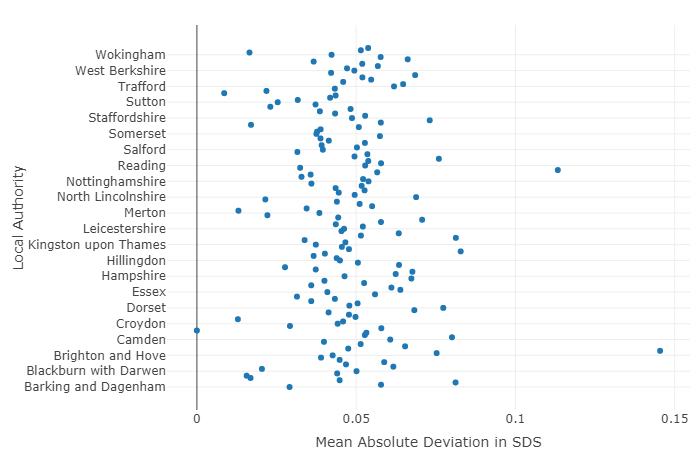
To demonstrate how these scores can be used to describe features of a local authority, Figure 3 shows the Mean Absolute Deviation (MAD) in SDS within Local Authorities, to give a sense of which local authorities experience a greater range of educational opportunities within their borders.
Figure 3: Mean Absolute Deviation in SDS
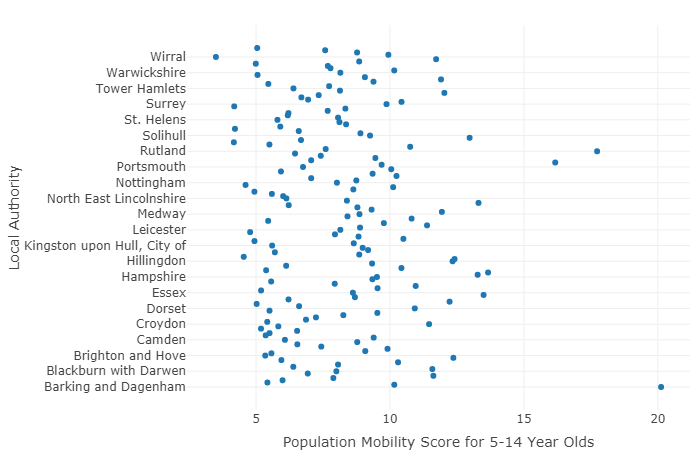
Then, in Figure 4 there is an overview of how the population mobility varies between local authorities. You can see that some local authorities experience much more movement of young people relative to their populations, for instance Barking and Dagenham.
Figure 4: Population Mobility Score for 5 to 14-year-olds
After producing and exploring these metrics, as shown in Figure 5, we were interested to know whether Population Mobility could be explained by SDS. A linear regression model of this relationship (with three outliers removed) shows that whilst there is a significant (p < 0.005) positive association between these variables, SDS only explains a very small amount of the variance in population mobility.
Figure 5: Population Mobility in 5 to 14-year-olds

So, is loneliness associated with movement for education?
Prior to analysing the relationships between our scores and loneliness we mapped all the data to Local Education Authorities (LEAs) and removed some influential observations from the dataset. Particularly influential results came from areas with population mobility and/or loneliness.
| Year | LEA Name | Loneliness Z-Score | Population Mobility | |
| 10568 | 2017 | Haringey | 0.3867285 | 13.273162 |
| 5395 | 2016 | Cheshire East | 27.3296090 | 5.194764 |
| 2053 | 2016 | Devon | -0.8026450 | 8.345841 |
| 9840 | 2017 | Leicestershire | 0.6644672 | 8.881329 |
| 9837 | 2017 | Rutland | 0.8564040 | 17.733192 |
Since we only had all the data we needed for 2017, we only included 2017 data in the analysis.
Following removal of influential outliers, initial data exploration showed some interesting results that we were not expecting.
For instance, that loneliness and the Index of Multiple Deprivation (IMD) score were not associated (p = 0.80, R2 = 0.000009), and neither were SDS and IMD (p = 0.45, R2 = 0.00008). We were expecting IMD to play an important role (positive or negative) in loneliness but were interested to find this was not the case. It did quickly become clear, though, that Urban/Rural classification was very relevant to loneliness.
Linear Regression Models
In Figure 6, we explored the use of our new measures by running linear regression models of the loneliness z-score developed by the ONS against the SDS and the population mobility for 5 to 14-year-olds. We found there was a small but highly significant association, with both the SDS (p < 0.001, adj R2 = 0.001) and population mobility scores (p < 0.001, adj R2 = 0.01).
Figure 6: Loneliness Z-Score

This suggests that the movement of school-aged children, and the educational quality available, have an impact on the loneliness in an area. It makes sense that these factors only explain a small amount of the variance, since a huge number of factors impact on loneliness in any one place, but the significance shows that movement for education may play a part.
Multiple Regression Model
First, we ran the following multiple regression model:
Loneliness Z-Score ~ SDS*Population Mobility + IMD + Urban/Rural + LEA Population
We still saw that population mobility is highly significant (p < 0.001) with a small positive association, whilst SDS is no longer significant (p = 0.097). Urban/rural appears to exert the most influence on the model, which again suggests that whilst movement for education is important, it is not the most important factor in area-level loneliness. The adjusted R2 of this new model was 0.03.
Hierarchical Mixed-Effects Model
Next, we wanted to account for the hierarchical data structure that is inherent in the data we made, where GP level information is nested within LEAs. Here the data from 2016 was reintroduced. To manage this, we built a linear mixed model, with random effects that accounted for the nesting structure of GP within LEA. An ANOVA on the nested vs un-nested structure showed that the nesting structure was significant, so we produced the following:
Loneliness Z-Score ~ SDS*Population Mobility + (1 | LEA / GP )
This model showed us that when random effects are accounted for in the model, the Population Mobility is still a significant addition to the model (t = 15.20), with a small positive association between mobility of 5 to 14-year-olds and loneliness. SDS is once again not significant in this model.
The intra-class correlation coefficients for the groups are given below:
| Group | ICC |
| GP with LEA | 0.66 |
| LEA | 0.17 |
These show that the groupings are fairly ineffective for LEAs, but moderately effective for GPs within LEAs.
Decision Tree
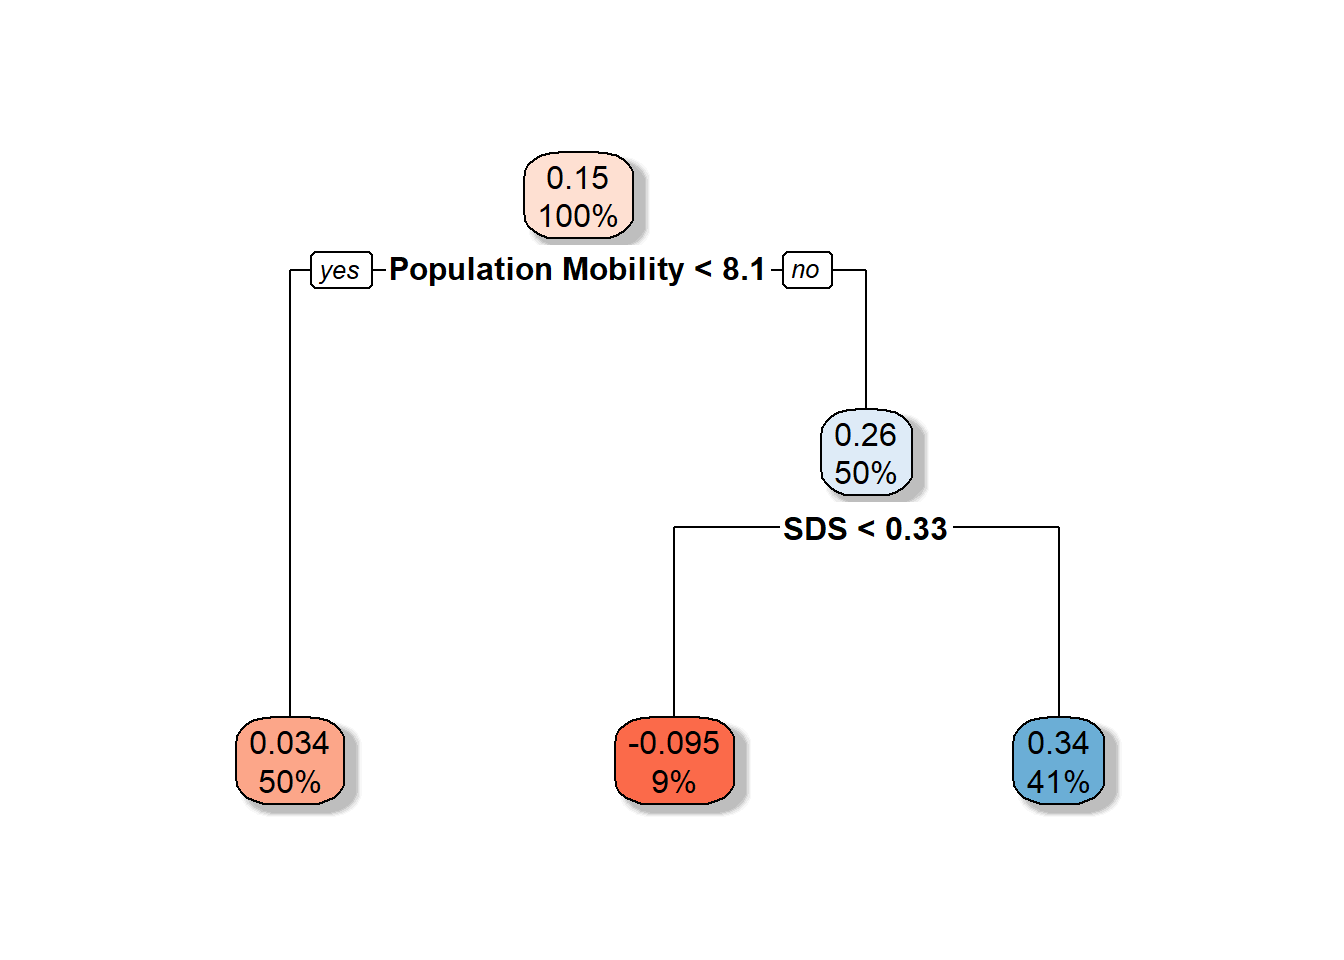
Finally, we modelled the data using a decision tree. We were interested in how the decision tree would use the Population Mobility data and the SDS to make decisions on grouping loneliness in the data set. We ran the following model, using data aggregated to LEA level for 2017:
Loneliness Z-Score ~ Population Mobility + SDS
The decision tree has two levels, which correspond to the two variables. As shown in figure 7, for Local Authorities with Population Mobility less than 8.1 (which is around the mean), loneliness is relatively close to the population average. For those with high Population Mobility (above the mean) and better SDS scores loneliness appears higher than those with poor SDS scores.
Figure 7: Population Mobility < 8.1 and SDS < 0.33
So, in conclusion…
We have explored several models and created novel metrics to explore the relationship between loneliness and movement for education.
We found that the population change caused by the moving of children aged 4 to 15 has an impact on loneliness in communities, though not a big one. We could hypothesise that the reason that children of this age move mostly to pursue better educational opportunities and so movement for the purpose of education in primary and secondary students is associated with loneliness.
The decision tree suggests that places with ‘better’ schools (higher SDS) who experience high turnover of children, are more likely to be lonely than those with low turnover and those with high turnover and poorer schools. This would support our hypothesis that families moving into areas with better schools for upward social mobility through education creates more loneliness in those areas.
What’s next?
We think it would very interesting to fully model the flow of people within the UK using metrics such as Population Mobility and a form of education desirability for all levels of education to get a better understanding of this phenomenon.
However, there are some limitations in this open government data that would need addressing:
- The measures used for the Loneliness Index are highly associated with age-related diseases and mental health, which are in turn affected by poverty, local government spending and location specific variables, such as NHS trust prescribing policies.
- We decided not to include undergraduates since they often stay registered at their home GP, so measuring GP prescribing may not be accurate for their population.
- No information is publicly available on where people have moved to or from, only the inflow and outflow from each area.
- Movement within boroughs (i.e. to new catchment areas) may have as significant an effect on loneliness as movement between Local Authorities but there are no figures for this data publicly available.
For code and data please see our GitHub repository.
Authors
Nina DiCara, Bristol University
Tiff Massey, Ernst and Young