Developing a Loneliness Prescription Index

The Data Science Campus is working with the Social Analysis Team in ONS to generate a fast indicator of loneliness levels in England at map scale.
This will help us to better understand loneliness in England, and in particular, the differences between regions.
Loneliness is an internal feeling, that a person experiences when there is a mismatch between their desired level of social interaction, or emotional support from others, and the amount they actually get. Humans are social creatures; most of us need social support and interaction from others to stay happy and maintain emotional wellbeing. Some people don’t need much, or any at all and that’s fine, whereas some people need a lot and that’s fine too. It’s not about how many friends a person has, or how many people they are connected to.
Loneliness arises when a person’s required level of social interaction is not met. In the short-term loneliness is not a bad thing, most of us have experienced it at some point in our lives. It’s a normal emotional and physical response when a person’s social interaction or support levels are not at the level they need. In an ideal situation, the feeling of loneliness drives a person to seek out more social support and interaction in the same way hunger encourages us to eat or tiredness to sleep. Unfortunately, it’s often not that easy; it can be hard to know how to find those connections, for example when moving to a new place or when spending a lot of time as a caregiver. This is when loneliness can become a problem.
There are several things that make it more likely for a person to be lonely, such as being a caregiver, living alone, having a long-term disability, or having moved for work. When a person is lonely for a long time it can increase the risk for some medical conditions such as Alzheimer’s disease, depression, high blood pressure, and insomnia.
What are we working on?
We chose to generate an outcome-based loneliness index using open prescription data rather than a risk factor index as it enables the effects of interventions to be investigated in a more timely manner. Open prescription data lists medicines, dressings and appliances prescribed by NHS England primary care facilities, including General Practices (GPs), each month. These data don’t include any information about the person it was prescribed to, but are averaged for a whole GP practice. The data being monthly is a real bonus, as it enables investigation of seasonal effects. Many risk factor measures are only collected every 10 years during the census. Another useful feature of open prescription data is that these data are available for the last 10 years, allowing the investigation of historical patterns if needed.
Compiling the index
The index allows us to see how different GP practices compare to the English average for five conditions where loneliness has been shown to be a risk factor – Alzheimer’s, depression, high blood pressure, anxiety and insomnia.
When we take all the index values together we notice a general pattern: GP practices with high index values tend to be located near to other GP practices with high values and vice versa. There appear to be geographical patterns – hot spots and cold spots – in prescribing for loneliness related conditions. Hot-spots and cold-spots are geographically concentrated groups that either prescribe at a higher rate than the English average, or at a lower rate.
Verification against known risk factors
If the “Loneliness Prescription Index” is reflective of loneliness levels it should be related to known risk factors for loneliness. It should be higher in areas where a higher proportion of people live alone, or lots of people are caregivers, or where there are greater barriers to housing and services, income is lower, the living environment is poorer, and where crime is higher. Once each category of loneliness related prescriptions had been shown to be related to one of the related factors they were included in the overall index of loneliness.
An index was created for each condition by standardising the proportion of a practices prescriptions that were given for the condition relative to the levels in other practices (into z scores). The index for each condition had a value that was negative if prescribing was lower than typical and positive if it was greater than typical. The loneliness index is generated by summing together these standardised-scores for each condition. The loneliness indicator was verified by comparison to levels for risk factors; these explained 9% of the variation in the index for different parts of England. “Living alone” and “barriers to housing and services” each independently drove around 1% of the variation in the Loneliness Prescription Index.
Does the population type affect average levels of the Loneliness Prescribing Index?
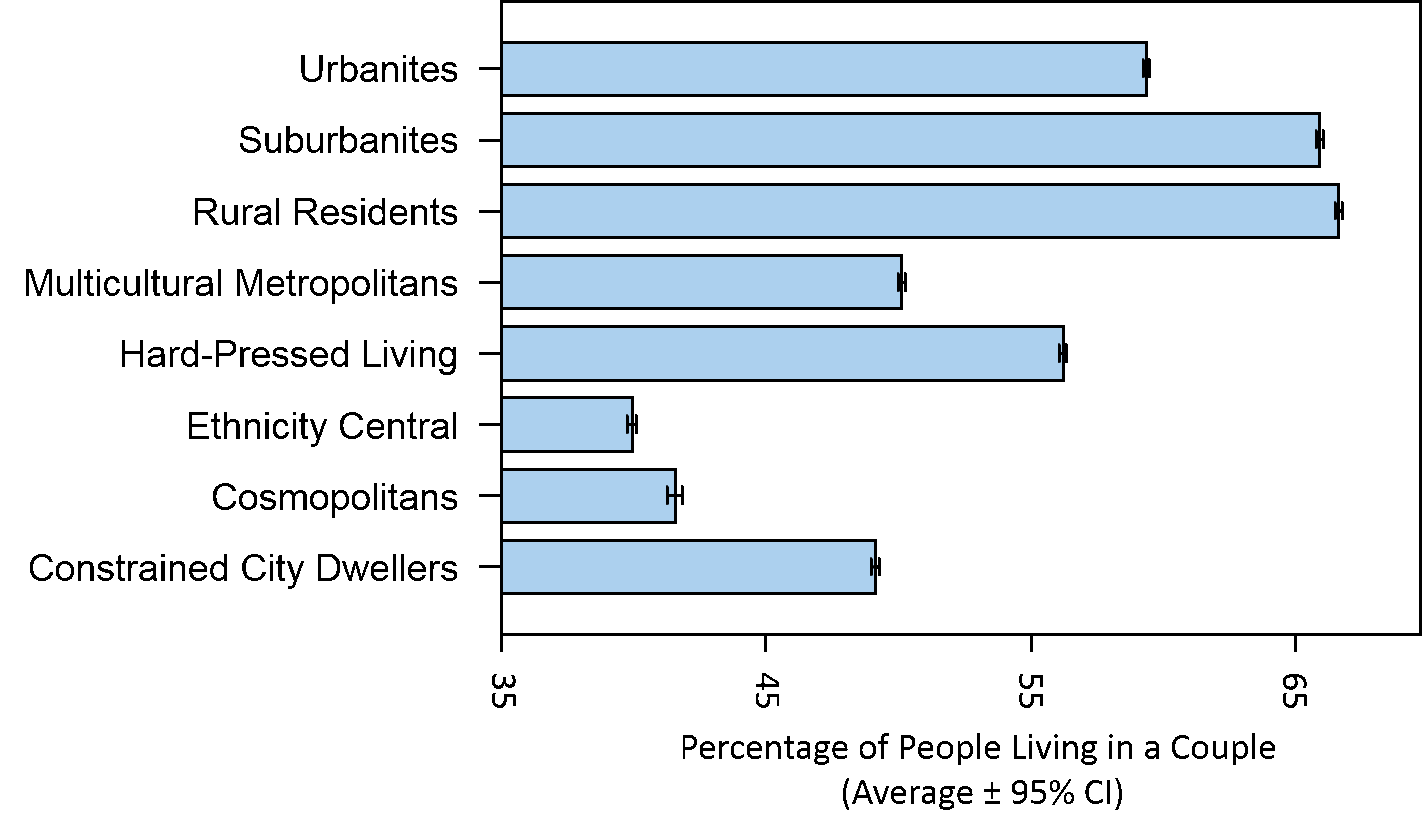
Each Lower Super Output Area (LSOA) in England is classed as being of one of eight supergroups that provide the most generic descriptions of the population in the area . The average Loneliness Prescription Index differed substantially between these areas. As shown in Figure 1. Cosmopolitan areas have the highest score, which reflects a significantly higher proportion of prescriptions for loneliness related conditions. Cosmopolitan areas also had relatively low levels of people living in couples (see Figure 2).
Figure 1: Loneliness-related condition prescribing (preliminary results; may be subject to change) differ among the eight supergroups that provide the most generic descriptions of the population within a LSOA

Figure 2: The proportion of people living in a couple differs among the eight supergroups that provide the most generic descriptions of the population within a LSOA
Ideally, we want to link primary care-level prescribing data to administrative geographies in England to take advantage of the wealth of routinely compiled demographic and socio-economic statistics. To achieve this, we need to take the known data values for primary care facilities and infer what the data value is likely to be for each geographical area, like a district or ward. Transforming data observed for discrete locations to geographical areas is known as a ‘change in support problem’ – data observed at a set of point locations (e.g. GP surgeries) need to undergo a transformation to allow inference of those data values for areas.
There are a number of ways to approach the change in support problem, but generally they fall into exact (simple algorithms) and statistical (probability-based) approaches. As a proof of concept, we used an exact method known as ‘inverse distance weighting’ to estimate the value of a data point at an unknown location based on the distance-weighted combination of data values at known points. These estimates are then combined to produce estimates of loneliness-rated condition prescribing for the UK Census ‘Middle-Layer Super Output Area’ (MSOA) geography.
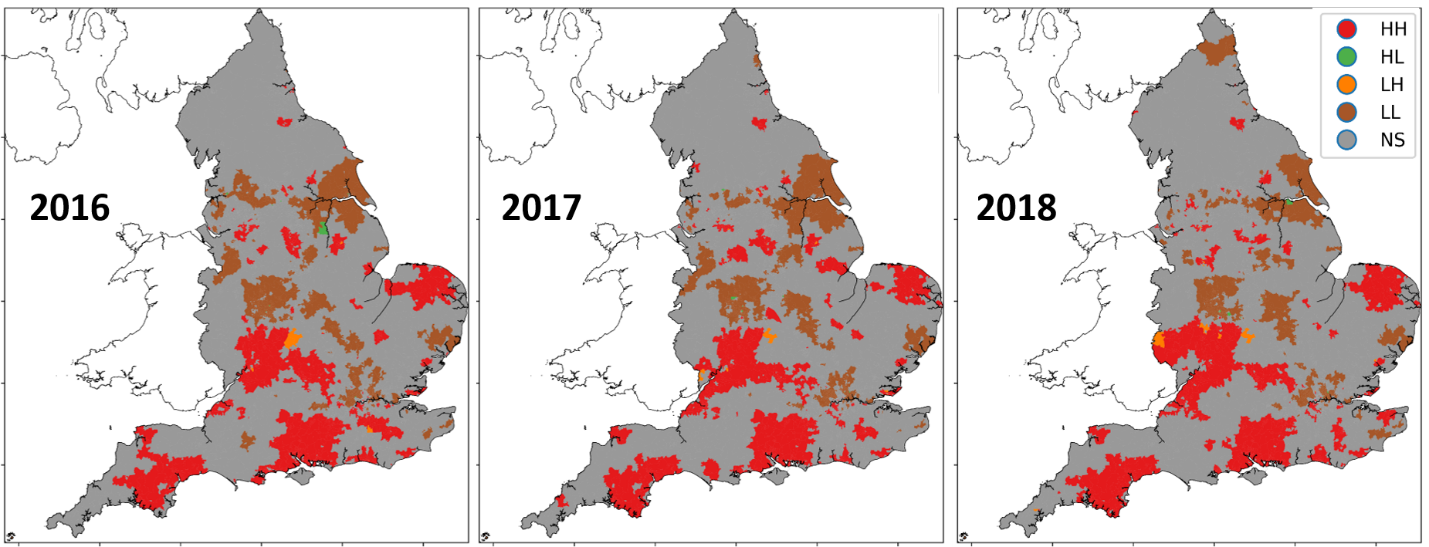
Testing the MSOA estimates reveals that they are geographically patterned. Loneliness-related condition prescribing is not random across England but is concentrated in particular areas (see Figure 3). We call this phenomenon spatially dependency, or spatial auto-correlation. Local Indictors of Spatial Autocorrelation (LISA) statistics are computed to reveal the presence of hot and cold spots – regions of England in which geographically concentrated groups of MSOAs exhibit higher-than-average or lower-than-average index values for loneliness-rated conditions.
Figure 3: Hot-spots (red) and cold-spots (brown) in loneliness-related condition prescribing (preliminary results; may be subject to change)
Next steps
Currently the findings from the loneliness index are preliminary and may be subject to change as the project develops. We are excited about what we have done so far and are looking forward to exploring how meaningful a measure it is. The next steps are to explore and implement a more sophisticated geostatistical approach known as ‘Kriging’ (or gaussian process modelling) to tackle the change in support problem outlined above and make more robust estimates of loneliness related conditions at both MSOA and LSOA levels. We also plan to further develop the prescription types included over time to enable a more robust measure of changes in prescribing for loneliness related conditions over the last 10 years.
For further information, please contact the Data Science Campus.
Authors
Jasmine Grimsley, Kirsty Hopkins, Elishama Tizora, Daniel Lewis