Can non-standard data sources help us understand the relationship between management practices and high growth?

High-growth businesses drive economic growth in the UK. Predicting if a business or business sector has the potential to show high growth – or alternatively low performance – could be used to target where and how much people invest, where people choose to work, and what support structures and policies are developed and put in place.
In January 2019 we published a report exploring how non-traditional data sources and data science methods can be combined with more conventional business data to help understand the characteristics and behaviours of high-growth companies. In this update, we add in an additional dataset – the Office for National Statistics (ONS) Management and Expectations Survey (MES) – to further explore the potential for identifying characteristics.
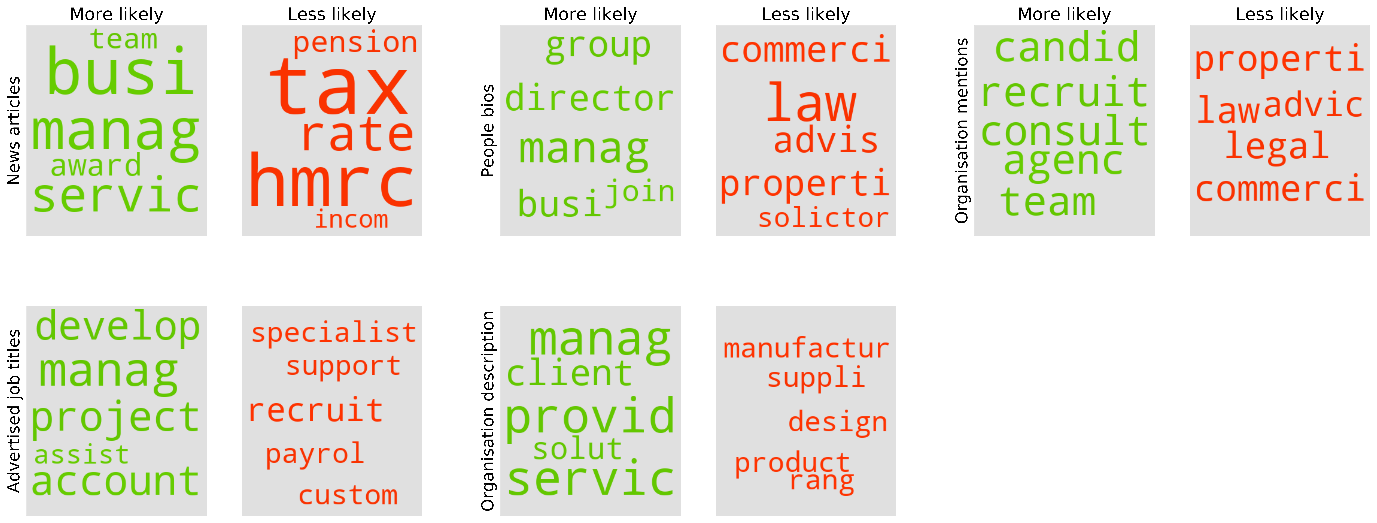
In Figure 1 observations from our initial work showed that the term “management” seems to be used more by high-growth companies in descriptions, news articles, bios and job adverts on their websites.
Figure 1: Summary of main words used by high-growth companies for different free text collected from their websites
This raised the question of whether high-growth companies use specific or structured management approaches.
We explored the relationship between management practices and high-growth by merging the responses from the MES with the Department for Business, Energy and Industrial Strategy (BEIS) high growth flag. High-growth is defined using the standard OECD definition.
We explored questions referring to education, targets, training days, performance management and bonuses, and basis for promotion to find the differences between high-growth and regular businesses. Questions relating to business characteristics, targets and employment practices showed the biggest differences, whereas questions regarding key performance indicators and production delivery showed the smallest.
For example, Figure 2 shows there was a 9% difference between high-growth and regular businesses giving out performance bonuses to other staff members based on a target (employment practices).
Figure 2: Percentage of businesses that distribute performance bonus based on a target
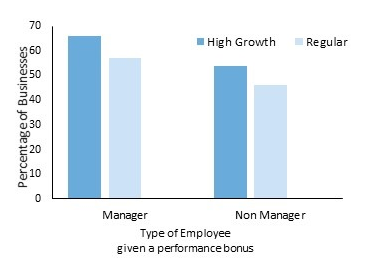
However, there was only a difference of 0.4% between high-growth businesses and regular businesses that had managers reviewing production targets.
The limitations of the merged dataset mean that caution should be observed when concluding that any of the individual management practices explored has a significant effect on the likelihood that a business will enter a period of high growth.
However, based on our exploration, we can say that businesses that engage in certain management or employment practices were more likely to be classed as high growth from 2013 to 2016.
Our exploration of this dataset can be found in the context of our full report. We would like to thank Data Science Campus apprentices Jonathan Rees and Evie Brown, for completing this follow-up work.