Worker shortages: A window on labour demand during the coronavirus (COVID-19) pandemic

The UK’s exit from the European Union precipitated some uncertainty about the workforce across a range of sectors, exacerbated by concerns over workers leaving the country and the impact this might have on labour supply. The COVID-19 pandemic created additional and sudden changes, with sectors being affected heterogeneously and demand switching from services to goods. Understanding these changes in labour demand in real-time were critical to informing policy. To better understand labour shortages, we constructed repeatable analyses of time series data, focusing on job adverts for key roles and vacancy numbers overall. The Data Science Campus (DSC) Levelling Up squad – in collaboration with ONS Public Policy Analysis Directorate – has been pivotal in building data processing pipelines and engineering new analyses and visuals for policy makers.
Using job vacancy data made available by Adzuna, we have been able to provide specific insights into advert numbers and pay across different job roles, including HGV drivers and adult social care workers, throughout the UK and regions. The ONS has previously used Adzuna data to provide labour market insights as the COVID-19 pandemic has developed:
- Using Adzuna data to derive an indicator of weekly vacancies: Experimental Statistics (14 June 2021)
- Early insights of how the coronavirus (COVID-19) pandemic impacted the labour market: July 2020
We employed Natural Language Processing techniques to capture adverts relating to HGV drivers and adult social care workers specifically, using the job title and description fields provided in the dataset. By way of an example, in the case of HGV drivers, we defined 3 levels of regular expressions: (1) common terms (e.g. HGV, LGV or 7.5(t) (2) in conjunction with driver but (3) not including other alternative connections (e.g. with mechanic or technician). These 3 levels were combined into a single regular expression to filter rows of data specific to the role in scope.
Reporting of vacancy trends fell into 3 broad time periods:
- 2018 to February 2020 (prior to the first national lockdown)
- February 2020 (our pre-pandemic baseline) to May 2021
- May 2021 to November 2021
Our assumption was that the number of adverts would fall dramatically at the time of the first national lockdown. While this was broadly true, when looking at the adverts for all sectors combined, we did find that adverts for some roles were much less affected.
Summary of key insights
HGV driver roles
Along with those across the Transport & Logistics sector more broadly, adverts for HGV drivers decreased dramatically during the first national lockdown in 2020; the same as the picture for all sectors combined (around 40% of pre-pandemic1 advert numbers by May 2020). However, Transport & Logistics advert numbers increased steeply during Summer 2020 and peaked at twice pre-pandemic levels by September 2020. After a return to pre-pandemic levels by early-2021, a further rapid increase occurred with a new peak in June 2021 for HGV driver adverts of around 350%. Although adverts in the Transport & Logistics sector continued to rise in the second half of 2021, HGV driver advert numbers were seen to fall.
The pattern of change in HGV advert numbers was generally replicated across the UK regions. However, it was notable that the June 2021 peak was substantially higher in West Midlands (around 500% pre-pandemic levels) and North-East England (around 400%).
While median salaries across all sectors (including Transport & Logistics) have risen marginally over the past 4 years, a notable change was detected in adverts specific to HGV driver roles: a rapid increase from around £25,000 in March 2021 to around £31,000 by November 2021 (Figure 1).
Figure 1: Weekly median salaries for HGV driver, Transport and Logistics and All adverts, UK, 2018 to 2021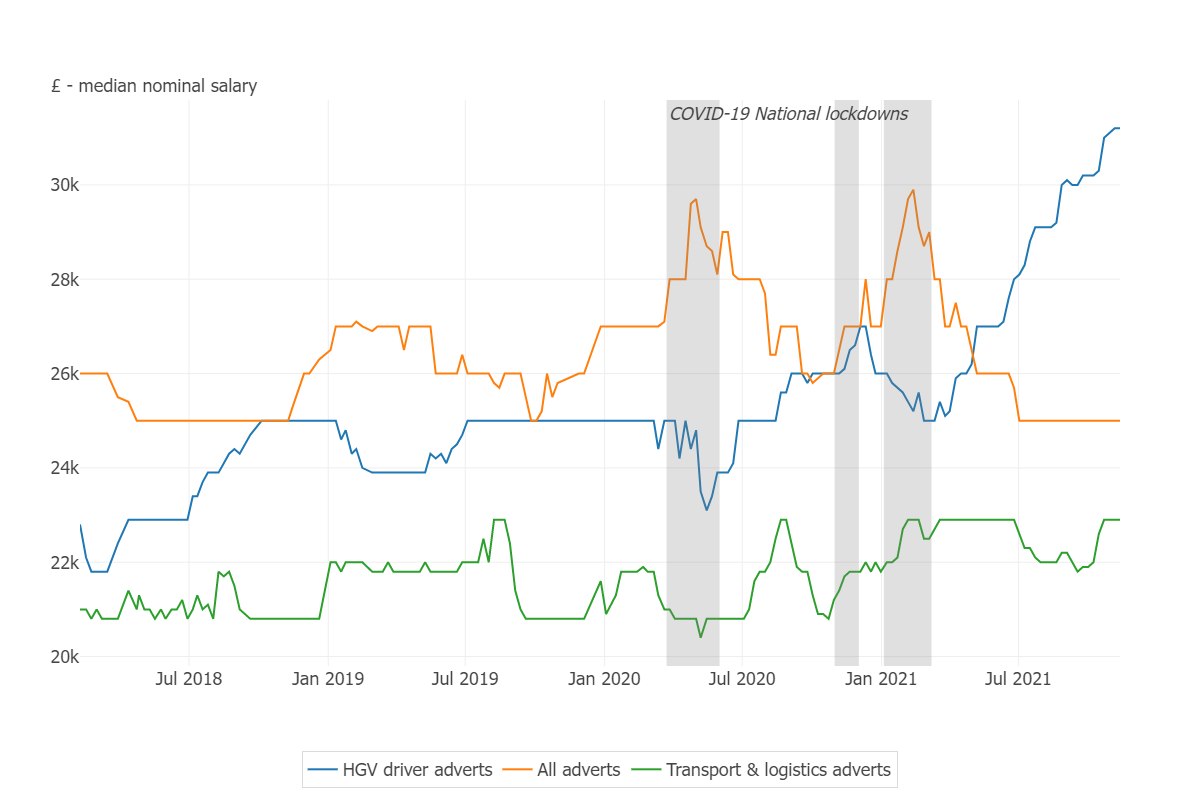
Note: Median salaries for adverts with salary information available, rounded to the nearest £100. The proportion of HGV driver adverts missing salary information during the 2018 to 2021 focus period ranged from around 7% to around 19%. Note that plateauing of the median salary (for example, £25,000 for HGV drivers between July 2019 and March 2020) also reflects a common practice of salaries being advertised as rounded figures.
Adult social care roles
Median salaries attributed to adult social care adverts were found to have increased from around £19,500 in January 2019 and peaking twice at around £25,000 in July and December 2020. This included a sharp increase in the later weeks of the first national lockdown. Since then, median salaries again fell to approximately £21,500 by November 2021.
While advert numbers fell to around 40% of their pre-pandemic baseline by May 2020 for all sectors combined, the Social Services & Care sector was much less affected: numbers falling to a minimum of around 75% of the sector baseline. After returning to pre-pandemic levels by May 2021, adverts for adult social care roles have increased more steadily than for other work areas (Figure 2).
Figure 2: Relative weekly live adverts for Adult Social Care, Social Services and Care & All adverts, UK, 2019 to 2021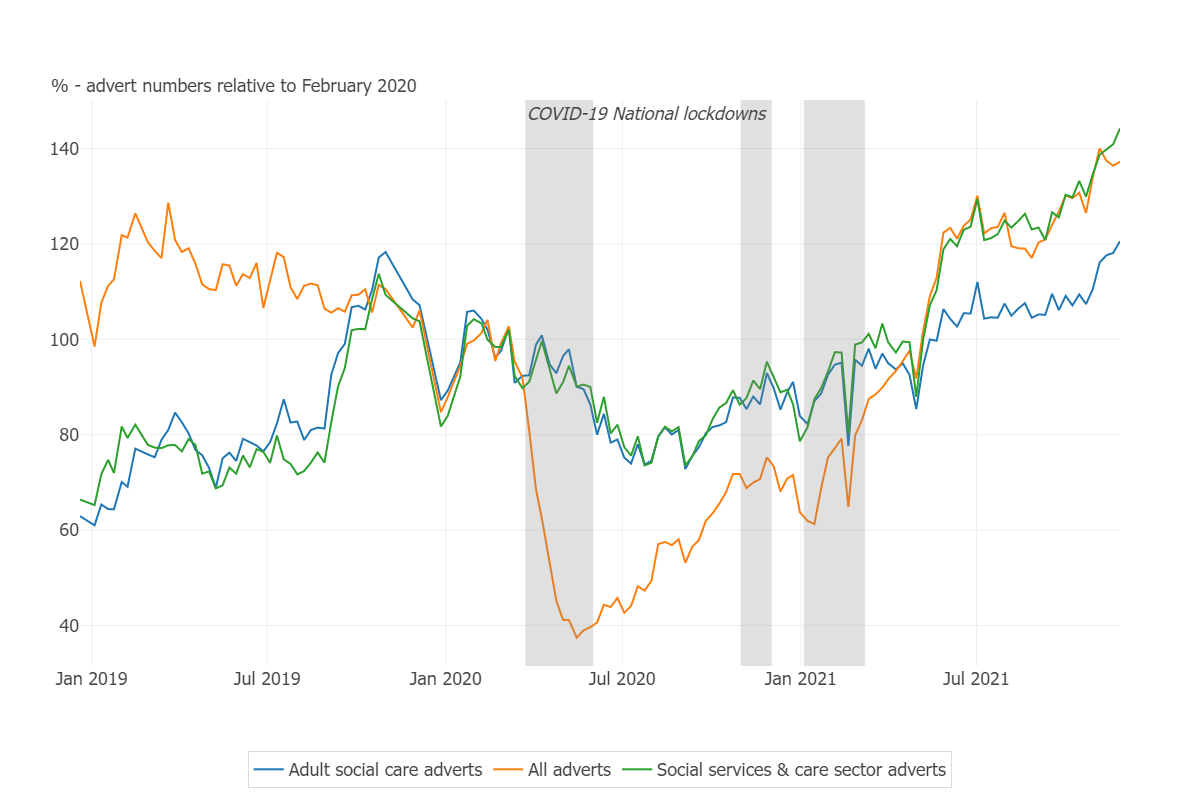
In further analysis, we found that the number of adult social care adverts citing qualifications (e.g. RGN, RMN, RNLD, NMC2) fell much more sharply than those where qualifications were not mentioned during the first national lockdown of 2020. For adverts citing qualifications, numbers dropped to around 50% pre-pandemic levels by May 2020; the decrease in adverts not citing qualifications was steadier, reaching around 70% of baseline in September 2020. Since May 2021, the increase in adverts where qualifications are not mentioned has been much more pronounced: reaching around 155% pre-pandemic levels, in contrast to approximately 110% for posts citing qualifications, by November 2021.
Adult social care advert numbers returned to their pre-pandemic levels at very different times, according to region (for example, October 2020 in East Midlands and June 2021 in London). As of November 2021, numbers were at around 180% pre-pandemic levels in East Midlands and around 120% in London. Naturally, this might provoke some further questions (beyond the scope of our project):
- Is there less demand for adult social care in London?
- Is the workforce in this sector more stable in London?
- Are there other dynamics specific to different regions?
Limitations
The greatest challenge in our work was capturing specific job roles in the data available. Each advert was pre-classified in categories, defined by Adzuna. We found some variation in the content of individual job descriptions and variability in the use of job titles in the advert data provided. Consequently, the regular expressions we engineered had to be sufficiently flexible to capture data rows for the roles in scope. For example, the term driver might relate to roles for HGV drivers, van drivers and supermarket delivery drivers so NLP techniques were employed to glean further context (e.g. HGV). Furthermore, adverts might be presented with or without job title, terms of employment, expected qualifications and so on. A considerable block of work was needed to define regular expressions to capture our roles in scope correctly while limiting errors:
false negatives – for example, incorrectly flagging adverts for HGV drivers as non-HGV;
false positives – for example, incorrectly labelling a non-HGV advert as HGV. Primary school teacher adverts (not typically requiring HGV driver qualifications) were originally captured given the use of the important term class in regular expressions. Class 1 and Class 2 qualifications are routinely referenced in HGV driver adverts. However, false positives were dramatically reduced when the token teach was excluded. Much time was also spent labelling samples of data in order to evaluate the accuracy of our code at filtering the data rows attributed to the job roles in scope.
Closing remarks
In summary, we have explored how both HGV driver and adult social care advert numbers have fared during the pandemic and, more importantly, their rates of recovery since the first national lockdown. Other breakdowns have included comparing advert prevalence with and without qualifications, salary changes over time and some contract terms e.g. full-time, part-time etc. This work has already provided valuable indicators to highlight potential vulnerabilities in the UK workforce. Our work has led to an innovative and reproducible approach to flagging changes in vacancy numbers across sectors (albeit requiring new regular expressions). The project has demonstrated a potential for further automation and application of similar methods across other job roles in the future. It has already helped to inform policy.
1 pre-pandemic denotes February 2020 figures
2 RGN – Registered General Nurse
RMN – Registered Mental health Nurse
RNLD – Registered Nurse for people with Learning Difficulties
NMC – Nursing & Midwifery Council (registered to)