Estimation of travel to work matrices

Travel to work matrices show movement of people from their home location (origin) to their place of work (destination) at an aggregated level. Information on travel to work provides a basis for transport planning, for example, whether new public transport routes or changes to existing routes are needed. Additionally, it allows the measurement of environmental impacts of commuting, for example traffic congestion and pollution, and how these might change over time, for example because of changes in commuting modes, such as a shift from car to bicycle. The Office for National Statistics (ONS) collects travel to work data from the census every ten years, with the most recent being 2021. This travel to work data helps us generate travel to work matrices for census years, for instance, at 10-year intervals with no updates for years in-between.
Using aggregate spatial modelling approaches, the Data Science Campus has produced an alternative estimation of the travel to work matrices which bridges this gap. We have produced experimental data for each year from 2012 to 2021 and have published modelled estimates for 2021. When new data becomes available, the model can be updated to include 2022 onwards. This will provide complementary statistics to the 2021 Census travel to work data collected during the coronavirus (COVID-19) pandemic which contains a mixture of pandemic and pre-pandemic behaviours. These modelled estimates for 2021 are the first release in a planned work programme of incremental improvements to the model and outputs.
This blog briefly introduces the methods used, initial results, limitations and next steps. For a more detailed methodology, refer to the technical report. You can download our estimated travel to work matrices from the ONS website. We do not recommend that these data are used to inform decisions, and are publishing the statistics to enable feedback and input into methods. We welcome feedback from stakeholders on methods and outputs.
Method
We have developed a gravity model, calibrated using the 2011 Census travel to work data, to estimate travel to work matrices. A gravity model at its most basic level assumes that the number of trips made between two areas can be estimated by the number of resident workers at the origin (residential end), the number of employees working at the destination (workplace end) and the cost, such as travel time, travel distance or monetary cost (or a combination of these factors referred to as a generalised cost) of travelling between these two locations.
Figure 1 shows the processing pipeline, that is, how the different sources of data feed into the model and generate the estimation of travel to work matrices. The pipeline consists of three core modules: Production and Attraction Estimation Module, Calibration Module and Doubly Constrained Model.
Figure 1: The processing pipeline of the gravity model
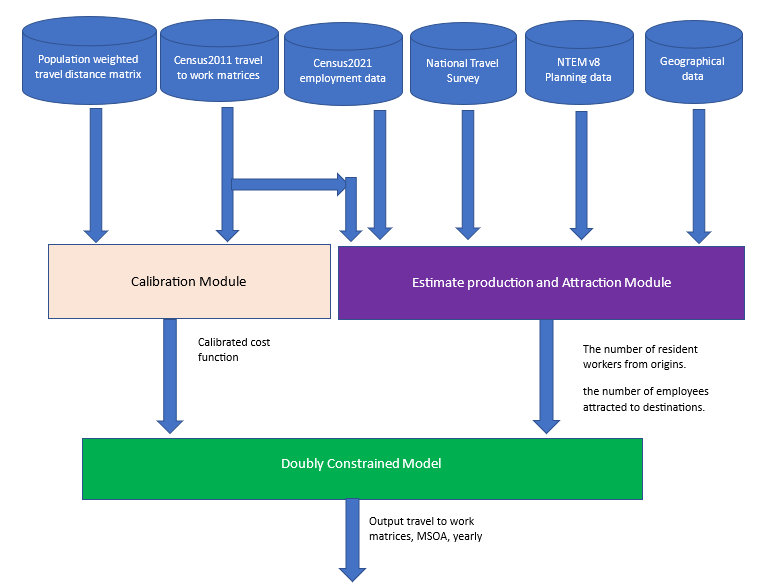
The Production and Attraction Estimation Module estimates the number of resident workers travelling to a fixed workplace at each origin, and the number of employees working in each destination, using these assumptions:
- the number of resident workers for years 2012 to 2020 is estimated using growth factors in workers taken from Department for Transport’s (DfT) National Trip Ends Model (NTEM), applied to 2011 Census values to estimate future year resident workers
- the number of resident workers for the year 2021 is estimated using Census 2021 resident employment data
- the proportion of resident workers travelling to a fixed workplace is estimated from DfT’s National Travel Survey (NTS), 2011 to 2021, segmented by latent geographical clusters defined by land use characteristics (refer to Jahanshahi and Jin and our technical report for more detail).
- the number of employees at each destination is estimated using growth factors in jobs from NTEM, applied to 2011 Census values as Census 2021 workplace employment data is not available at the time of writing
In the Calibration Module, the cost of travelling between the origin and destination is currently estimated using straight-line distance. The model is calibrated using a cost function that aims to replicate the relationship between distance between home and work and the number of commuters, as seen in the 2011 Census travel to work matrices. In later versions of the model, we plan to replace distance with better estimations of costs, in terms of time and money, of travelling between home and work.
An iterative process, called the Doubly Constrained Model, then ensures that the estimated number of resident workers at all origins matches the number of employees working at all destinations.
Results
Our gravity model estimates the travel to work matrices of the usual residents aged 16 and above and in employment with a fixed workplace at the Middle Layer Super Output Area (MSOA) for England and Wales, annually from 2012 to 2021. It also provides estimations of resident workers with a fixed workplace, and employees working in each MSOA in England and Wales, annually from 2012 to 2021. Please note that the 2021 estimates that we have published are the experimental results and should not be used for decision making purposes.
The model combines pre-coronavirus (COVID-19) pandemic commuting behaviour (for example, the proportion of employees travelling to a fixed place of work) from the NTS (2018 to 2019) and 2021 population and employment estimates to provide a counterfactual of travel to work matrices in 2021, assuming pre-pandemic commuting behaviour.
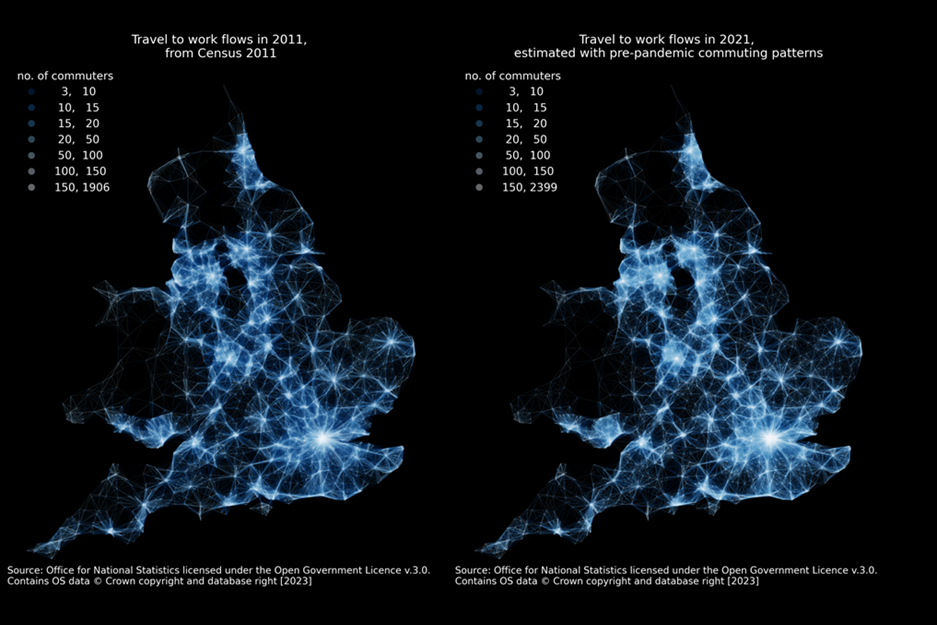
Figure 2 illustrates the estimated travel to work matrices for 2011 (from 2011 Census) and 2021 (under the assumption of the pre-pandemic commuting behaviours) respectively. The maps represent commuting flow between all home and work locations at MSOA level in England and Wales, with lighter lines indicating more commuters travelling to fixed workplaces. The maps provide a sense check on the estimated travel to work matrices for 2021, produced by the model. This is because, over time we would not expect commuting behaviour to change dramatically at aggregate level, so we would expect a similar picture to emerge from the travel to work matrices estimated for 2021, as we observe in 2011.
Figure 2: Travel to work flow map, MSOA, England and Wales, 2021 assuming pre-pandemic travel behaviour
While our initial experimental results provide a counterfactual of travel to work matrices assuming pre-pandemic commuting behaviour, the model can also estimate travel to work matrices assuming mid-pandemic commuting behaviour. This is achieved using mid-pandemic commuting behaviour from the NTS (2020 to 2021) and 2021 population and employment estimates. Figure 3 presents maps showing the number of workers who travel to a fixed workplace for MSOAs in England and Wales in 2021 under these two conditions, for instance, assuming commuting patterns pre- and mid-pandemic, respectively.
Figure 3: Maps of production (the number of workers living in an area who travel to a fixed workplace), MSOAs in England and Wales, 2021 under the conditions of pre- and mid-pandemic travel behaviours, respectively
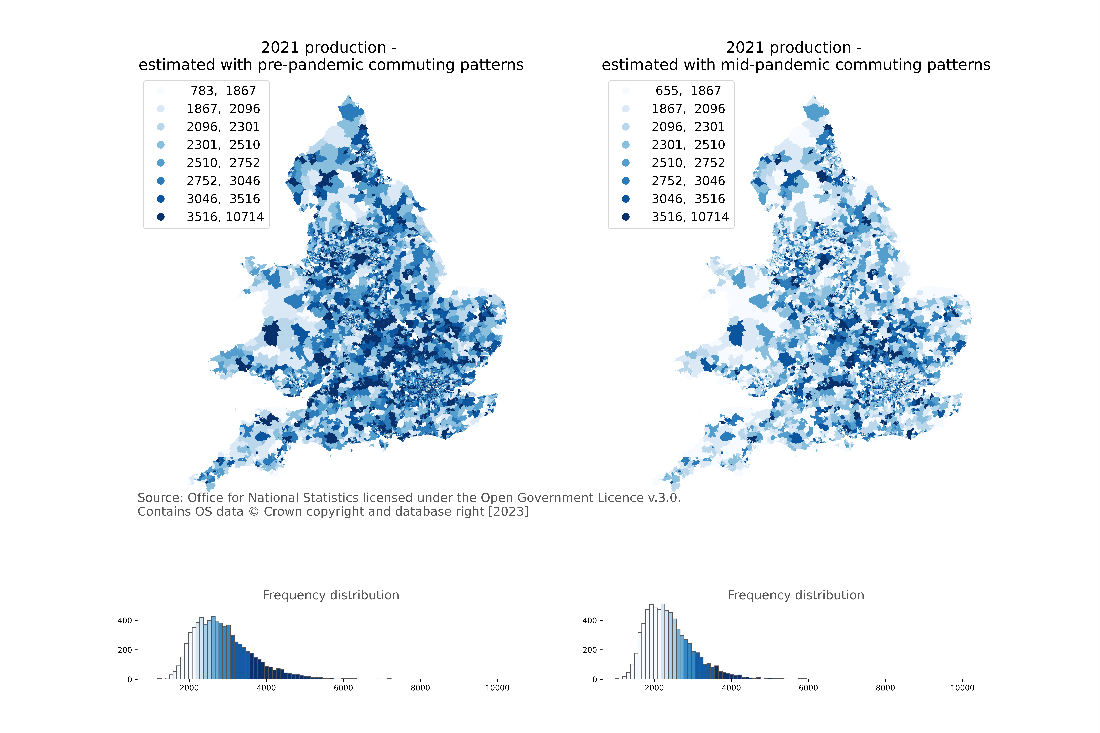
According to the 2011 Census, 21.6 million (81%) people travelled to a fixed workplace in England and Wales. The 2021 Census reports that 15.1 million (54%) people travelled to a fixed workplace, a significant reduction over 2011. This is because at the time of the 2021 Census many people were working from home or furloughed,. Our initial experimental estimations using commuting behaviour pre and mid-pandemic are in line with plausible expectations. Our model estimates that in 2021 76% (21.1 million out of 27.8 million working adults) travel to a fixed workplace under the assumption of pre-pandemic travel behaviours, and 63% (17.6 million out of 27.8 million working adults) travel to a fixed workplace under the assumption of mid-pandemic travel behaviours.
Limitations and next steps
One major shortcoming of the estimated travel to work matrices is the lack of validation, which has not been possible in the absence of a representative survey of travel to work for 2021, because the Census 2021 contains a mixture of pandemic and pre-pandemic responses on travel behaviours. To help validate the model, we are working on obtaining alternative data sources including mobile phone data.
In addition, there are limitations relating to some of the input datasets we have used in the model, particularly at finer spatial granularities. For example, the NTS cannot be relied upon at geographies lower than region, because of survey sample size, response rate and spatial coverage. We therefore make assumptions about travel behaviour trends for aggregations of areas based on rural-urban area type, densities, and accessibility measures (see our technical report for further details). Similar issues affect NTEM because of assumptions made regarding the distribution of growth in employment and workers. This will affect the reliability of the estimated travel to work matrices.
We plan to address these issues in future versions of the model by working with stakeholders, and through model enhancements, for example through segmentation by transport modes, industry, occupancy, and socioeconomic characteristics. This segmentation will allow us to make better assumptions about travel behaviour trends by different types of commuters and allow the estimation of travel to work matrices by these segmentation groups.
Our longer-term goals involve developing predictive models, to allow testing of ‘what-if’ policy questions and scenario-based analysis to enable decision making under uncertainties on future housing market, jobs market, economy, and technology developments. For example, by estimating and comparison of travel to work patterns under high or low growth in housing supply, jobs or economic performance.