Taking Reproducible Analytical Pipelines on a virtual tour: first stop the Caribbean
The Project for the Regional Advancement of Statistics in the Caribbean (PRASC) is an initiative funded by the Government of Canada through its Caribbean Program and is led by Statistics Canada.
In September 2019 we started discussions with Statistics Canada to understand how we could help them support data science skills building in the Caribbean Community through this initiative. The decision to work together on this programme was made following presentations from the Office for National Statistics (ONS) Data Science Campus at the Commonwealth Heads of Statistics conference in London in 2018. Statistics Canada saw that the ONS had a uniquely strong capability in data science and would be a great partner in delivering their programme’s objectives.
Before the coronavirus (COVID-19) pandemic, we planned to send a Campus Faculty lecturer and Statistics Canada staff member to Barbados to deliver an intensive week of data science training, with project and mentorship support being provided for the following three months. However, the onset of the pandemic dealt a cruel blow and these plans were paused for some time. As remote working became the norm, we revisited our discussions, revised the learning needs and discussed a virtual training programme. Through wider discussions with Caribbean National Statistics Offices (NSO), we agreed on a Reproducible Analytical Pipeline Learning (RAP) pathway in R.
The Data Science Campus faculty team were aware of the unique challenges of remote delivery to international stakeholders, having delivered remote training to countries such as Rwanda and Kenya. We set up contingencies to mitigate poor connection and training accessibility. This included a dedicated Slack channel for peer and trainer support. We also recorded the lectures and made these available after the course. Armed with these remote technologies we set off ready to deliver to Caribbean National Statistics Offices across five time zones.
What is a Reproducible Analytical Pipeline?
There is an old adage in data science and software development that there are always at least two people working on a project – you and future you. The problem is that past you does not answer emails!
Think about the last project or report you worked on. If your computer died and you lost the final report, how long would it take you or a colleague to reproduce the report?
The answer depends on your response to these questions:
- are there multiple versions of the file?
- is there a record of who made what changes, and why?
- are all the steps recorded to reproduce the analysis, plot, and table?
- were multiple independent tools used for different steps?
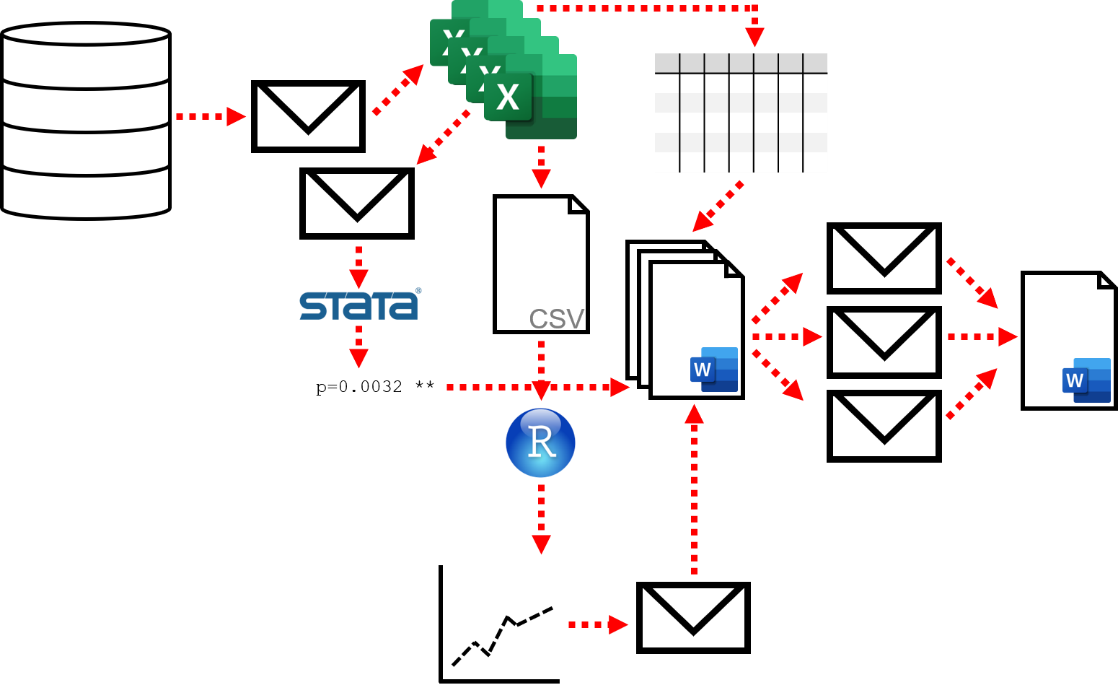
Our diagram illustrates the current process many of us use in managing our projects or reports. Parts of the analysis are carried out in different software packages, multiple copies of the file and documents may be made, several emails containing copies of a report are sent between members of the team, and different parts of the analysis (plots, statistics, and images) are added to along the way. All this results in a complicated analytical maze that not even Hansel and Gretel’s digital breadcrumbs can be used to retrace.
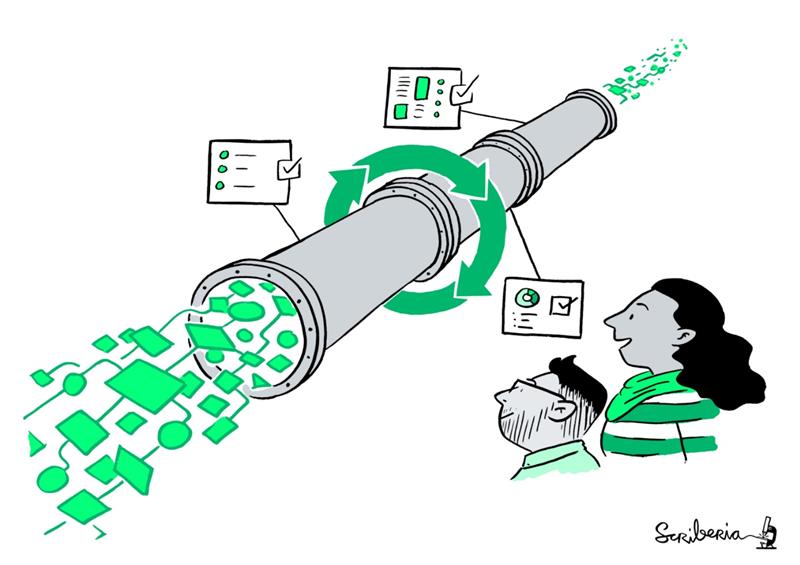
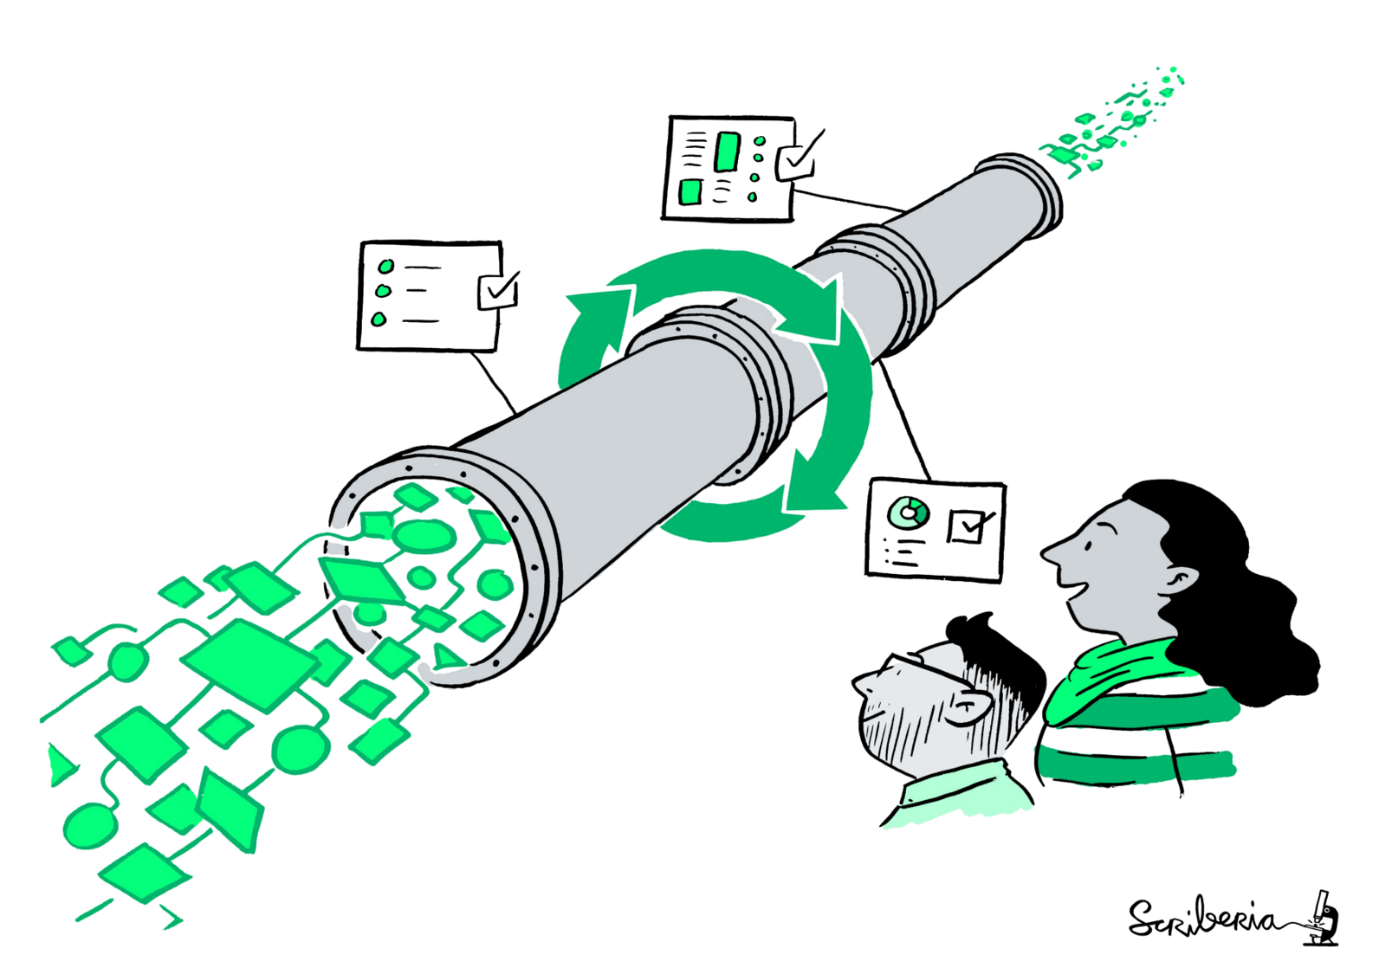
Benefits of RAP
Reproducible Analytical Pipelines (RAP) are becoming a more commonly used technique in the analytical space to create more robust and reproducible workflows. RAPs are reproducible frameworks that can be used to design and manage effective workflows with the potential to save NSOs hundreds of hours and thousands of pounds. There are a number of examples of successful RAP projects across government including at the Centre for Crime and Justice and the Ministry of Housing Communities and Local Government (MHCLG). One of the main benefits of a RAP is that we can repeat our work easily and quickly. It is not reliant on a single individual, not even our past selves! The original data is never edited. The data processing and report production occur in one place. There’s one version of the file and the steps are tracked and recorded from start to finish. It’s fast and automated but not without sense checks. It’s transparent and promotes trust because all steps are tracked and recorded from start to finish so that anyone can reproduce your results.
The UK government has been a leader in promoting Reproducible Analytical Pipelines, with RAP Champions. The RAP champions come from different departments across government and offer support and knowledge sharing for reproducible analysis.
But how exactly do you teach Reproducible Analytical Pipelines?
The Reproducible Analytical Pipeline (RAP) learning journey
The Data Science Campus RAP learning pathway is designed to take coding novices through the essential building blocks needed to transform their existing workflows (which could be carried out using a combination of multiple tools such as STATA, SAS, Excel, Microsoft Access, and/or word) into a fully reproducible analytical pipeline in the software R.
The aims of the course were for students to develop a reproducible mindset, become familiar with open source tools and best practice, and to build skills in:
- programming
- data wrangling
- data visualisation
- version control
- statistics
- reproducible reporting
- robust programming
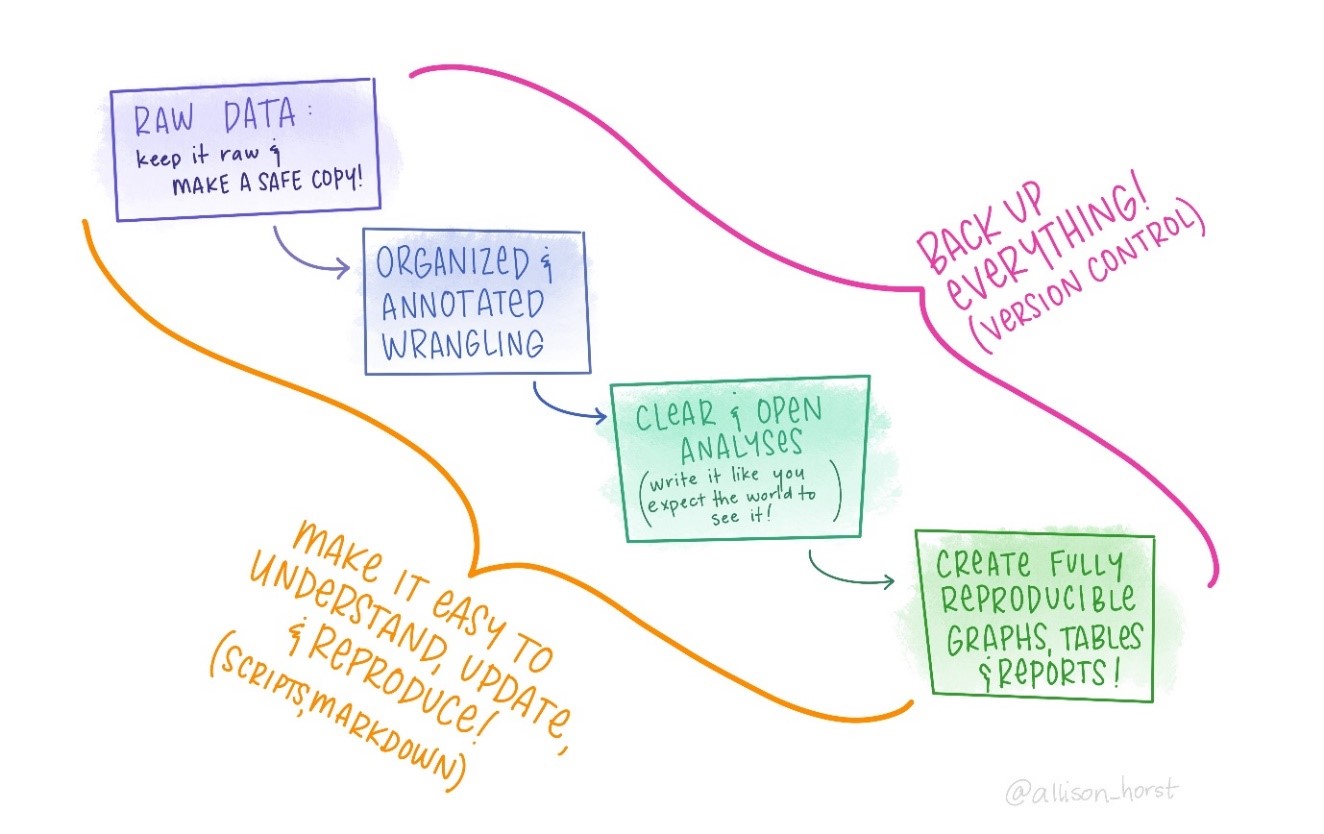
Artwork by @Alison_horst
In total, 21 statisticians from 12 countries in the Caribbean took part in one of two course streams:
- advancing in R – 5 weeks encompassing 3 courses and regular hands on workshops
- full RAP Course – 20 weeks encompassing 8 courses, regular hands on workshops and finishing with applied learning on a RAP project
Each National Statistics Office was invited to submit a project for the RAP course. Each team was supported by a mentor and each module was followed by a hands-on workshop where participants apply what they’ve learned to their project and problem-solve together.
Learning and application
The courses paired traditional lectures with hands on workshops and project mentoring, helping participants to directly apply what they have learned. Each lesson was designed to help students meet key project milestones including importing and cleaning their data, creating graphics and tables, combining text and code into a reproducible report and adding unit tests.
The hands-on workshops were designed to give participants the opportunity to bring their own data and problem solve together. One of the hardest skills to teach beginners is how to debug code, as programming error messages are notoriously difficult for beginners to decode. We incorporated plenty of opportunities for live coding to help normalise mistakes and allow students to see the problem-solving process in action (Wilson and others 2020).
The hands-on workshops also allowed us to fill gaps in the curriculum and focus the content around the participant’s projects. Shortly after receiving the proposals, we realised that many of the project reports included tables which were not covered by the planned courses. We were able to adapt the learning to include a short tutorial on creating tables using kableExtra in R.
Students completed the pathway by applying their learning to their own project. At the start of the course, they had selected and presented a broad range of RAP transformation projects. These projects included producing quarterly trade bulletins to annual reports on vital statistics, labour force and household expenditure surveys. Details of the organisations pre-existing workflows were also provided.
Mentoring
The mentoring process offered the lecturers insight on what subject matter had been readily assimilated by the student and which areas learners needed more support in. Mentors practised their coaching skills by assisting their mentees towards effective implementation of their skills, offering reproducible examples and scaffolding so mentees could effectively apply their learning.
Impact
The trainee from Trinidad & Tobago directly applied her learning to her project, creating quarterly trade aggregates for her country’s region by sector. The final pipeline will allow the National Statistics Office to automate the production of publication-quality data tables for reporting purposes. This automation will result in significant time savings for Trinidad and Tobago for future reports and in minimising human-error.
The trainees from Belize incorporated the “visdat” and “janitor” packages in their Labour Force Survey dashboard to visualise missing data and check for inconsistencies. Since the course, they have been developing a series of R tutorials for the Labour Force Survey team at Statistics Belize.
Reflections
Although many of us would happily swap winter in Canada, Wales, and Scotland for Barbados, moving to remote delivery during the pandemic allowed us to deliver training and support over a longer timescale. This gave students the extended support to gain these new skills and to integrate what they have learned gradually into their workflow. In their feedback, many of the participants found the recordings of the sessions beneficial as they provided an opportunity to go back and review what was taught at their own pace.
If you are keen to develop your own Reproducible Analytical Pipeline, check out some of these helpful resources:
- Quality Assurance of code for Analysis and Research book.
- Government analysts can request access to the Analysis function Learning Hub containing training on a range of subjects including the RAP pathway.
- a free RAP course to teach you all you need to know.
- a new open-source book from the Alan Turing institute setting out how to do reproducible data science.
Get involved in the UK government RAP champion network here.