FinBins – granular classification of the UK’s financial sector

The last financial crisis drew attention to a need to enhance understanding of the financial sector internationally, to better inform policy and regulation.
One of the important areas for improvement in financial statistics is in the granularity of the sector breakdowns. In the current publications of UK financial statistics, more than 100,000 organisations in the UK financial sector are grouped into just three economic sub-sectors:
- monetary financial institutions – banks, building societies, Central Bank
- insurance companies and pension funds
- other financial institutions – all other types of financial institution, including money lenders, hedge funds, collective investment schemes, securities dealers, financial auxiliaries and others
The “other financial institutions” sub-sector includes businesses with a wide range of different activities. If these institutions can be further classified, more effective analysis of financial stability risk could be possible to inform financial policy.
The project’s scope
The project explores whether it is possible to classify financial corporations to their detailed Standard Industry Classification 2007 (SIC2007) using financial assets, liabilities and other firm-level data. We used a number of unique features derived from both structured and unstructured text are used to determine the feasibility of doing this.
The datasets used were the Financial Services Survey, conducted by the Office for National Statistics (ONS), ONS’s Interdepartmental Business Register (IDBR) and the Financial Conduct Authority’s register of regulatory approvals for financial activity.
Typically, all businesses have Standard Industrial Classification (SIC) 2007 codes assigned to them at some point of their lifecycle, however this is a manual and labour-intensive process. Classifications need to be periodically re-evaluated to incorporate changes in the business activities over time. Failure to re-evaluate would result in obsolete classification for some businesses, skewed business groupings based on obsolete SIC codes and, subsequently, inaccurate statistical results. This affects the ability to monitor effectively flows of funds between the separate company groups and ultimately the level of risk in the sector. To address the problem, the focus of the project has been to investigate an automated method for identification of the companies whose classification needs manual re-evaluation.
Data and methods
After cleaning the data, the three datasets were joined together and we conducted a large-scale machine learning exercise to identify the most discriminative features (fine distinctions between different values of the feature) in the data. It explored various machine learning methods as well as cluster-based distributed computation to optimise the classification accuracy of the model. An exhaustive (or full) search was used to identify the most applicable feature engineering methods.
Data quality and quantity challenges were major factors guiding the selection of the machine-learning algorithms. The Random Forest (RF) algorithm, a class from tree-learning ensemble methods, was the first choice. It was a reasonable balance between the model complexity and its ability to learn from the limited training dataset. At the same time, it reduced the decision trees’ tendency of overfitting to the training set. We also applied the XGBoost algorithm, (a representative of the gradient-boosted trees (GBT) class of algorithms), to the data to evaluate its ability to limit the overfitting of the model further.
More detail about the methods is available in the full report.
After selecting the learning methods, we undertook further pre-processing measures, aimed at improving the overall performance of the model, as described below.
The most important step was the feature selection procedure. Instead of using the full set of features, consisting of 250 individual candidates, the input to the algorithm had to be limited to only a few of the most discriminative ones. If all available features were fed simultaneously into the model as input, the algorithm was unable to learn to generalise sufficiently well due to limited amount of training data. This resulted in unsatisfactory accuracy on the test dataset – a problem known in machine learning as the “curse of dimensionality”. Therefore, we considered it necessary that both optimisation of the number of input features and discovery of the most suitable feature combinations were needed to improve the accuracy of the model.
After the feature selection, final adjustments of the model were carried out by hyper-parameter tuning in a grid search.
The most discriminative features
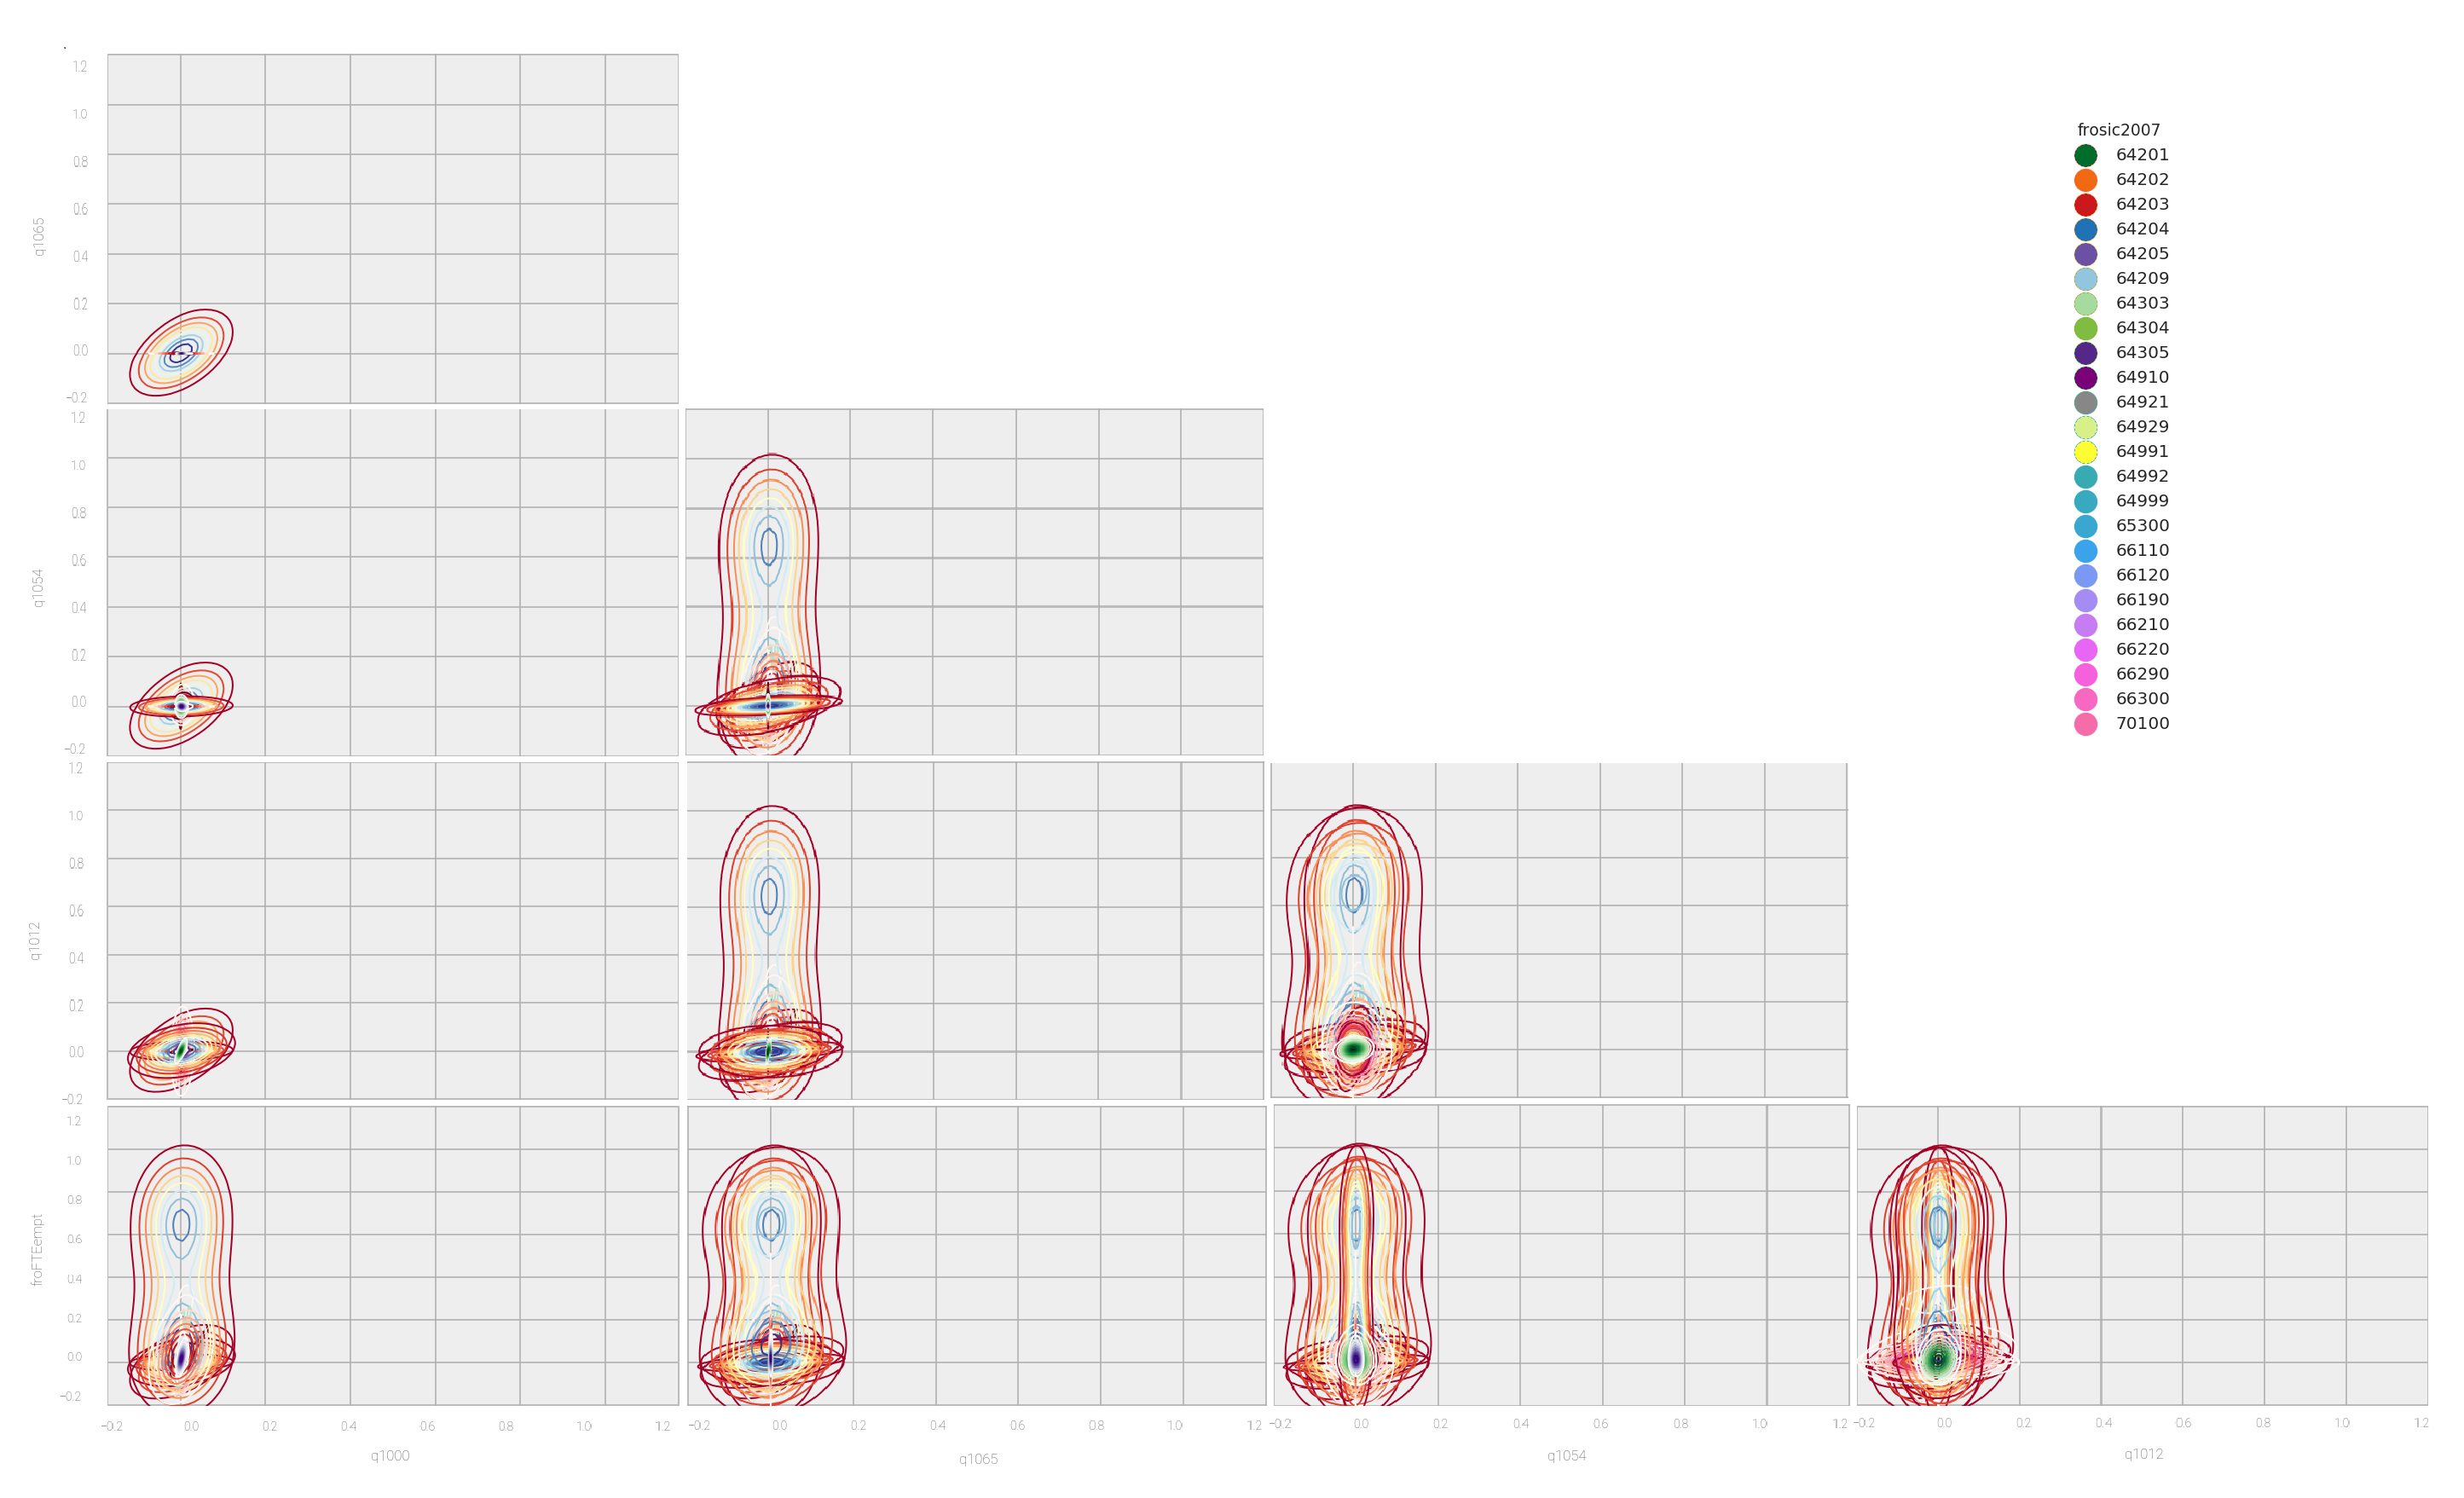
The five most discriminative features identified by the problem-solving algorithm (exhaustive search) in the feature space were found to be: Q1000, Q1065, Q1054, Q1012 and FTEempt. Their description is provided in Table 1.
Table 1: Description of the five most discriminative features
| Feature | Description |
| Q1000 | The value of company’s holdings of transferable deposits held with banks or building societies located in UK |
| Q1065 | The value of the holdings of listed equity in institutions or businesses located outside of UK |
| Q1054 | The outstanding balance receivable from loans with an original maturity of more than one year from businesses in UK |
| Q1012 | The value of the company’s holdings of Treasury Bills issued by Her Majesty’s Treasury (HMT) |
| FTEempt | Number of employees, full-time equivalent |
The features in Table 1 are presented graphically in figure 1. In the plots, the label class corresponding to the Classification 2007: SIC 2007 (frosic2007), representing the constant classification code over time of a company, is colour-coded to allow easier visual evaluation of the class members’ distribution in each feature pair. When using only two features (in the two-dimensional feature space), the overlapping circles indicate that there is no obvious pair of features that clearly separate the label classes into well-defined clusters. These features would be depicted by separate circles on individual plots, if present. Therefore, the focus of search had to be directed on higher-dimensional feature spaces. Therefore, the focus of search had to be directed on multiple, higher level features as input to the classifier and evaluating its performance in an exhaustive search.
Figure 1: Pair plots of the most discriminative features (best viewed in colour)
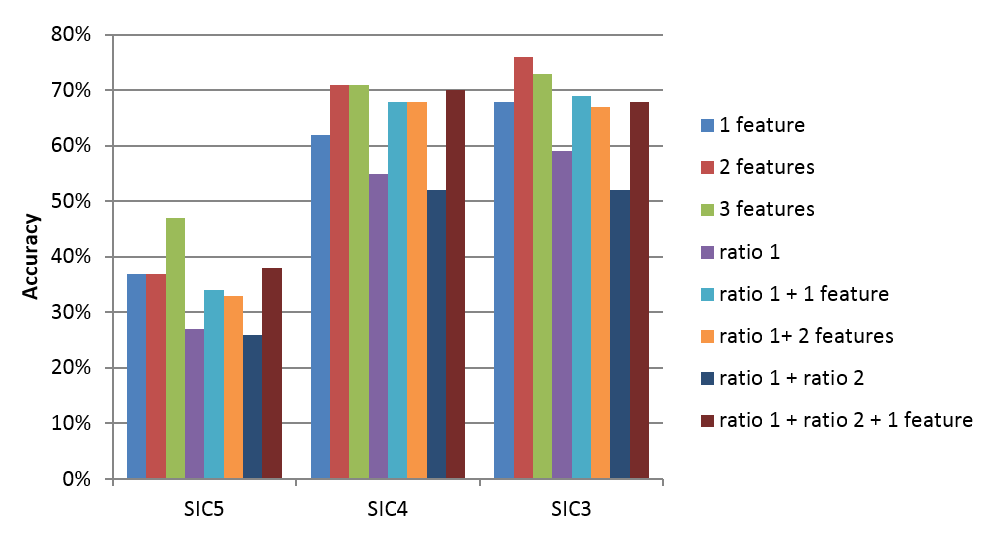
After a large number of experiments, the most discriminative feature configurations and the highest-achieved accuracy for each case was recorded. The results are presented in figure 2. The experiments included the following configurations:
- single feature
- a combination of two features
- a combination of three features
- a ratio between two features
- a combination of a ratio of two features and a single feature
- combination of a ratio and two features
- combination of two ratios
- a combination of two ratios and two features
The classification accuracy was evaluated for different levels of aggregation in SIC groups (three digits), SIC classes (four digits) and SIC subclasses (five digits), denoted by SIC3, SIC4 and SIC5 respectively in figure 2.
Figure 2: Best multiclass accuracy achieved in the exhaustive feature combination search with the distributed Random Forest classifier, using up to three features or ratio of features and three different levels of SIC 2007 codes granularity
Summary and future work
Overall, the experiments have shown that although accuracy achieved from available data is not sufficient for full automation, anomaly detection in classification of certain types of companies is feasible.
The recommendations made by the report identify the following benefits of this work:
- improvement of the Financial Services Survey by designing additional questions with more discriminative power for classification
- companies highlighted by the algorithm as potentially misclassified by the SIC 2007 code recorded in the Inter-Departmental Business Register (IDBR) can be included in the process for manual revaluation of their activities; time saving and efficiencies can bring considerable improvements to the process, leading to increased classification quality at a more granular level
- methodology can be reapplied easily for classification of companies from other administrative datasets
Our partners
We worked with ONS’ Enhanced Financial Accounts development team, who, in close collaboration with the Bank of England, are working on improving the quality, coverage and granularity of the UK’s financial statistics.