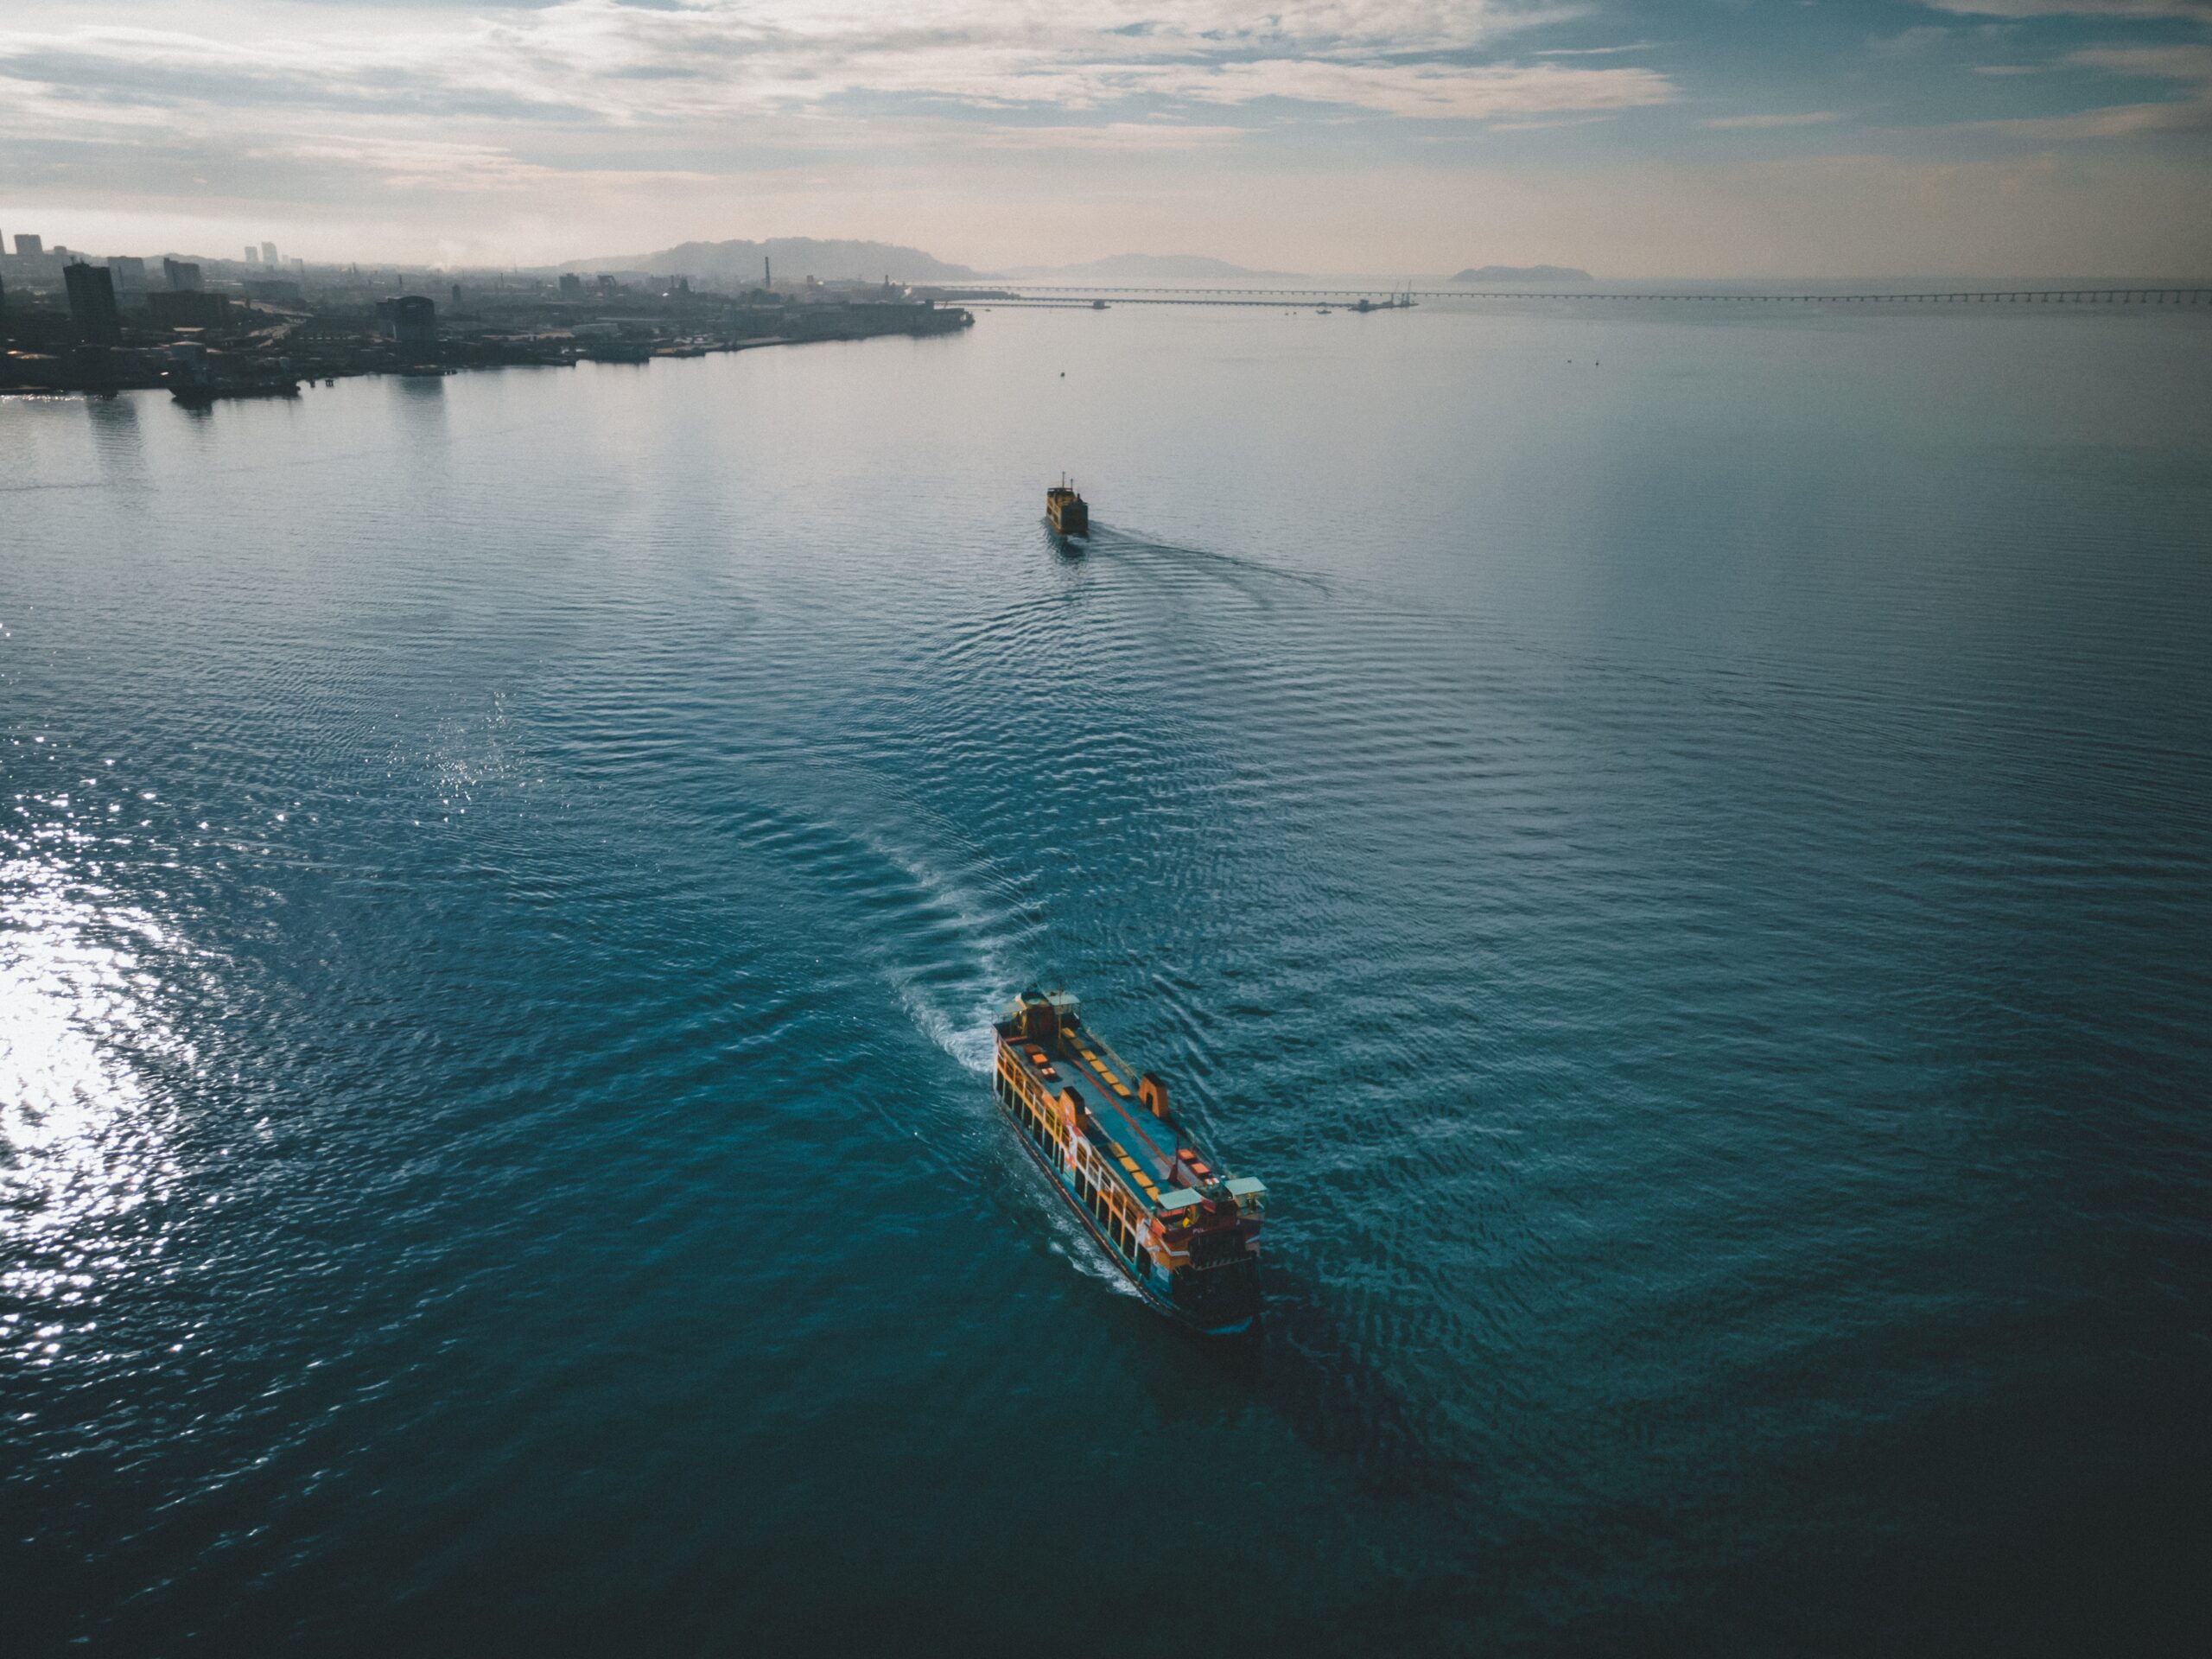
Ship Traffic in Critical Maritime Passages
Introduction
We have been working with the Department for Business and Trade (DBT) and the Department for Transport (DfT) to develop experimental statistics that measure the volume of ship traffic through global maritime passages.
Global maritime passages are narrow passages of water that are important due to their role in international trade, maritime navigation, and geopolitics. Therefore, monitoring traffic passing through them provides insights into trade patterns, the health of the global economy and can help detect potential supply chain issues. The ONS Data Science Campus is partly funded by DBT to support this work.
Figure 1: Location of all six passages of interest
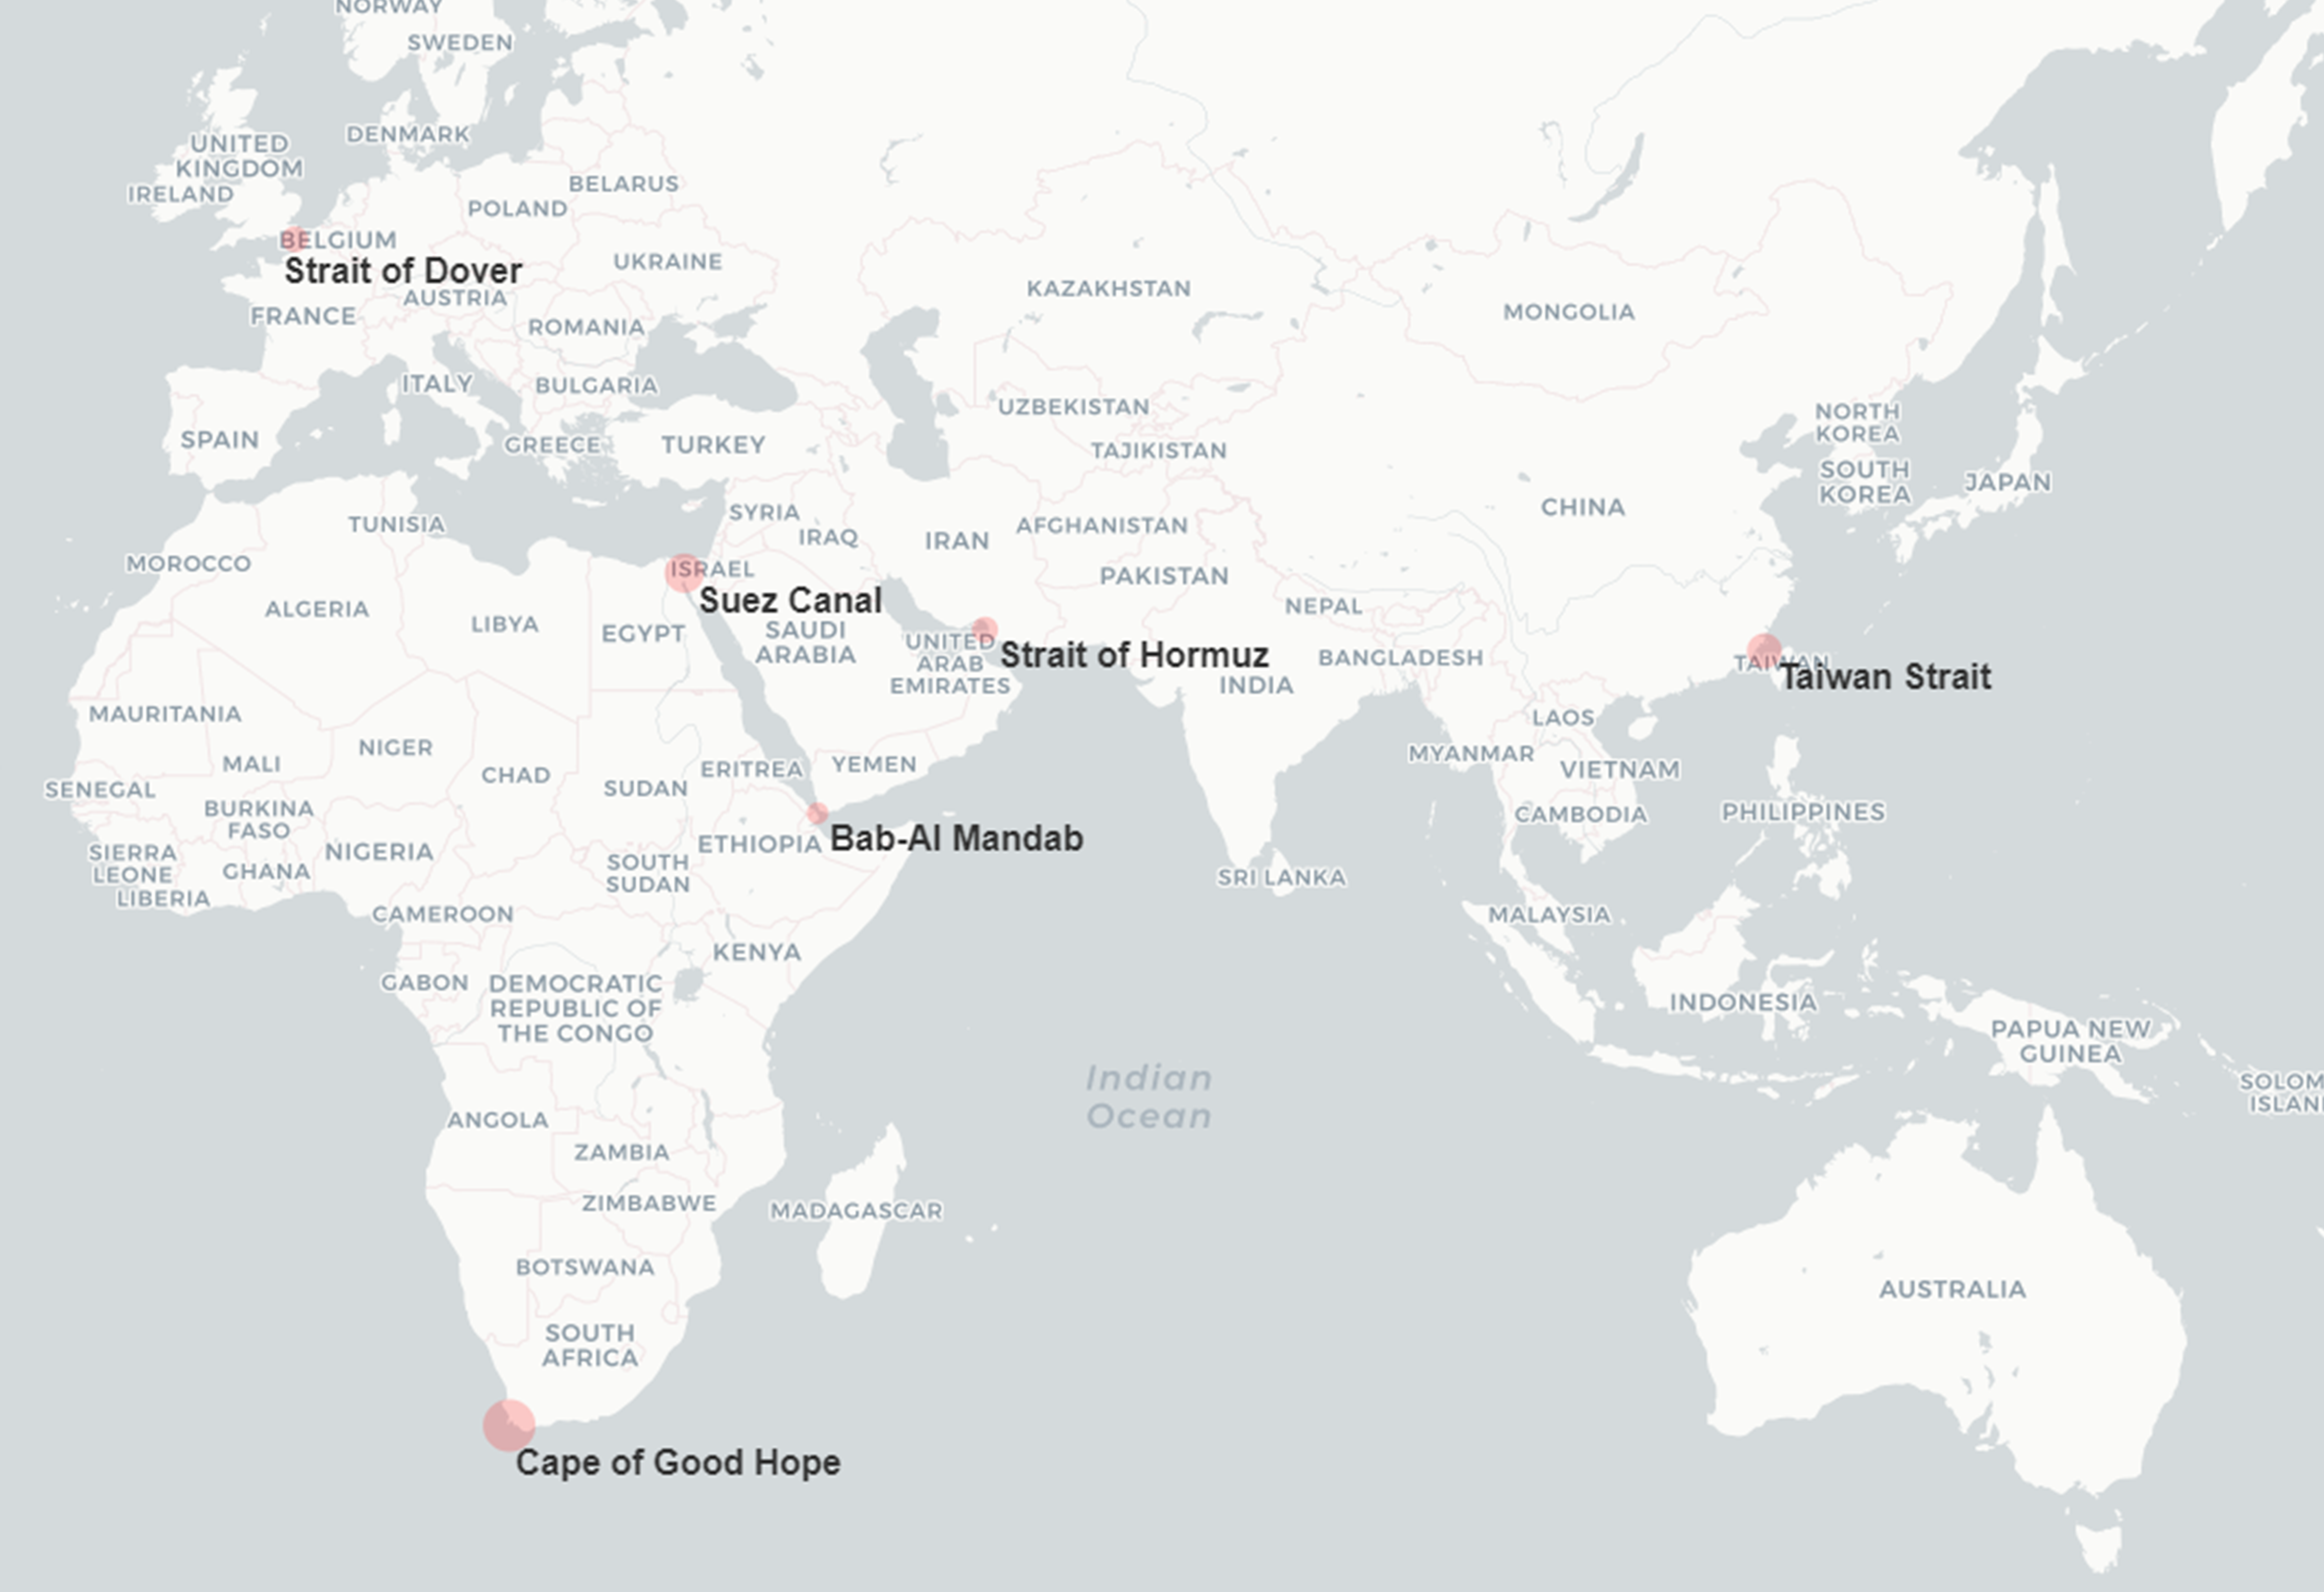
In this blog, we present our initial analysis of the flow of ships through global maritime passages, and the methodology behind it. In our initial work, we focused on six passages of geopolitical, economic and trade importance, specifically the Strait of Dover, Suez Canal, Bab-Al Mandab Strait, Strait of Hormuz, around the Cape of Good Hope and the Taiwan Strait (Figure 1).
These passages were chosen due to their geopolitical, economic and trade importance to the UK Economy. We have developed experimental indicators which estimate maritime traffic volume through these global maritime passages over time, broken down by ship type. This has been achieved through the use of automatic identification system (AIS) data to track the journey of ships, data on these six passages is available on our main ONS website.
AIS is an automatic tracking system that uses transceivers on ships to report their positions in near real-time. In our previous blog, we showed how AIS can be linked with shipping instructions data, a commercial dataset which details the type, quantity and destination of goods being shipped in containers, enabling us to monitor the journey of containerised goods in near real-time.
AIS, on its own, does not provide information about the ship’s cargo, but does include information about the ship’s identification and type (for example, cargo ship, tanker, passenger ship etc.), allowing us to extract valuable insights into global trade flows. Future blogs will include analysis on the movement of containerised goods through global maritime passages.
The maritime traffic volume for each passage is broken down by ship type, adhering to the classification used by the Department for Transport’s shipping fleet statistics. This article uses three main ship types: cargo (which includes general cargo, container, Roll-on roll-off cargo for example ships which carry wheeled cargo like cars, trucks etc., refrigerated cargo and other dry cargo ships), tanker (including oil, chemical and liquefied gas and other liquids) and other trading ships (passenger, mixed passenger/cargo ships and bulk carriers).
Potential added value
Currently, ONS uses marine traffic data as an innovative data source to address the demand for faster economic insights. We publish fortnightly experimental indicators based on ship position data to provide an early indication of the flow of goods entering and leaving UK, focusing on monitoring ship visits to UK ports. The analysis presented in this blog expands on our previous work by presenting novel experimental statistics, based on ship journeys through global maritime passages
This provides a broader geopolitical perspective and our analysis helps the UK government understand the impact of potential disruptions on international trade flows and supply chains. Moreover, it has the potential to aid in the early detection of crises and help us quantify their impact.
There are several commercial platforms which handle data processing and provide outputs derived from AIS data. In our analysis, we use raw AIS data, which provides us with enhanced flexibility in data manipulation, analysis and integration with other datasets (such as shipping instructions data). Additionally, working with the raw data allows the direct implementation of quality assessment techniques, enabling us to identify and address data errors and anomalies to increase the reliability of outputs.
Data
We use AIS data to obtain information on the position of ships in near real time. Ships transmit these data every few seconds using onboard transceivers and include information on their location, identification, and characteristics (for instance, ship type, size and draught). AIS data are provided to ONS by exactEarth/Spire Global and are accessible via the United Nations Global Platform (UNGP). The ONS Data Science Campus is leading this work, owing to data access and infrastructure.
There are several challenges associated with processing AIS data. First, their large size – UNGP stores over 11 million AIS messages a day, which makes processing them quite demanding. Additionally, raw AIS data typically have various quality issues, such as invalid data, errors, missing values abnormal entries and duplicate records.
These arise from factors such as communication link problems, channel interference and deliberate tampering with AIS equipment. AIS data can be switched off by the ship’s crew, rendering the ship untraceable. Our processing pipeline is designed to enhance data quality by addressing and mitigating these issues. However, it is crucial to note that complete elimination of these issues is not feasible.
Methodology
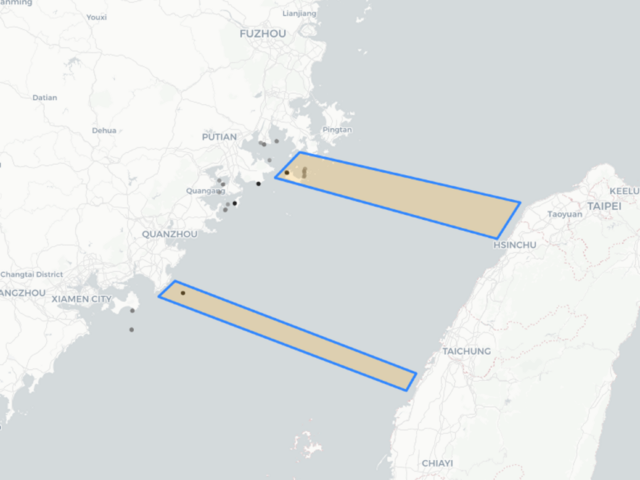
Our methodology is to position two polygons at each end of the passage (Figure 2). A ship is considered to have completed a crossing when it traverses both polygons. This method allows us to determine the direction a ship is moving and analyse its behaviour within a passage, including instances of stopping at a port.
Figure 2: Placement of polygons to capture crossings through the Taiwan Strait
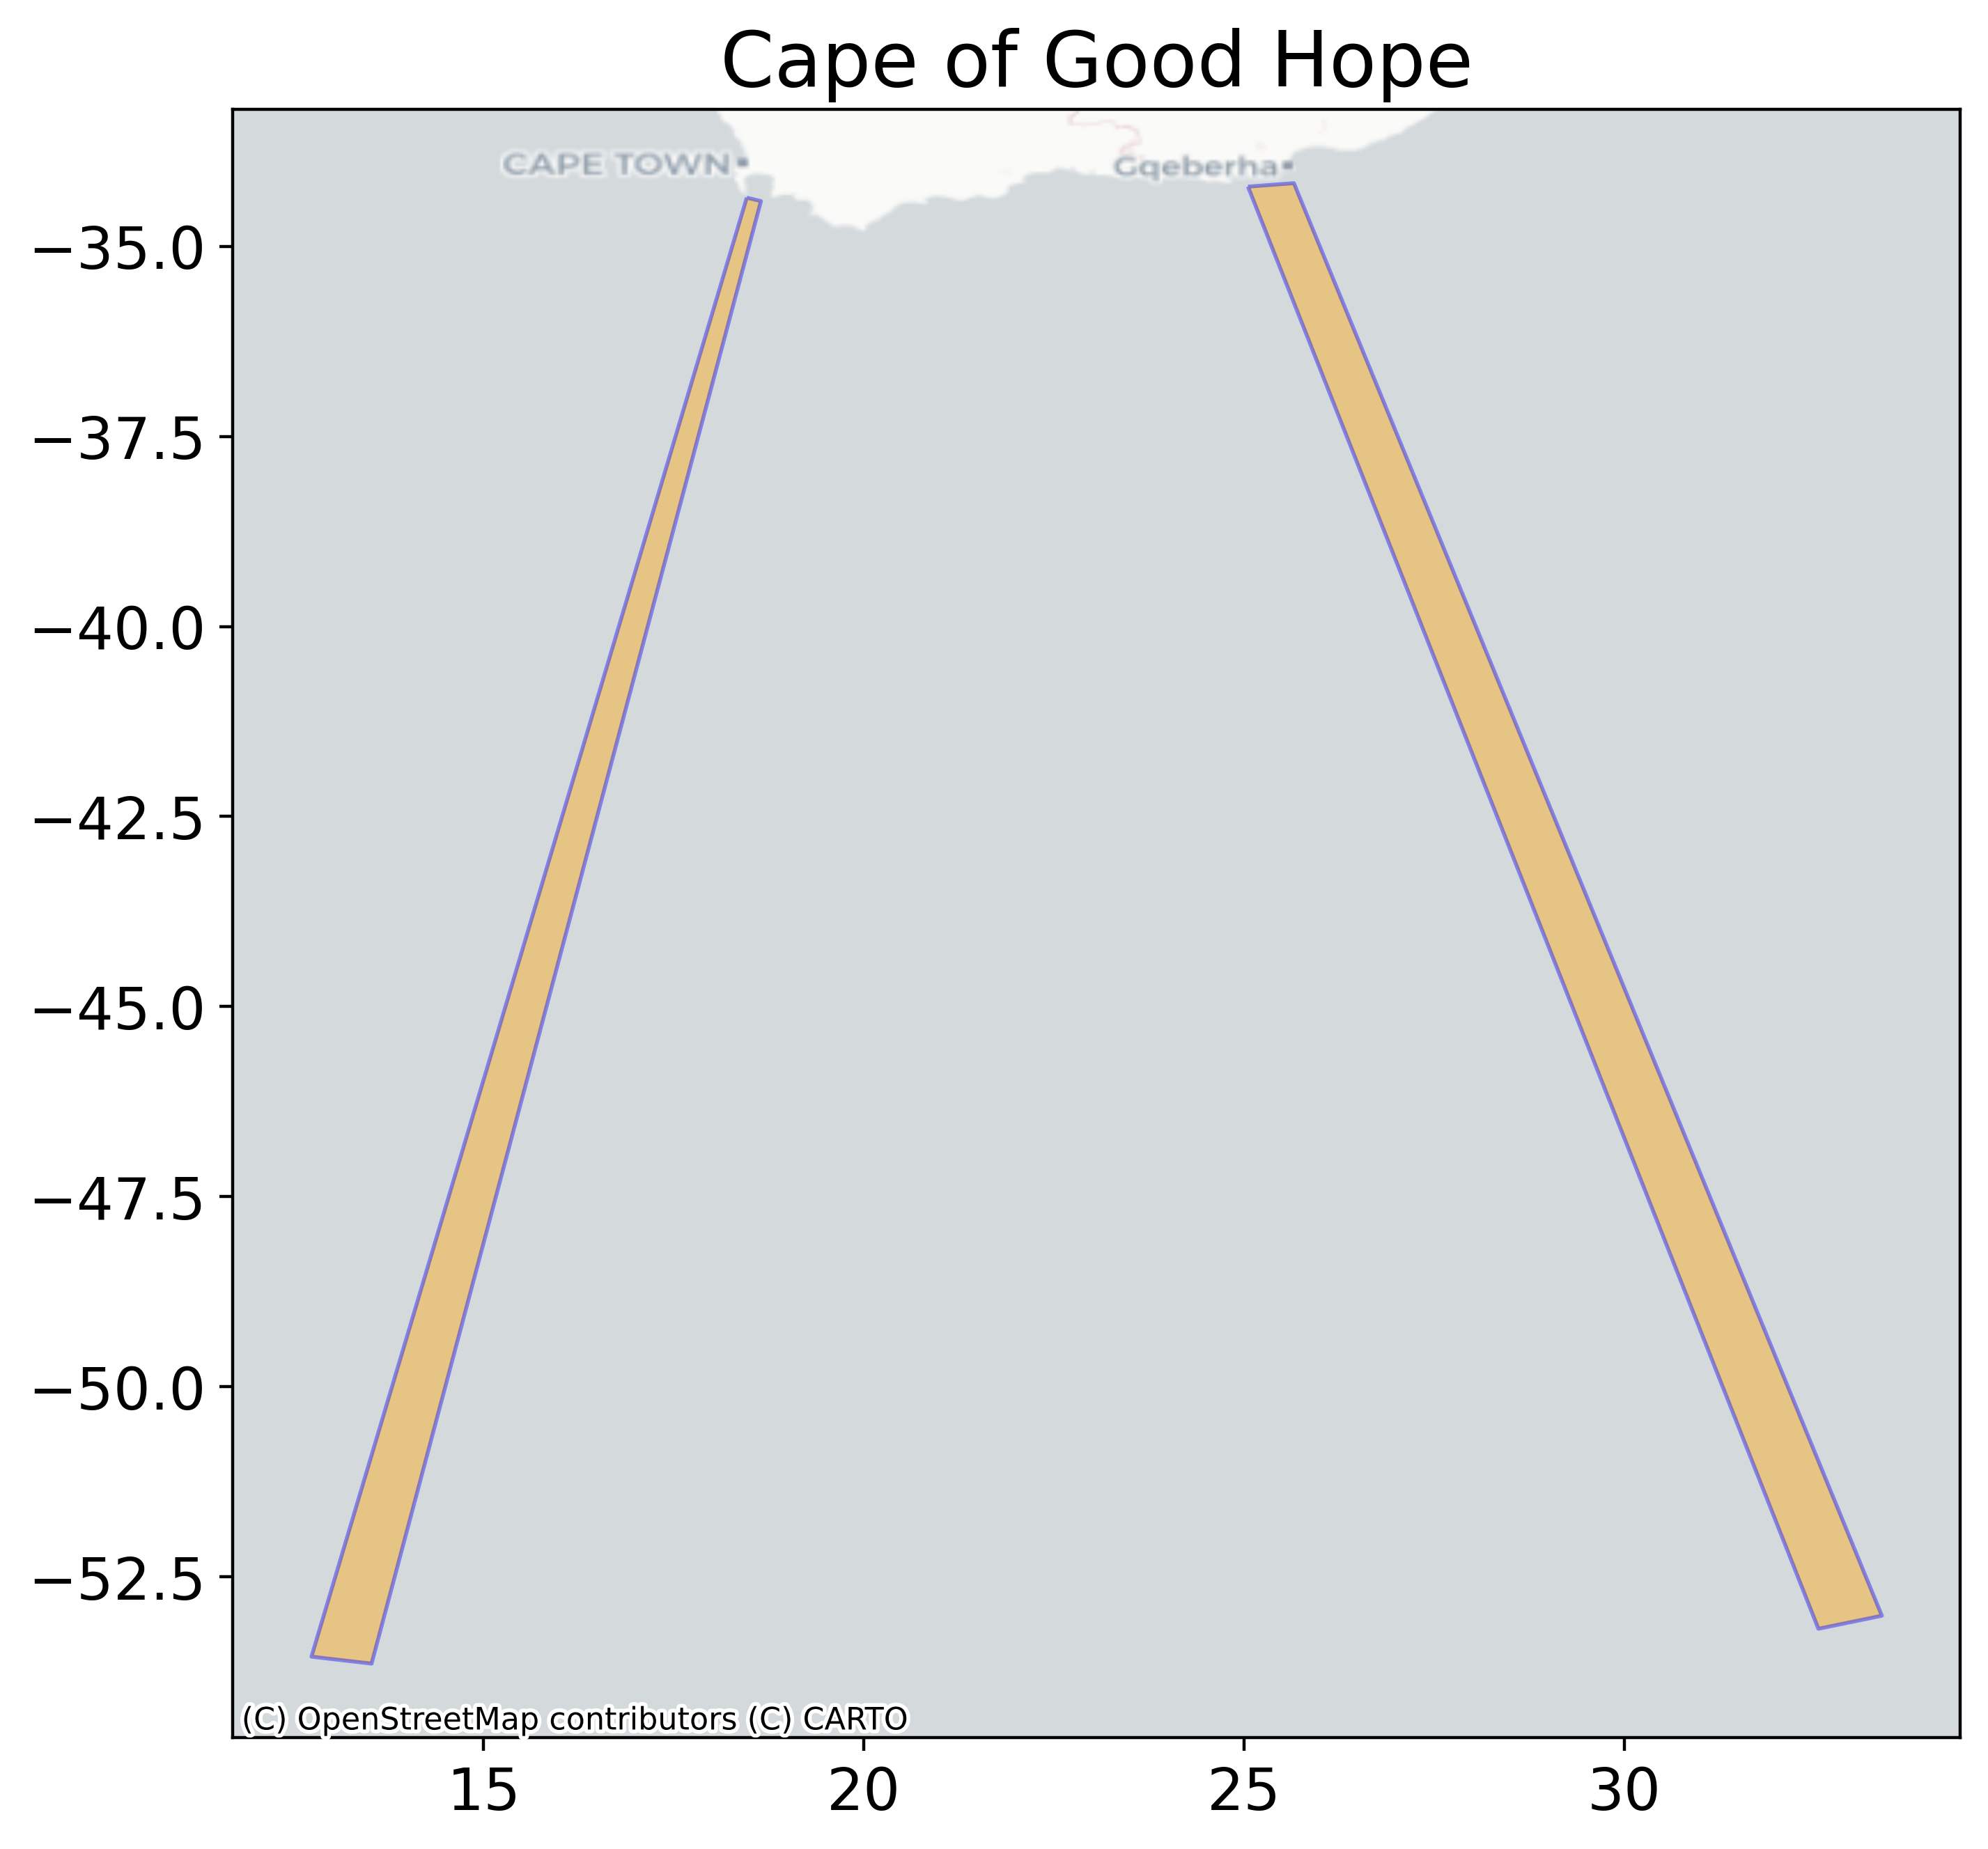
The polygons designating the entry and exit points of the passages were provided by DfT, Figures 3 to 8 illustrate the placement of the polygons, with the x and y axes representing longitude and latitude respectively. We modified the polygons for some passages, such as the Suez Canal, by expanding their width to ensure that, in cases where ship positions are received intermittently across a vast area, the ship’s trajectory intersects both the entry and exit polygons.
Figure 3: Placement of polygons to capture crossings through the Strait of Hormuz
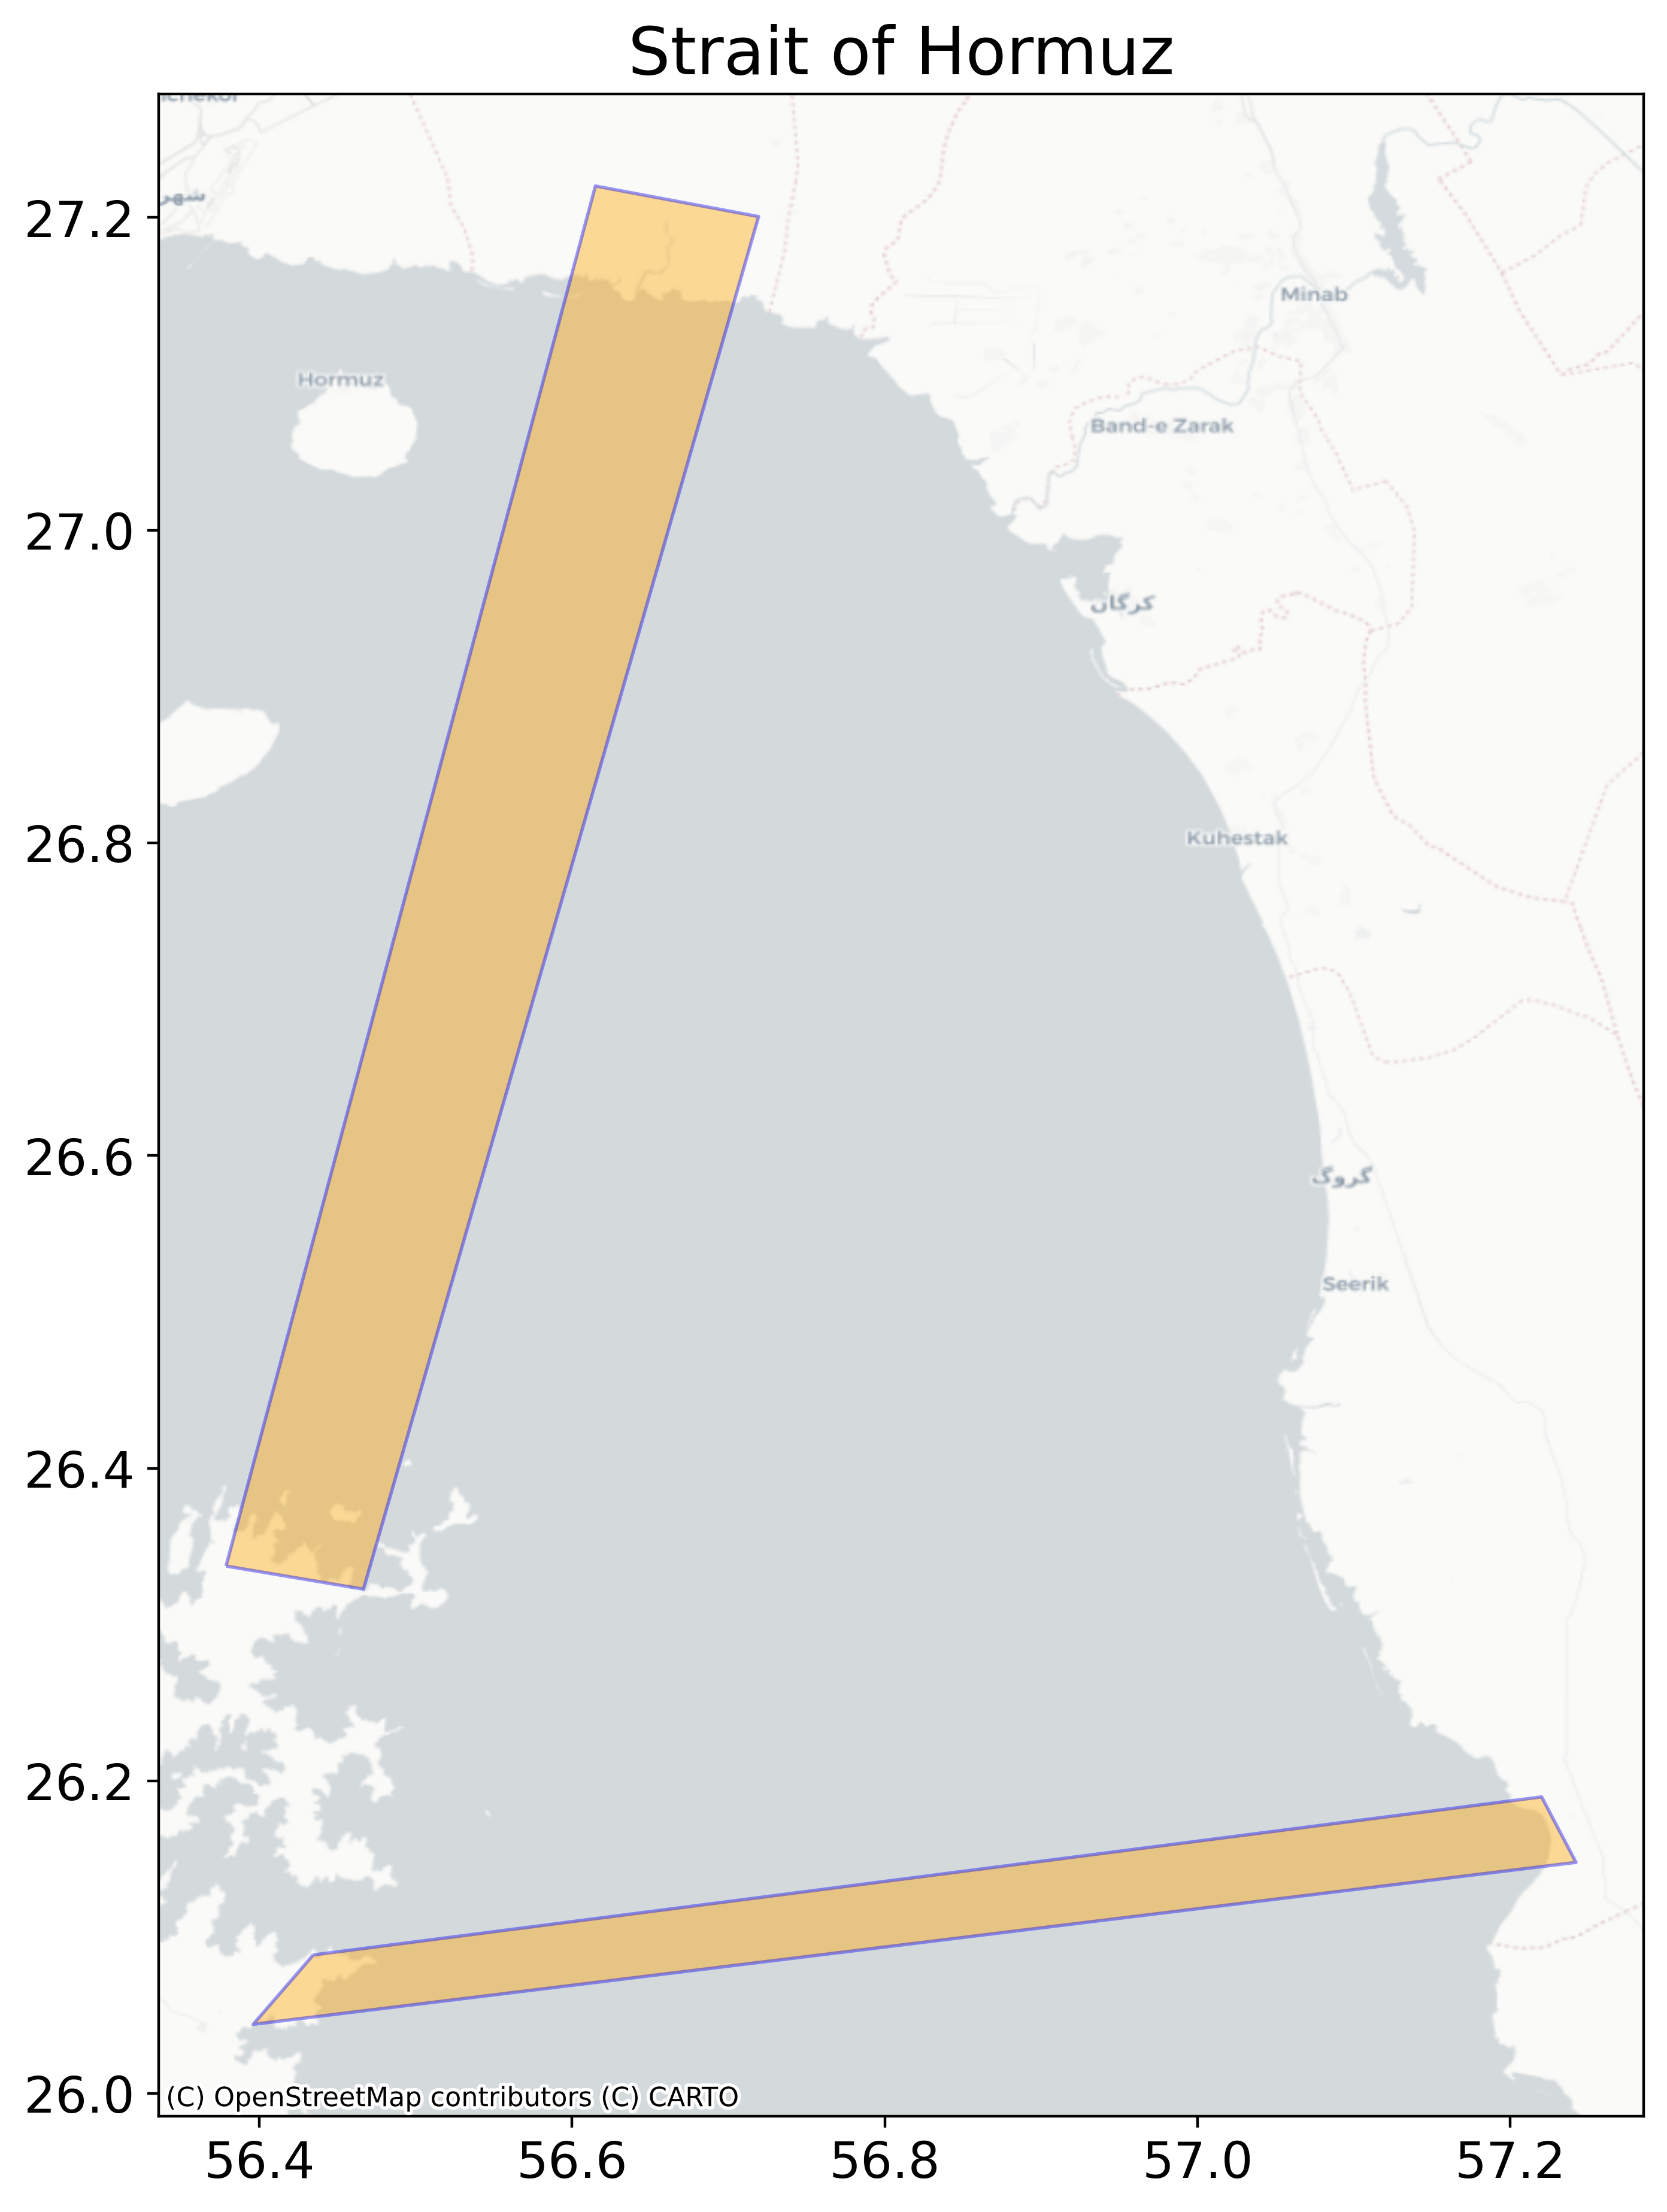
Figure 4: Placement of polygons to capture crossings through the Taiwan Strait
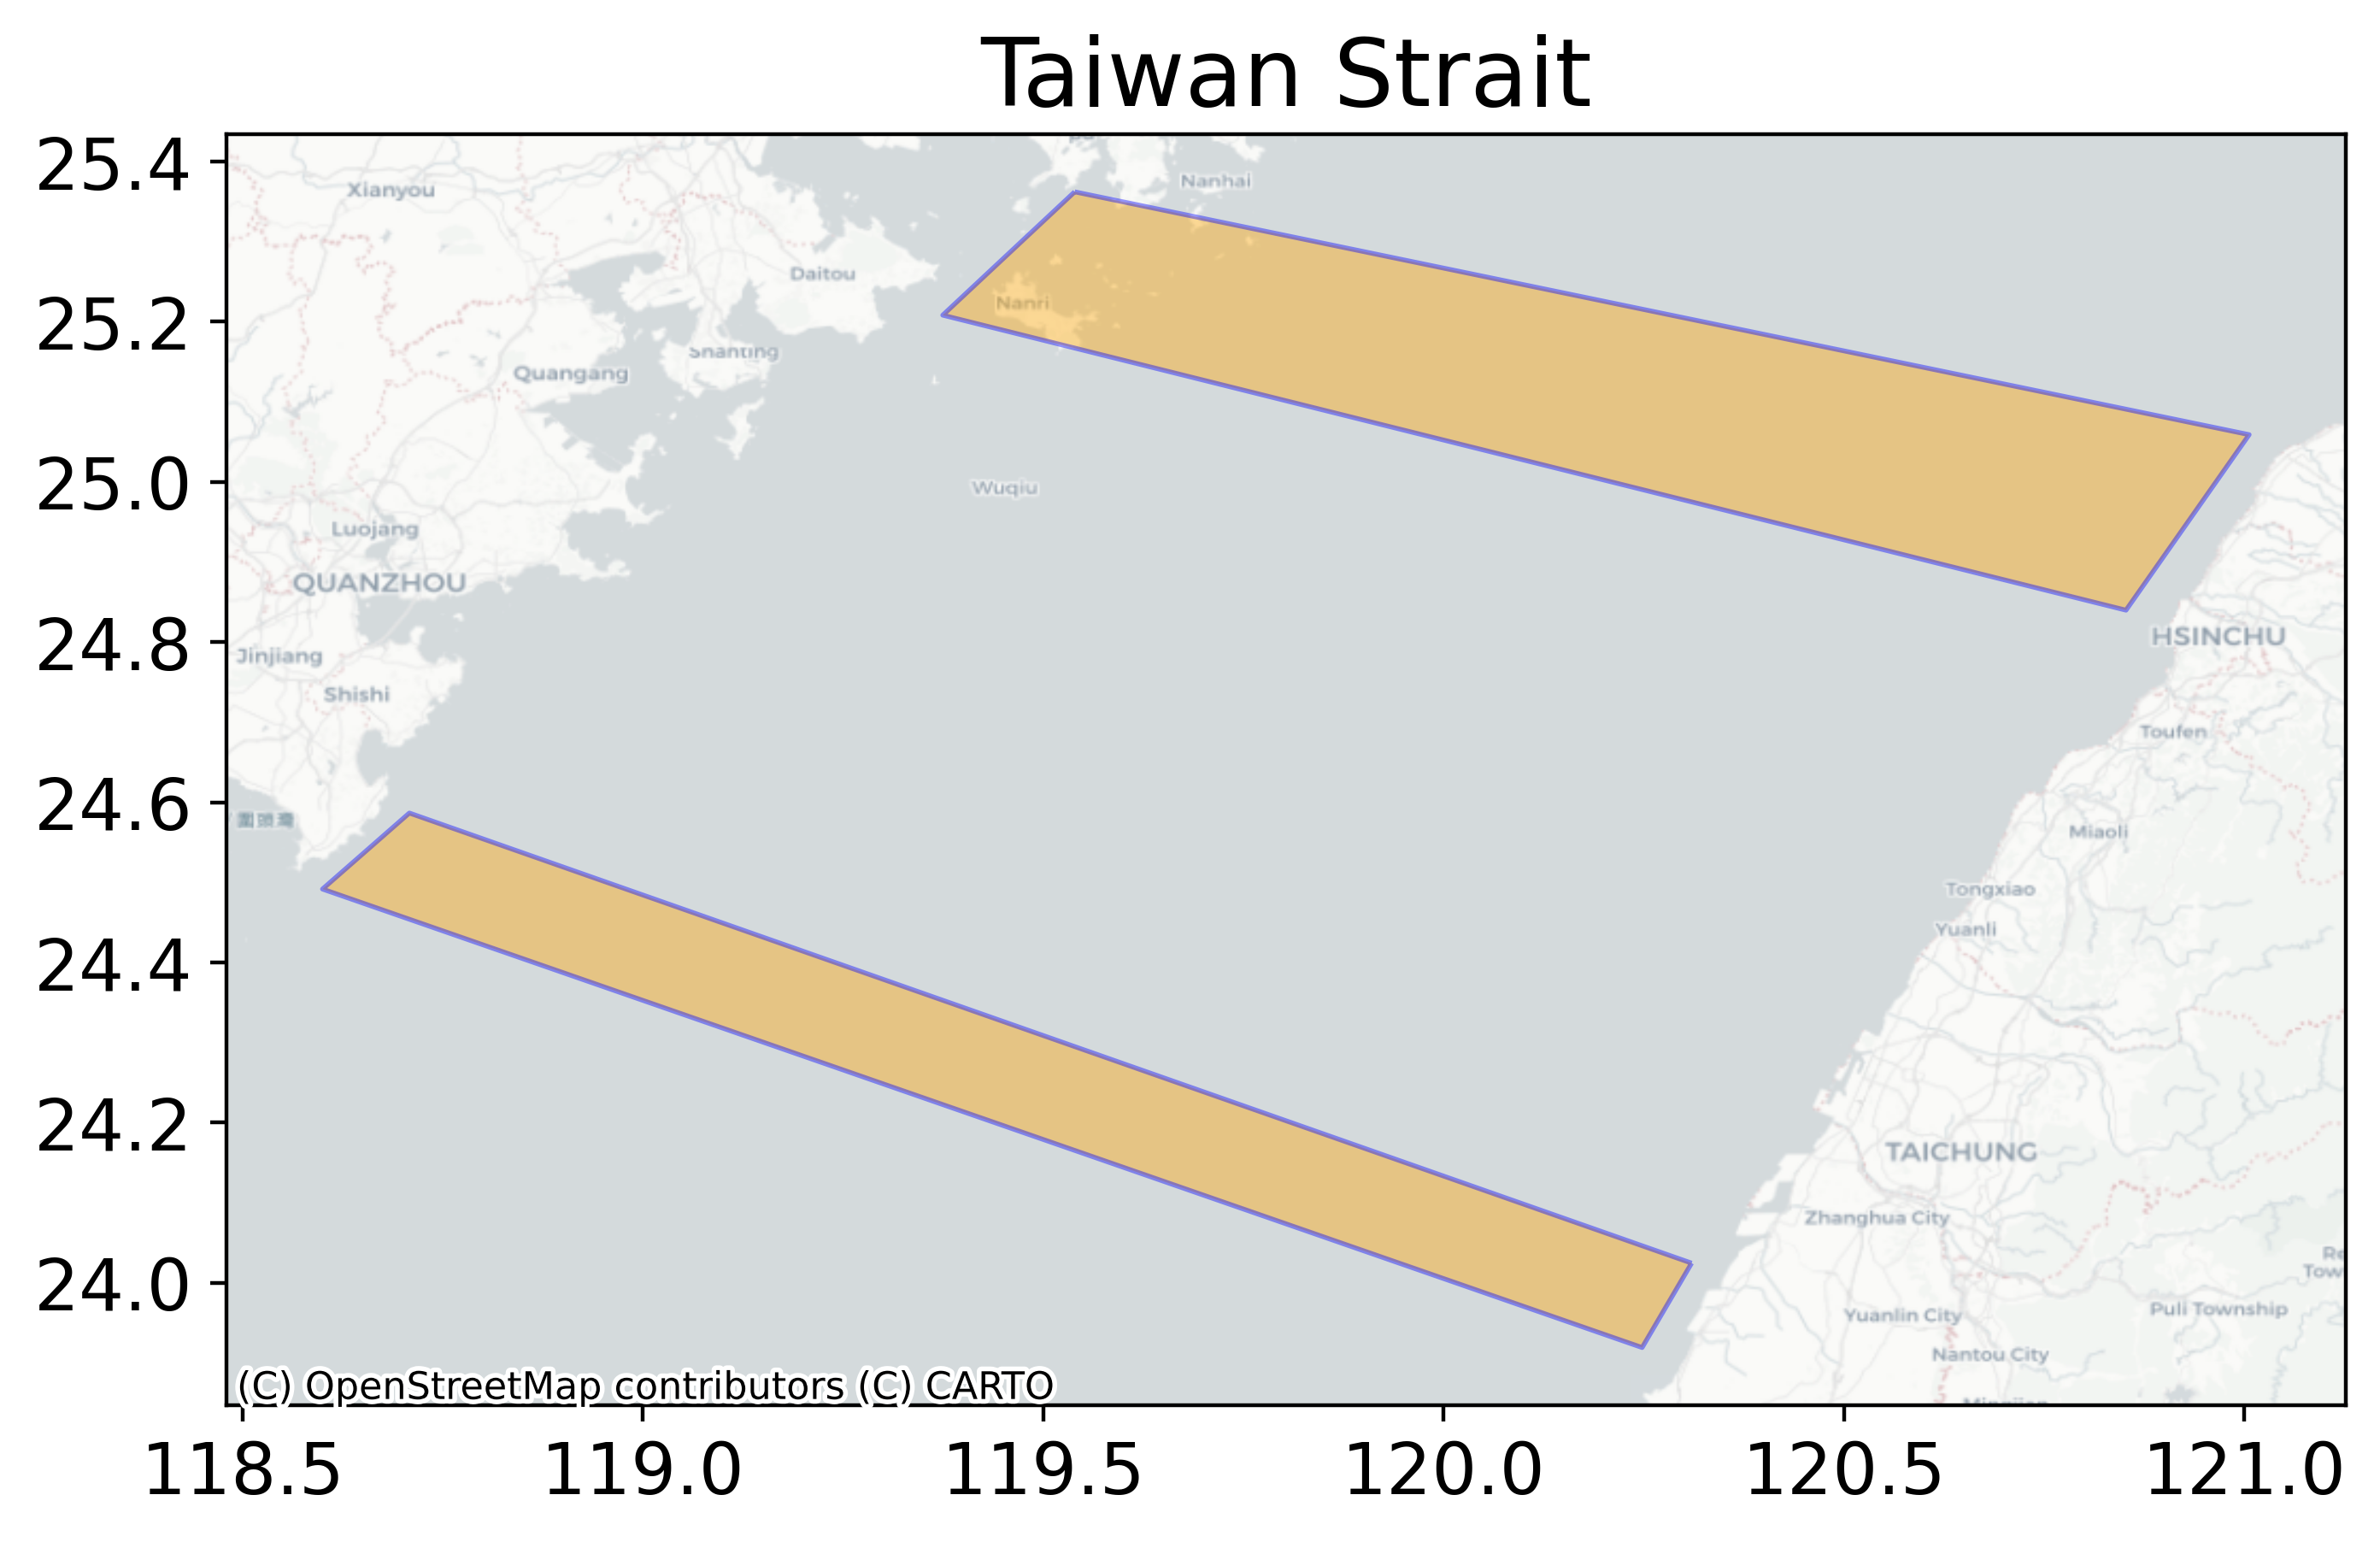
Figure 5: Placement of polygons to capture crossings through the Suez Canal
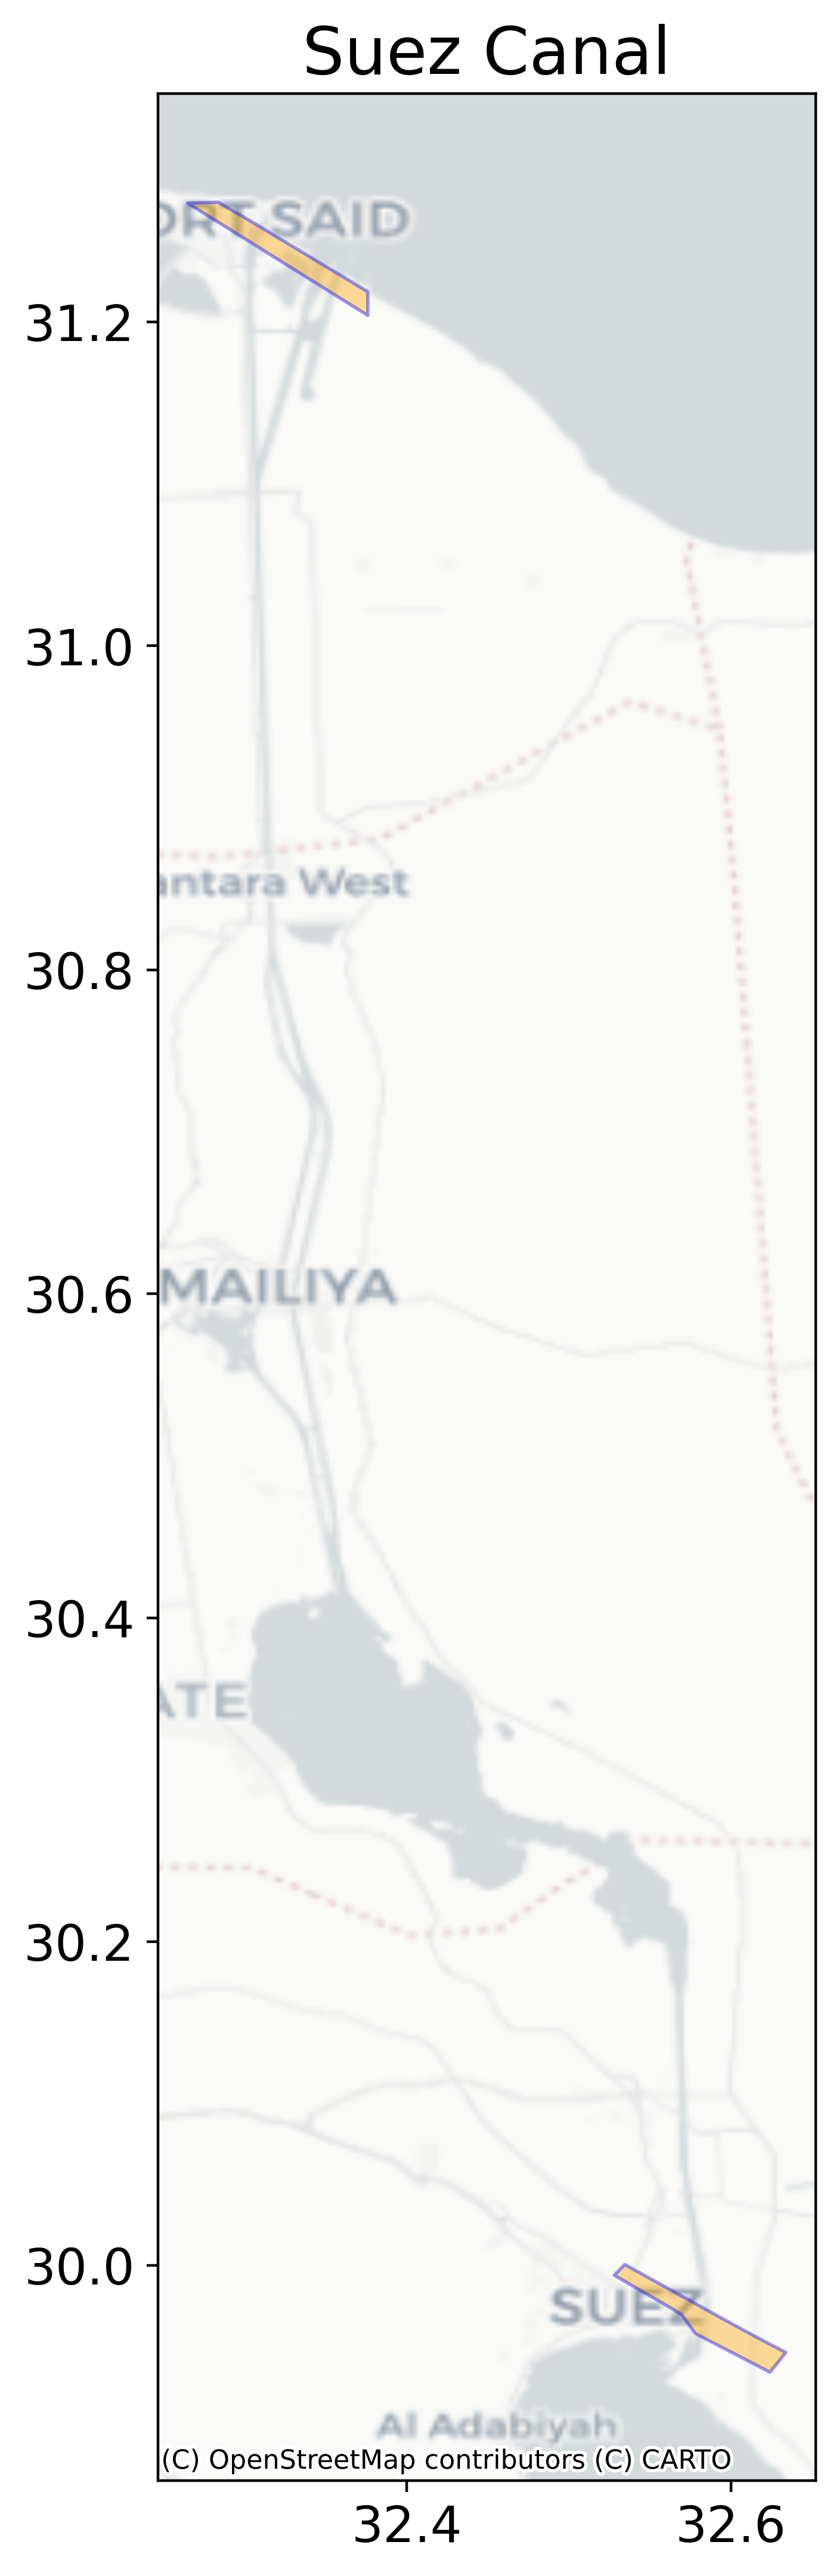
Figure 6: Placement of polygons to capture crossings through the Bab-Al Mandab Strait
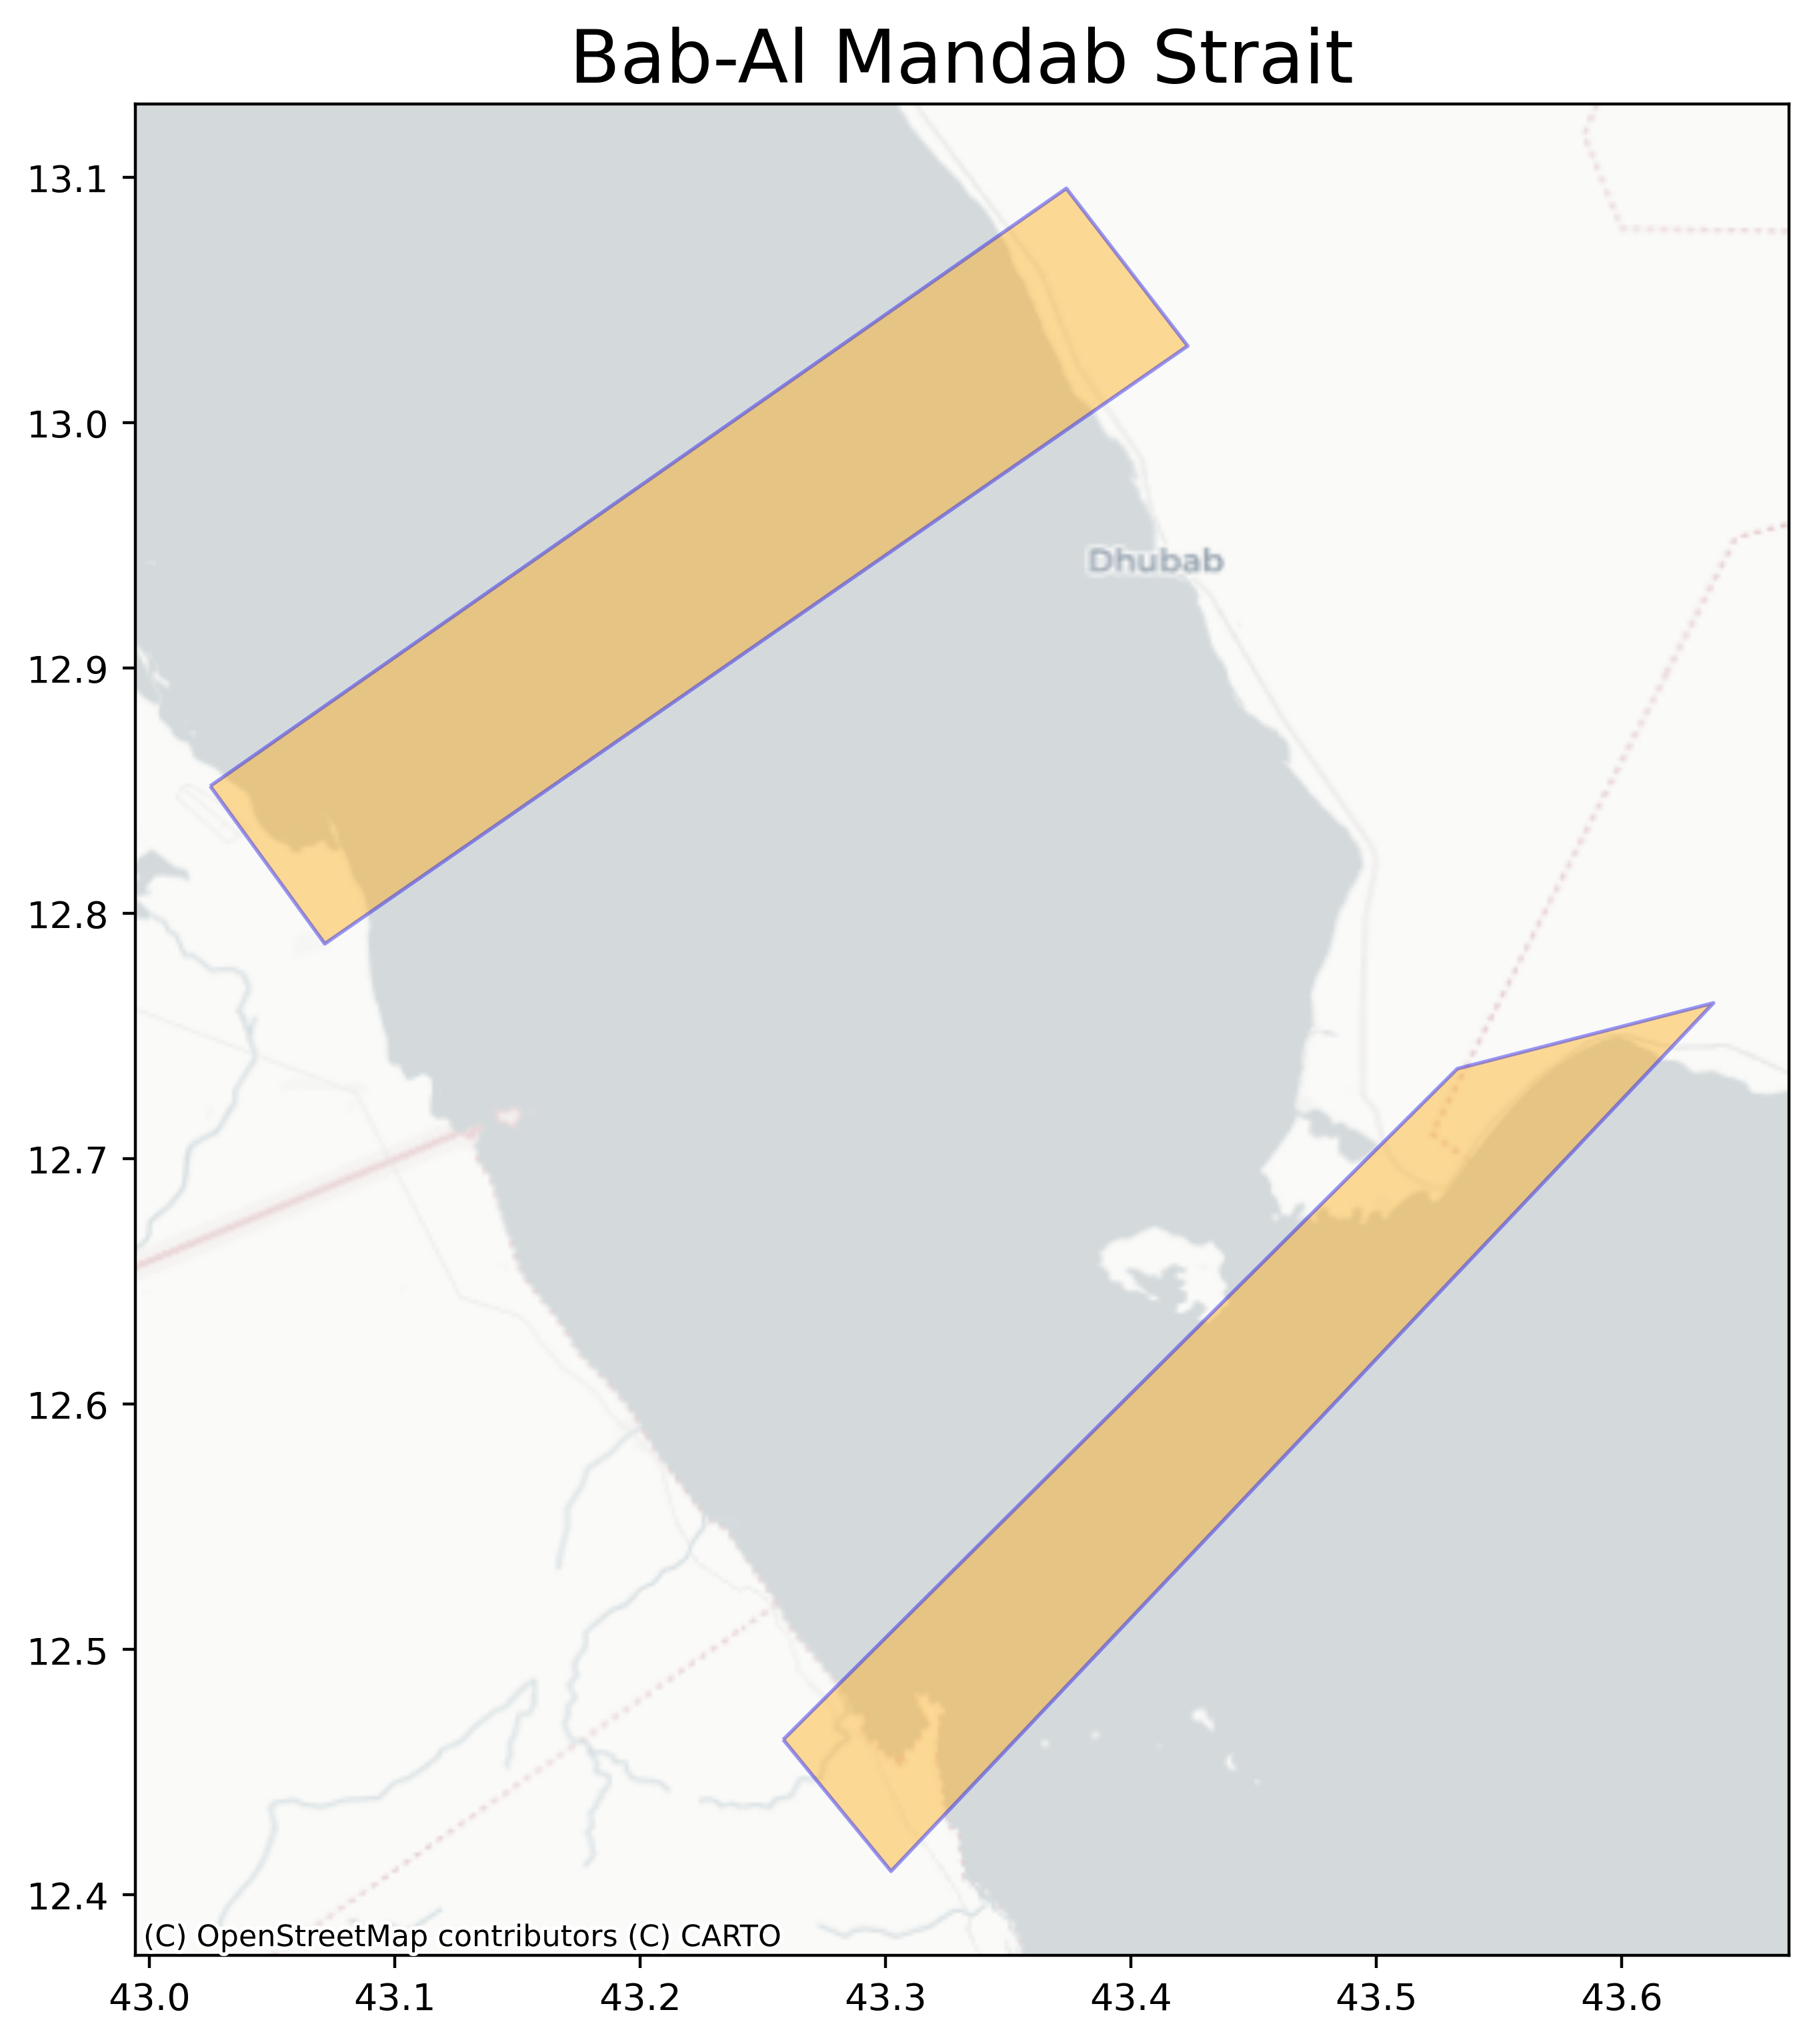
Figure 7: Placement of polygons to capture crossings through the Strait of Dover.
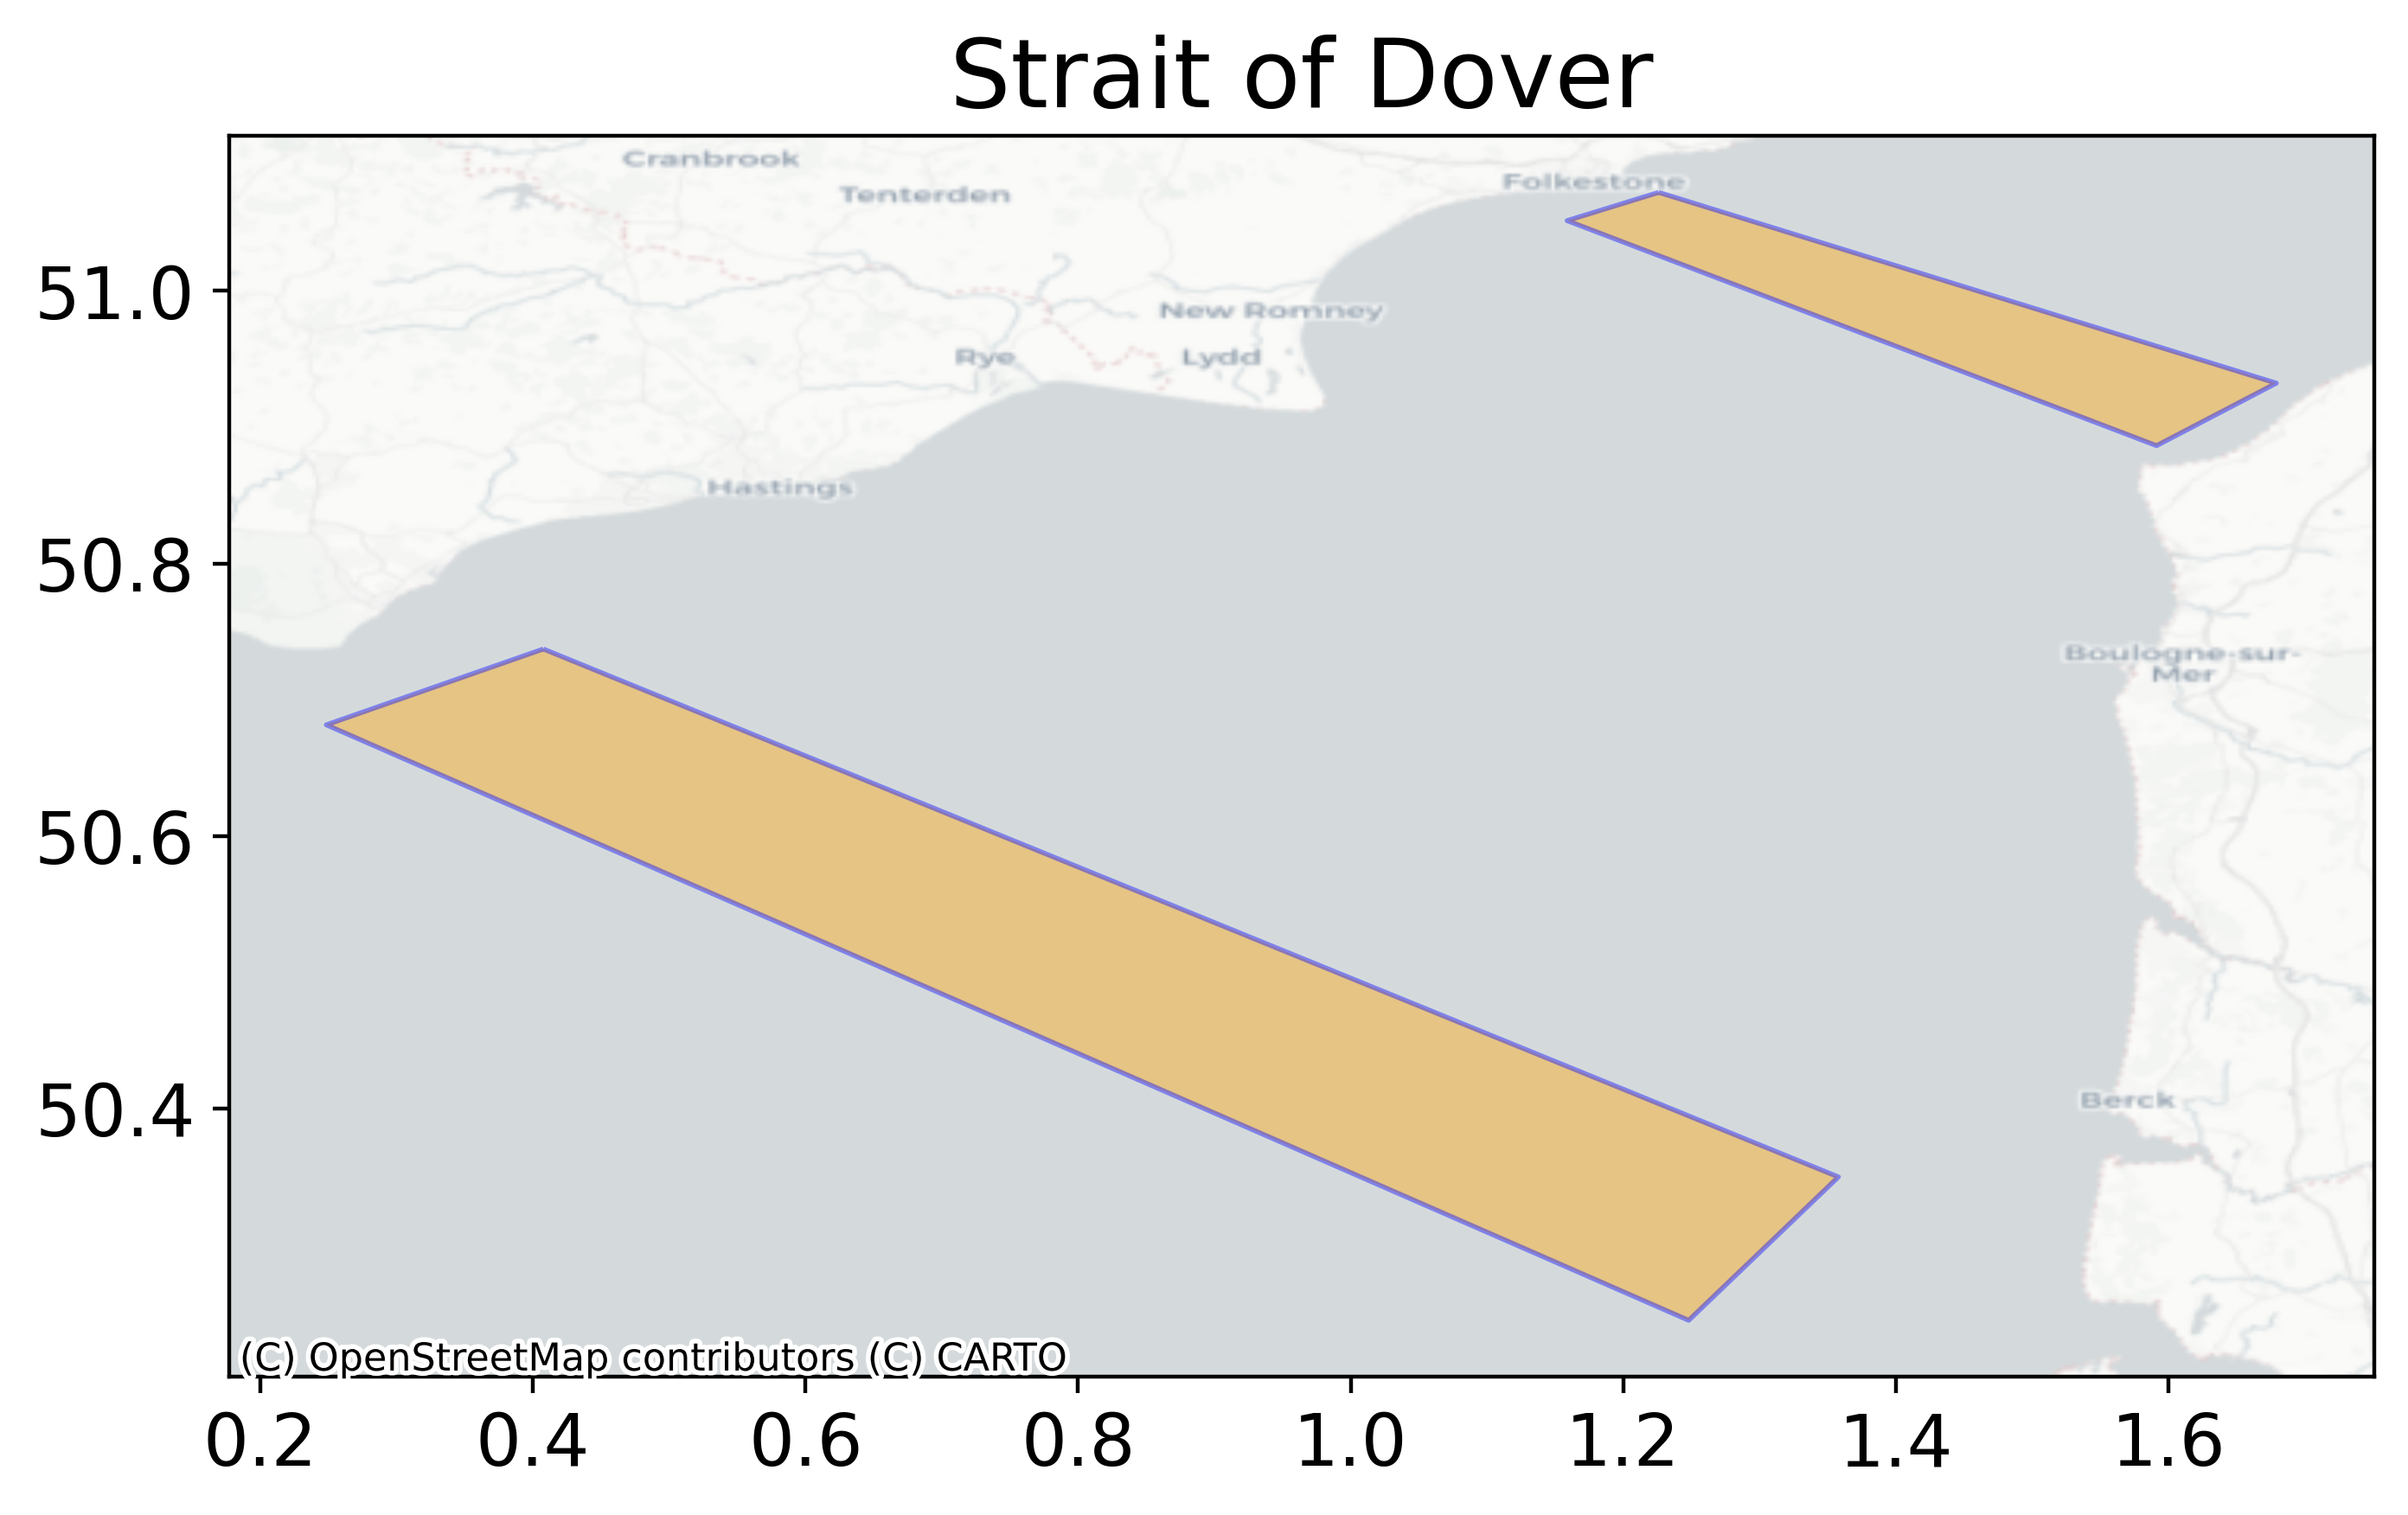
Figure 8: Placement of polygons to capture crossings around the Cape of Good Hope
Outputs
In our initial work, we focused on six passages of geopolitical, economic and trade importance, specifically the Strait of Dover, Suez Canal, Bab-Al Mandab Strait, Strait of Hormuz, Cape of Good Hope and the Taiwan Strait. For each passage, we produced a time series of the weekly count of trading ships navigating through the passage and breakdowns by ship type.
Note that we have excluded data points from periods where the data were deemed unreliable. This is attributed to the presence of noise or poor quality AIS data as explained in Section: Limitations, caveats, and validation strategy.
Information on ship type have been retrieved using a recent snapshot of the ships’ register. The register offers a high degree of accuracy, as it compiles data from various reliable sources (classification societies, flag administrations, port authorities) and is generally more accurate than ship type information reported in AIS data. However, as ships’ classifications can change over time, the ships’ register may not assign correct information for all ships throughout the year. In our future work, we aim to extend our analysis to include more global routes, prioritising trade corridors through the Strait of Gibraltar and the Panama Canal.
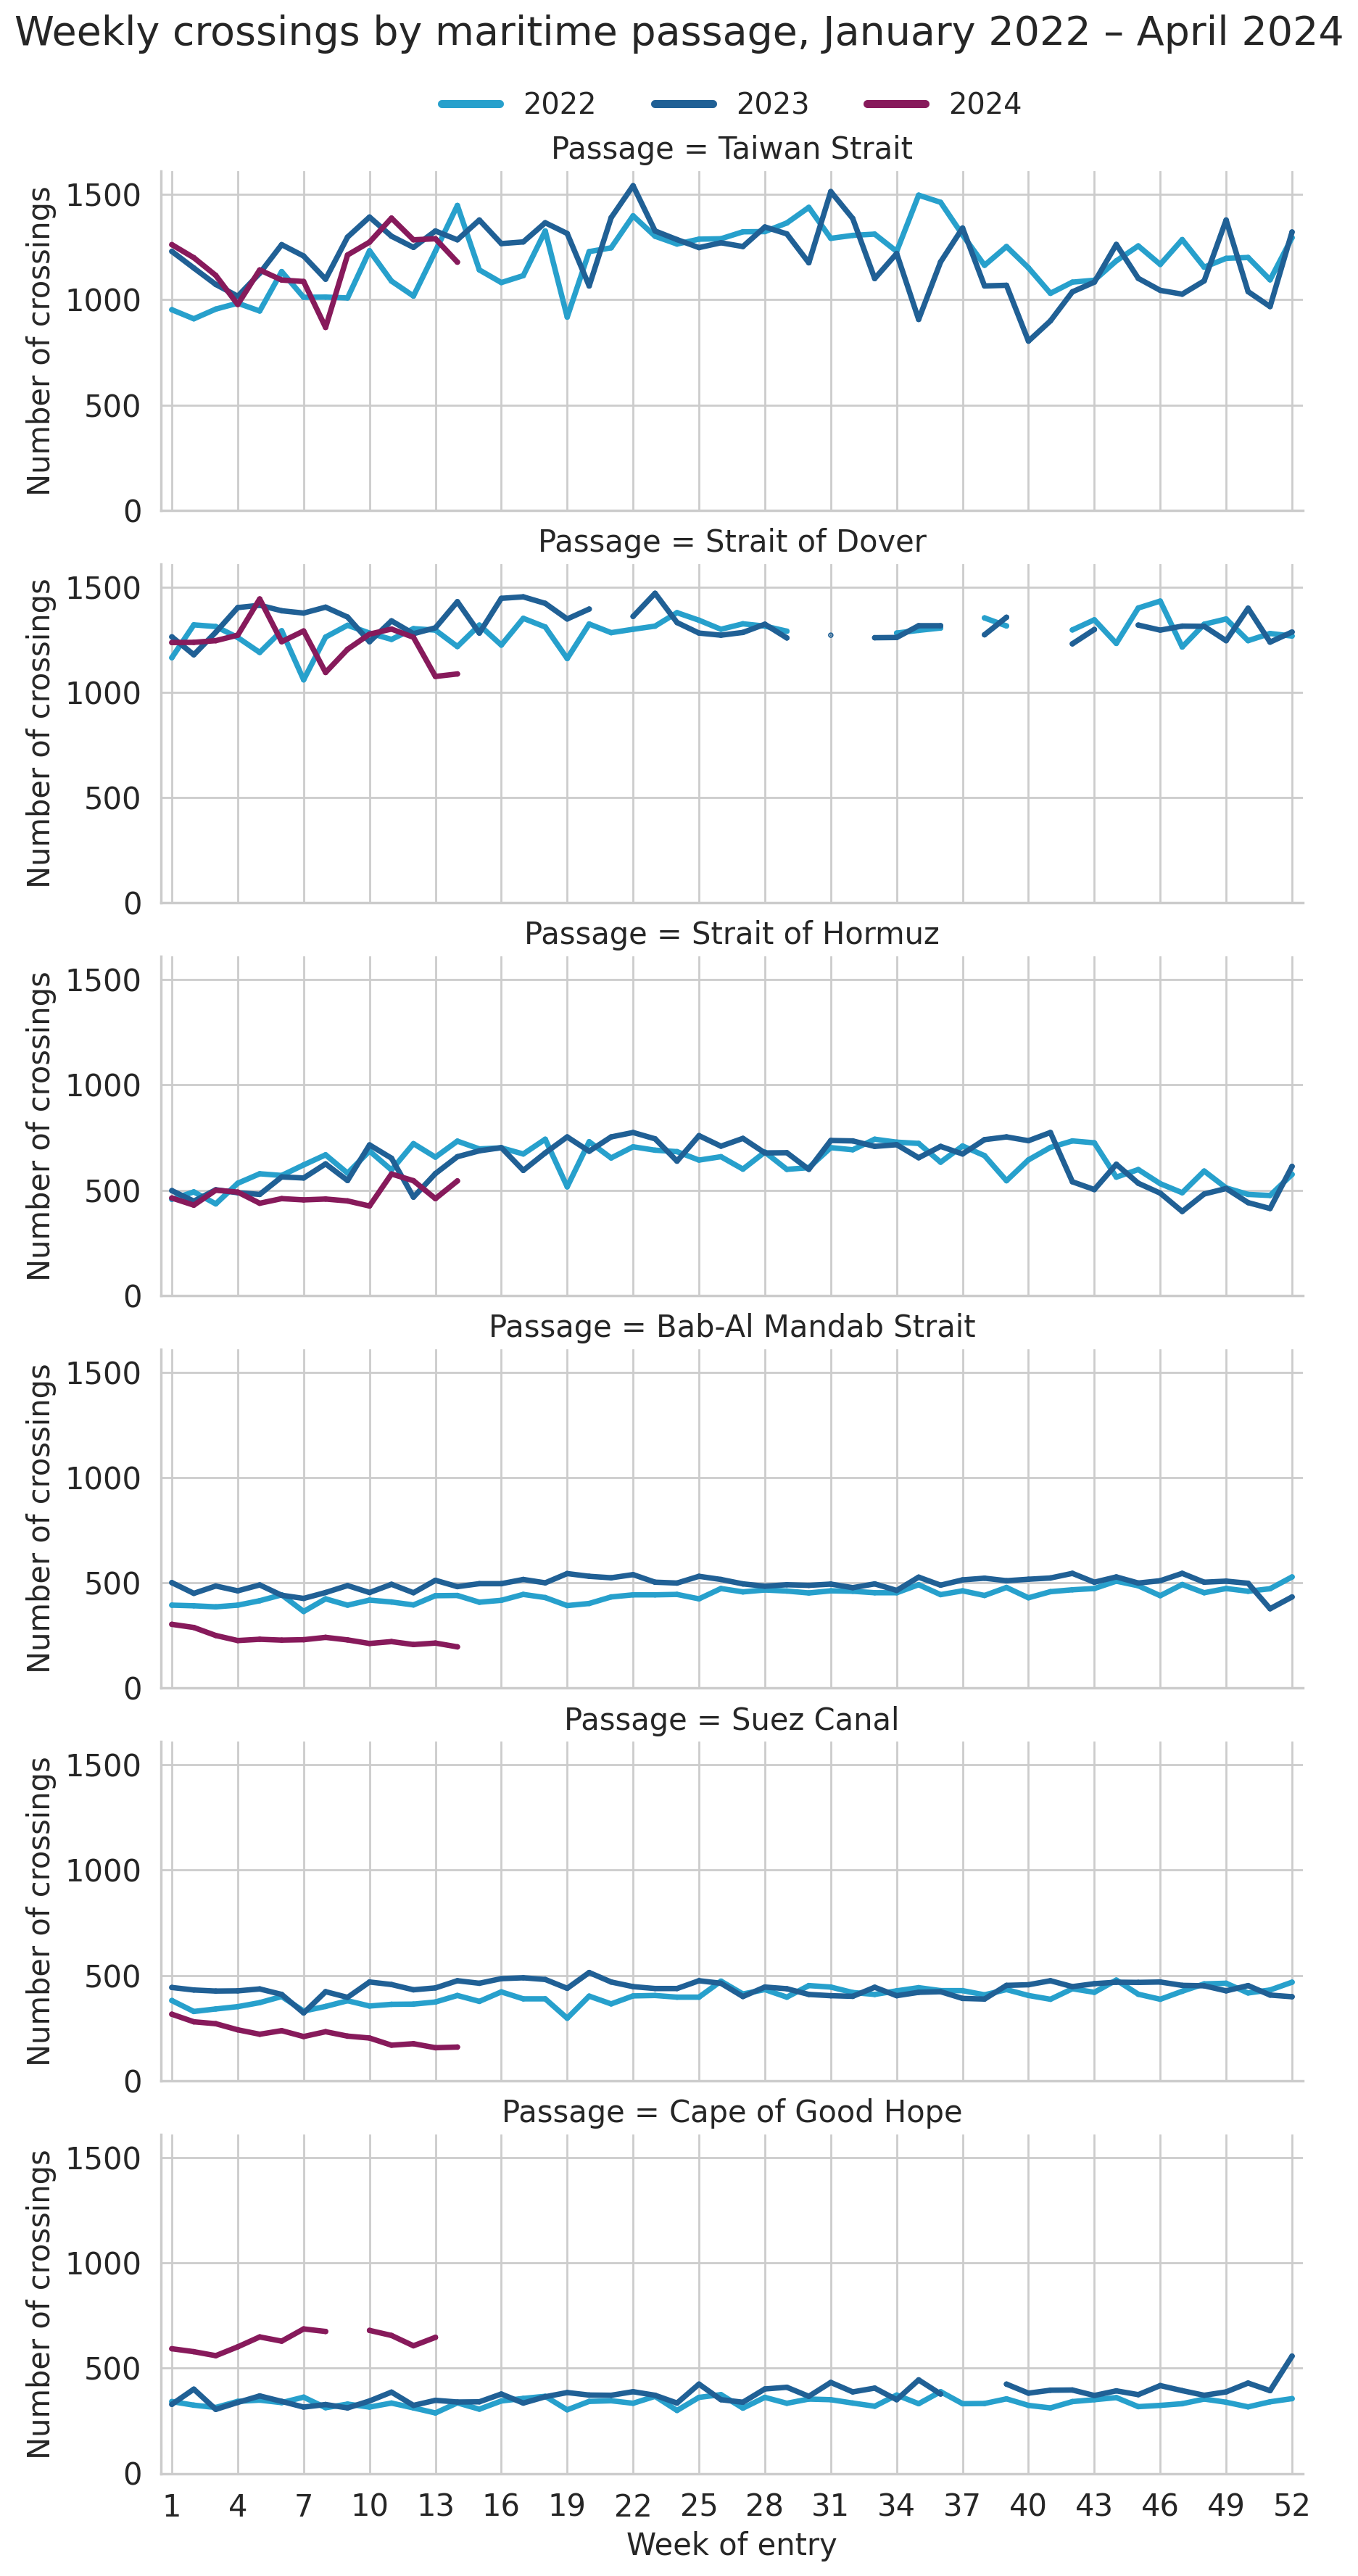
The Strait of Dover and Taiwan Strait are the busiest passages of the six examined with approximately, on average, 1,300 and 1,200 weekly ship crossings respectively in 2023 (Figure 9). The average number of weekly crossings through the Strait of Dover was three times larger than the average weekly number of ship crossings through the Suez Canal.
While ship traffic through Bab-Al Mandab and the Suez Canal are relatively consistent throughout the year, the first and last two months of the year are typically quieter periods at the Strait of Hormuz. Average weekly number of crossings between weeks 10 and 44 (which roughly aligns with March to October 2023) are 35% higher than average weekly crossings throughout the rest of the year.
Figure 9: Weekly number of crossings by passage
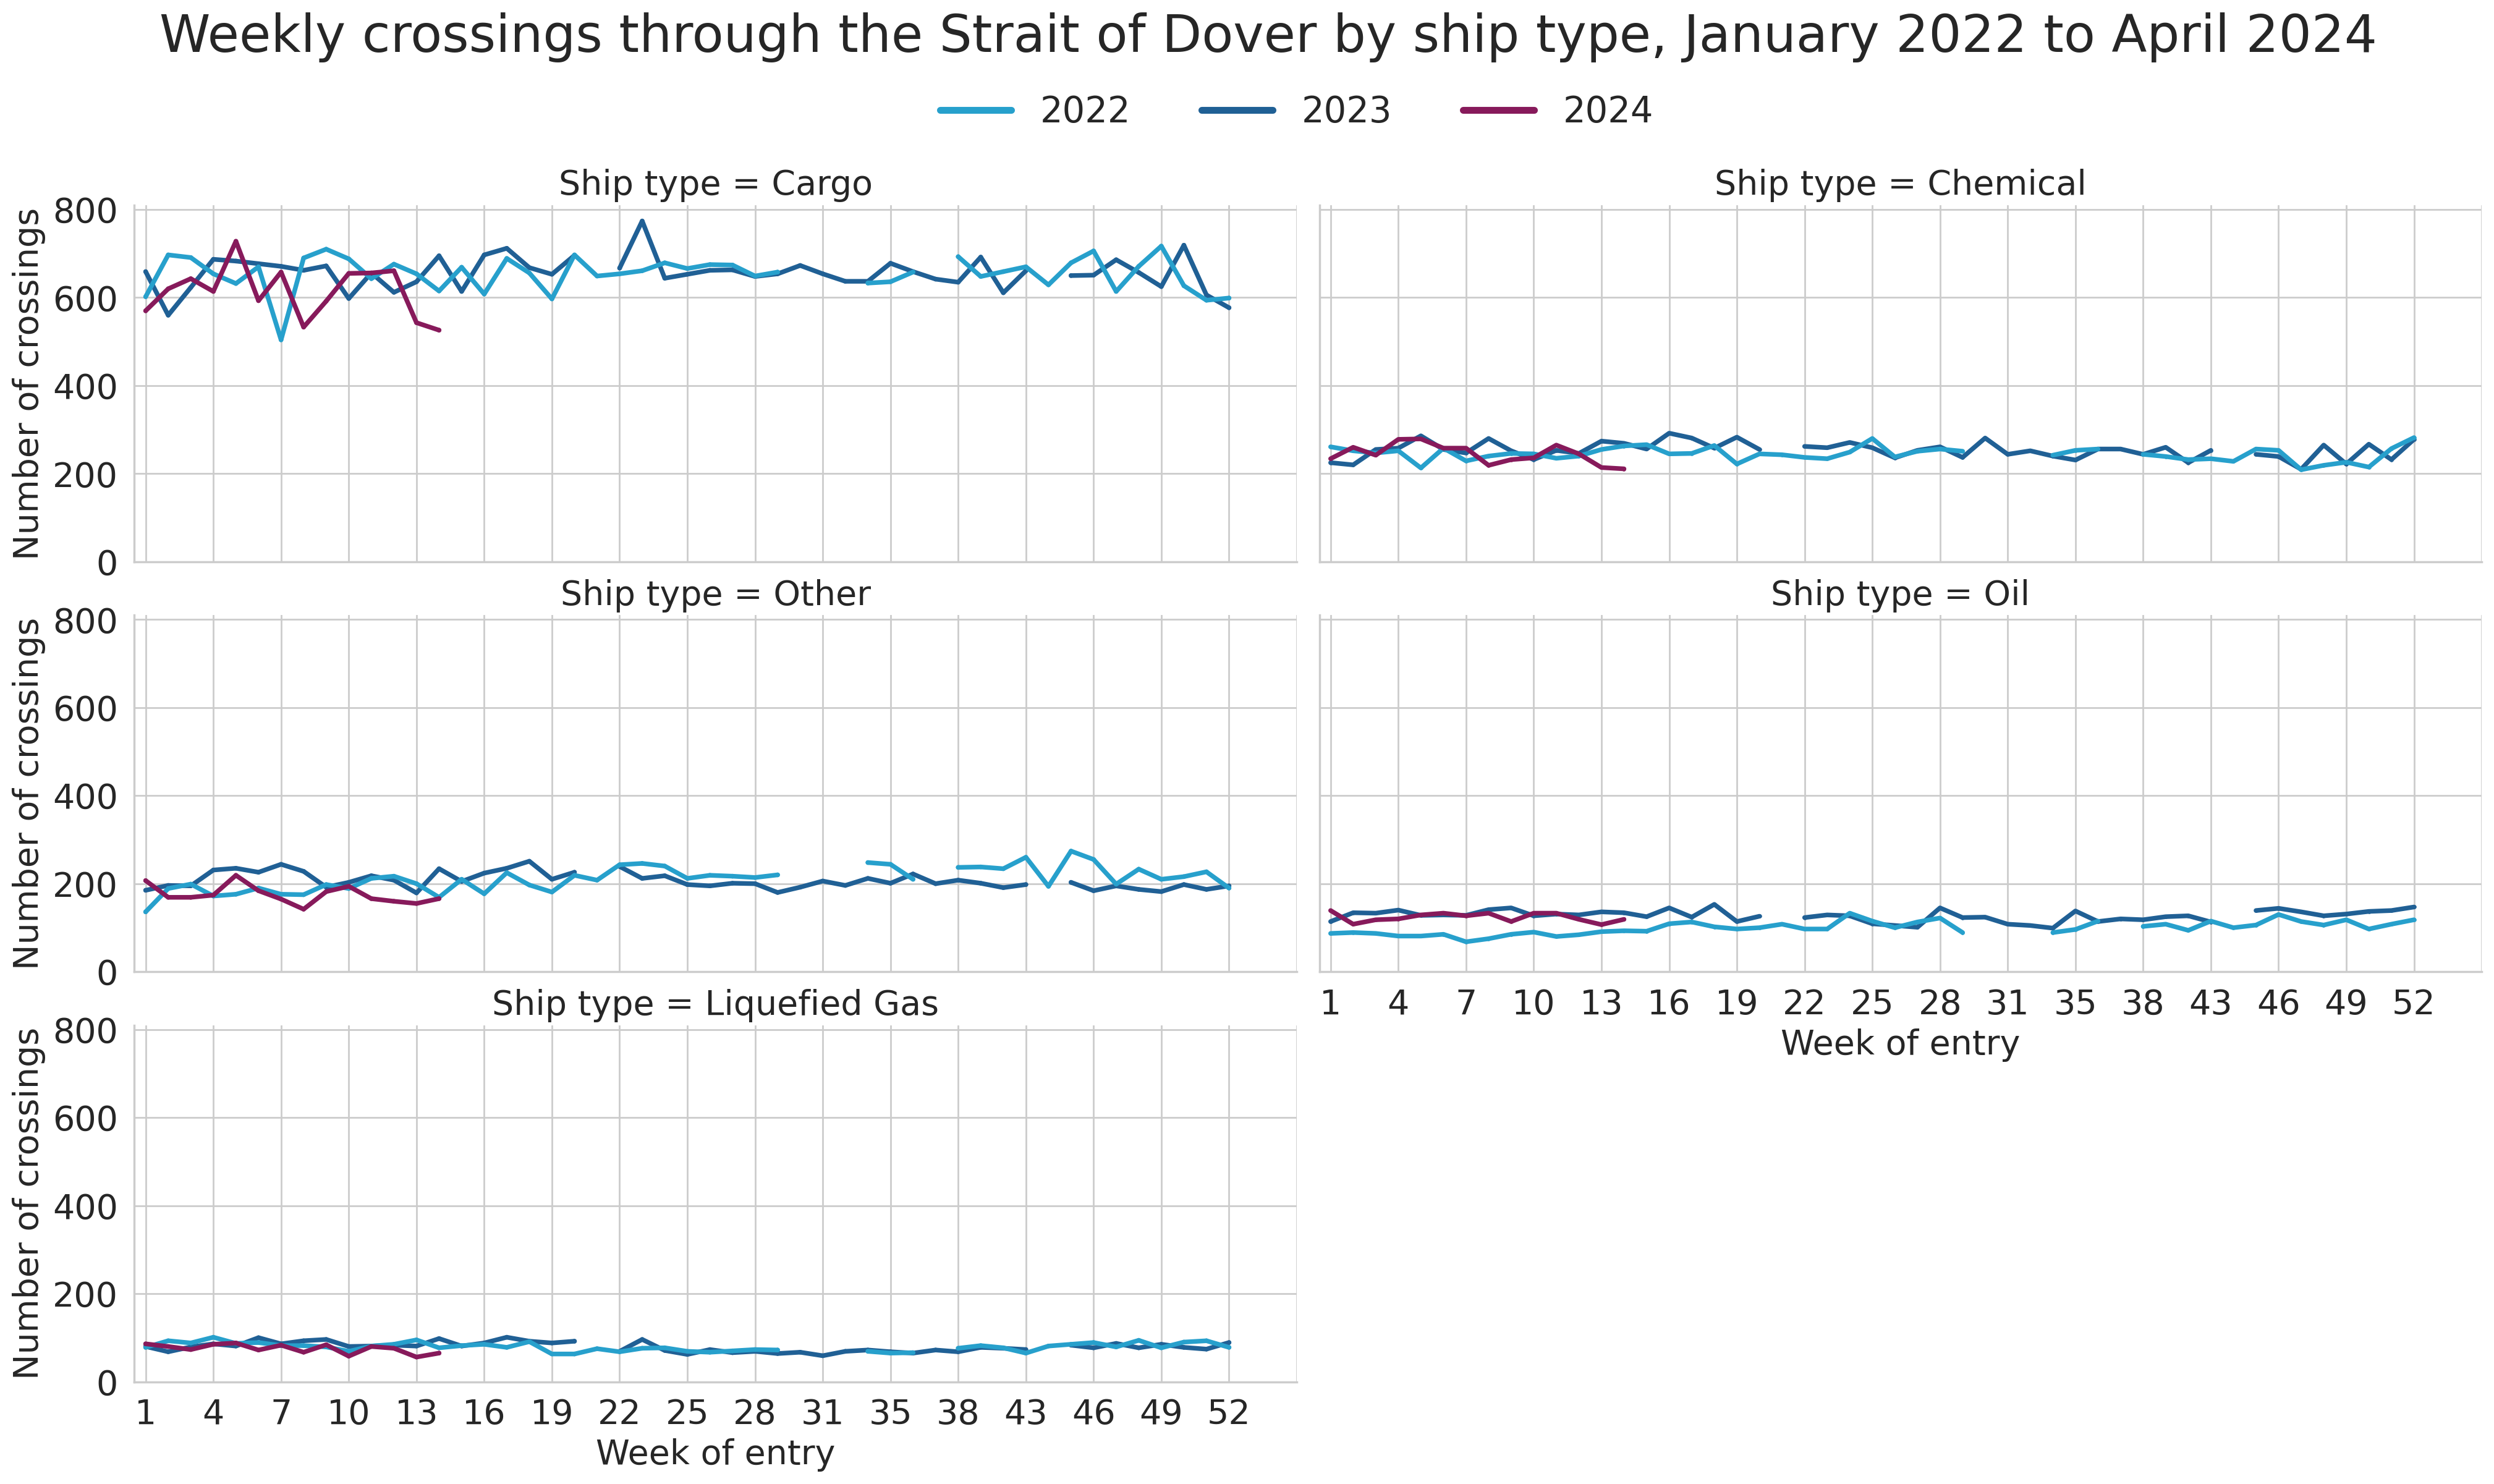
Cargo ships were by far the most common type of ship passing through the straits of Taiwan and Dover, accounting for 60% and 50% of total crossings through each passage respectively in 2023 (Figure 10 and Figure 11).
Figure 10: Weekly number of crossings through Taiwan Strait by ship type
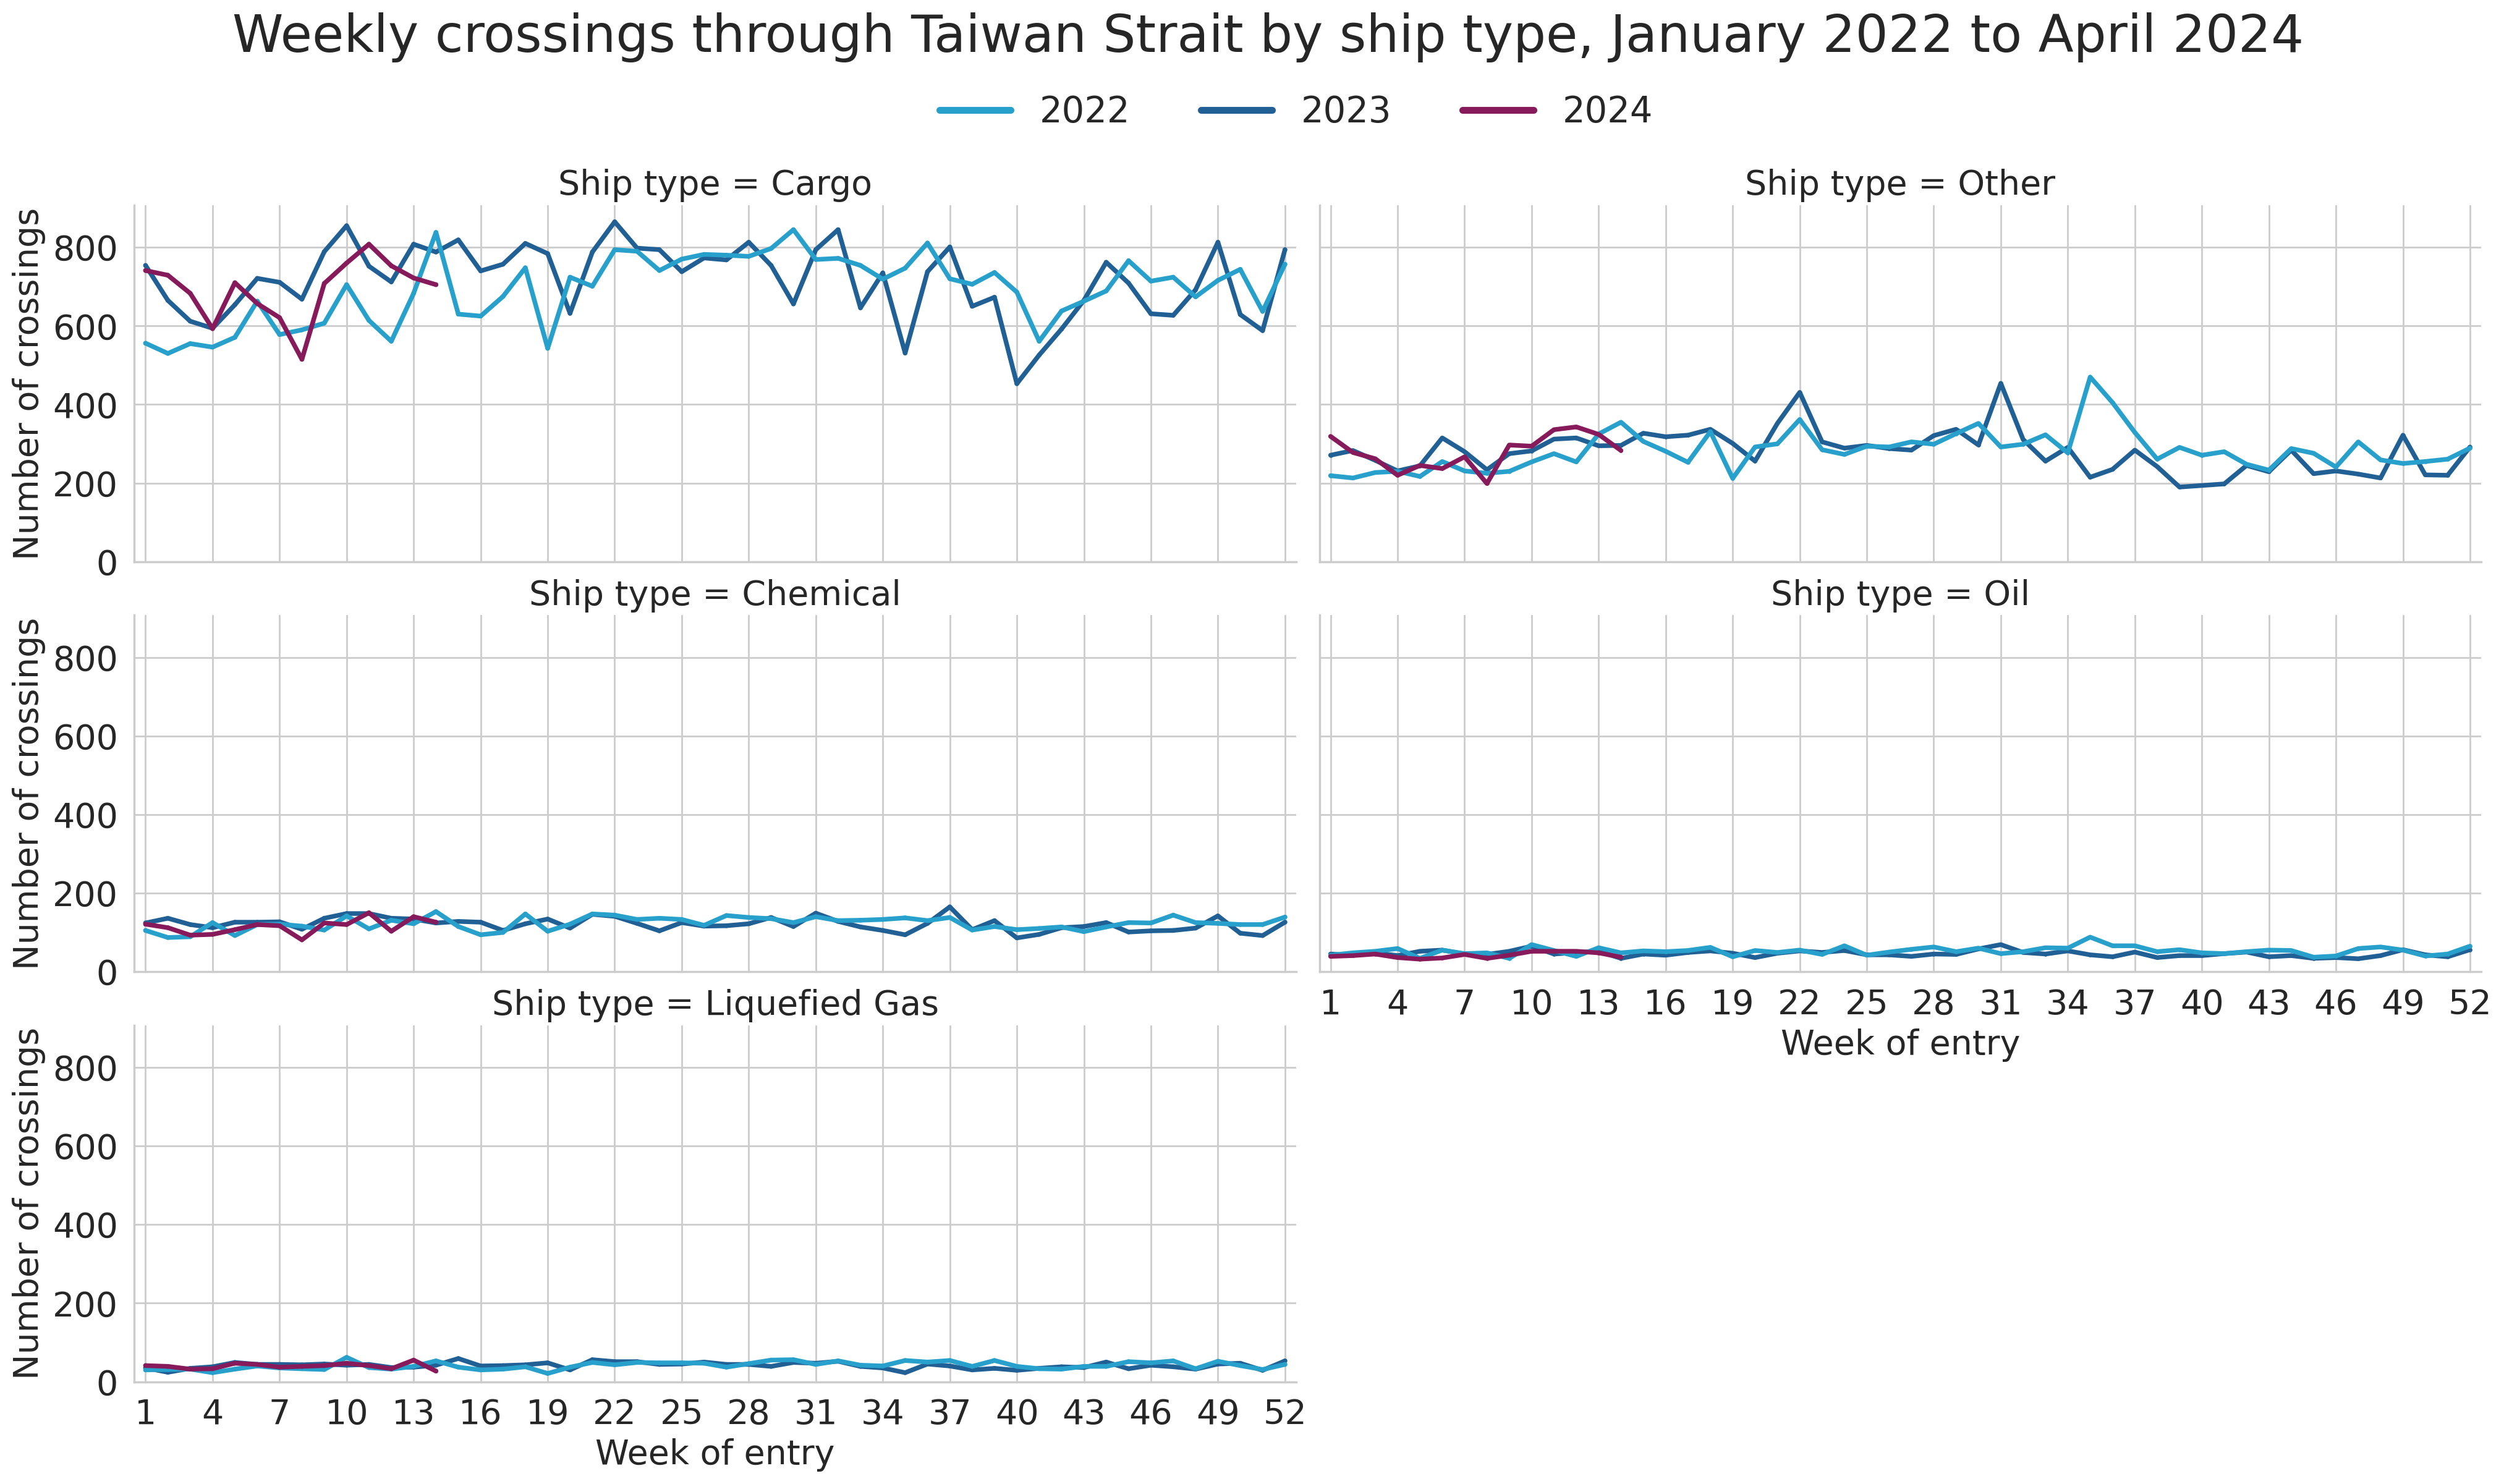
Figure 11: Weekly number of crossings through the Strait of Dover by ship type
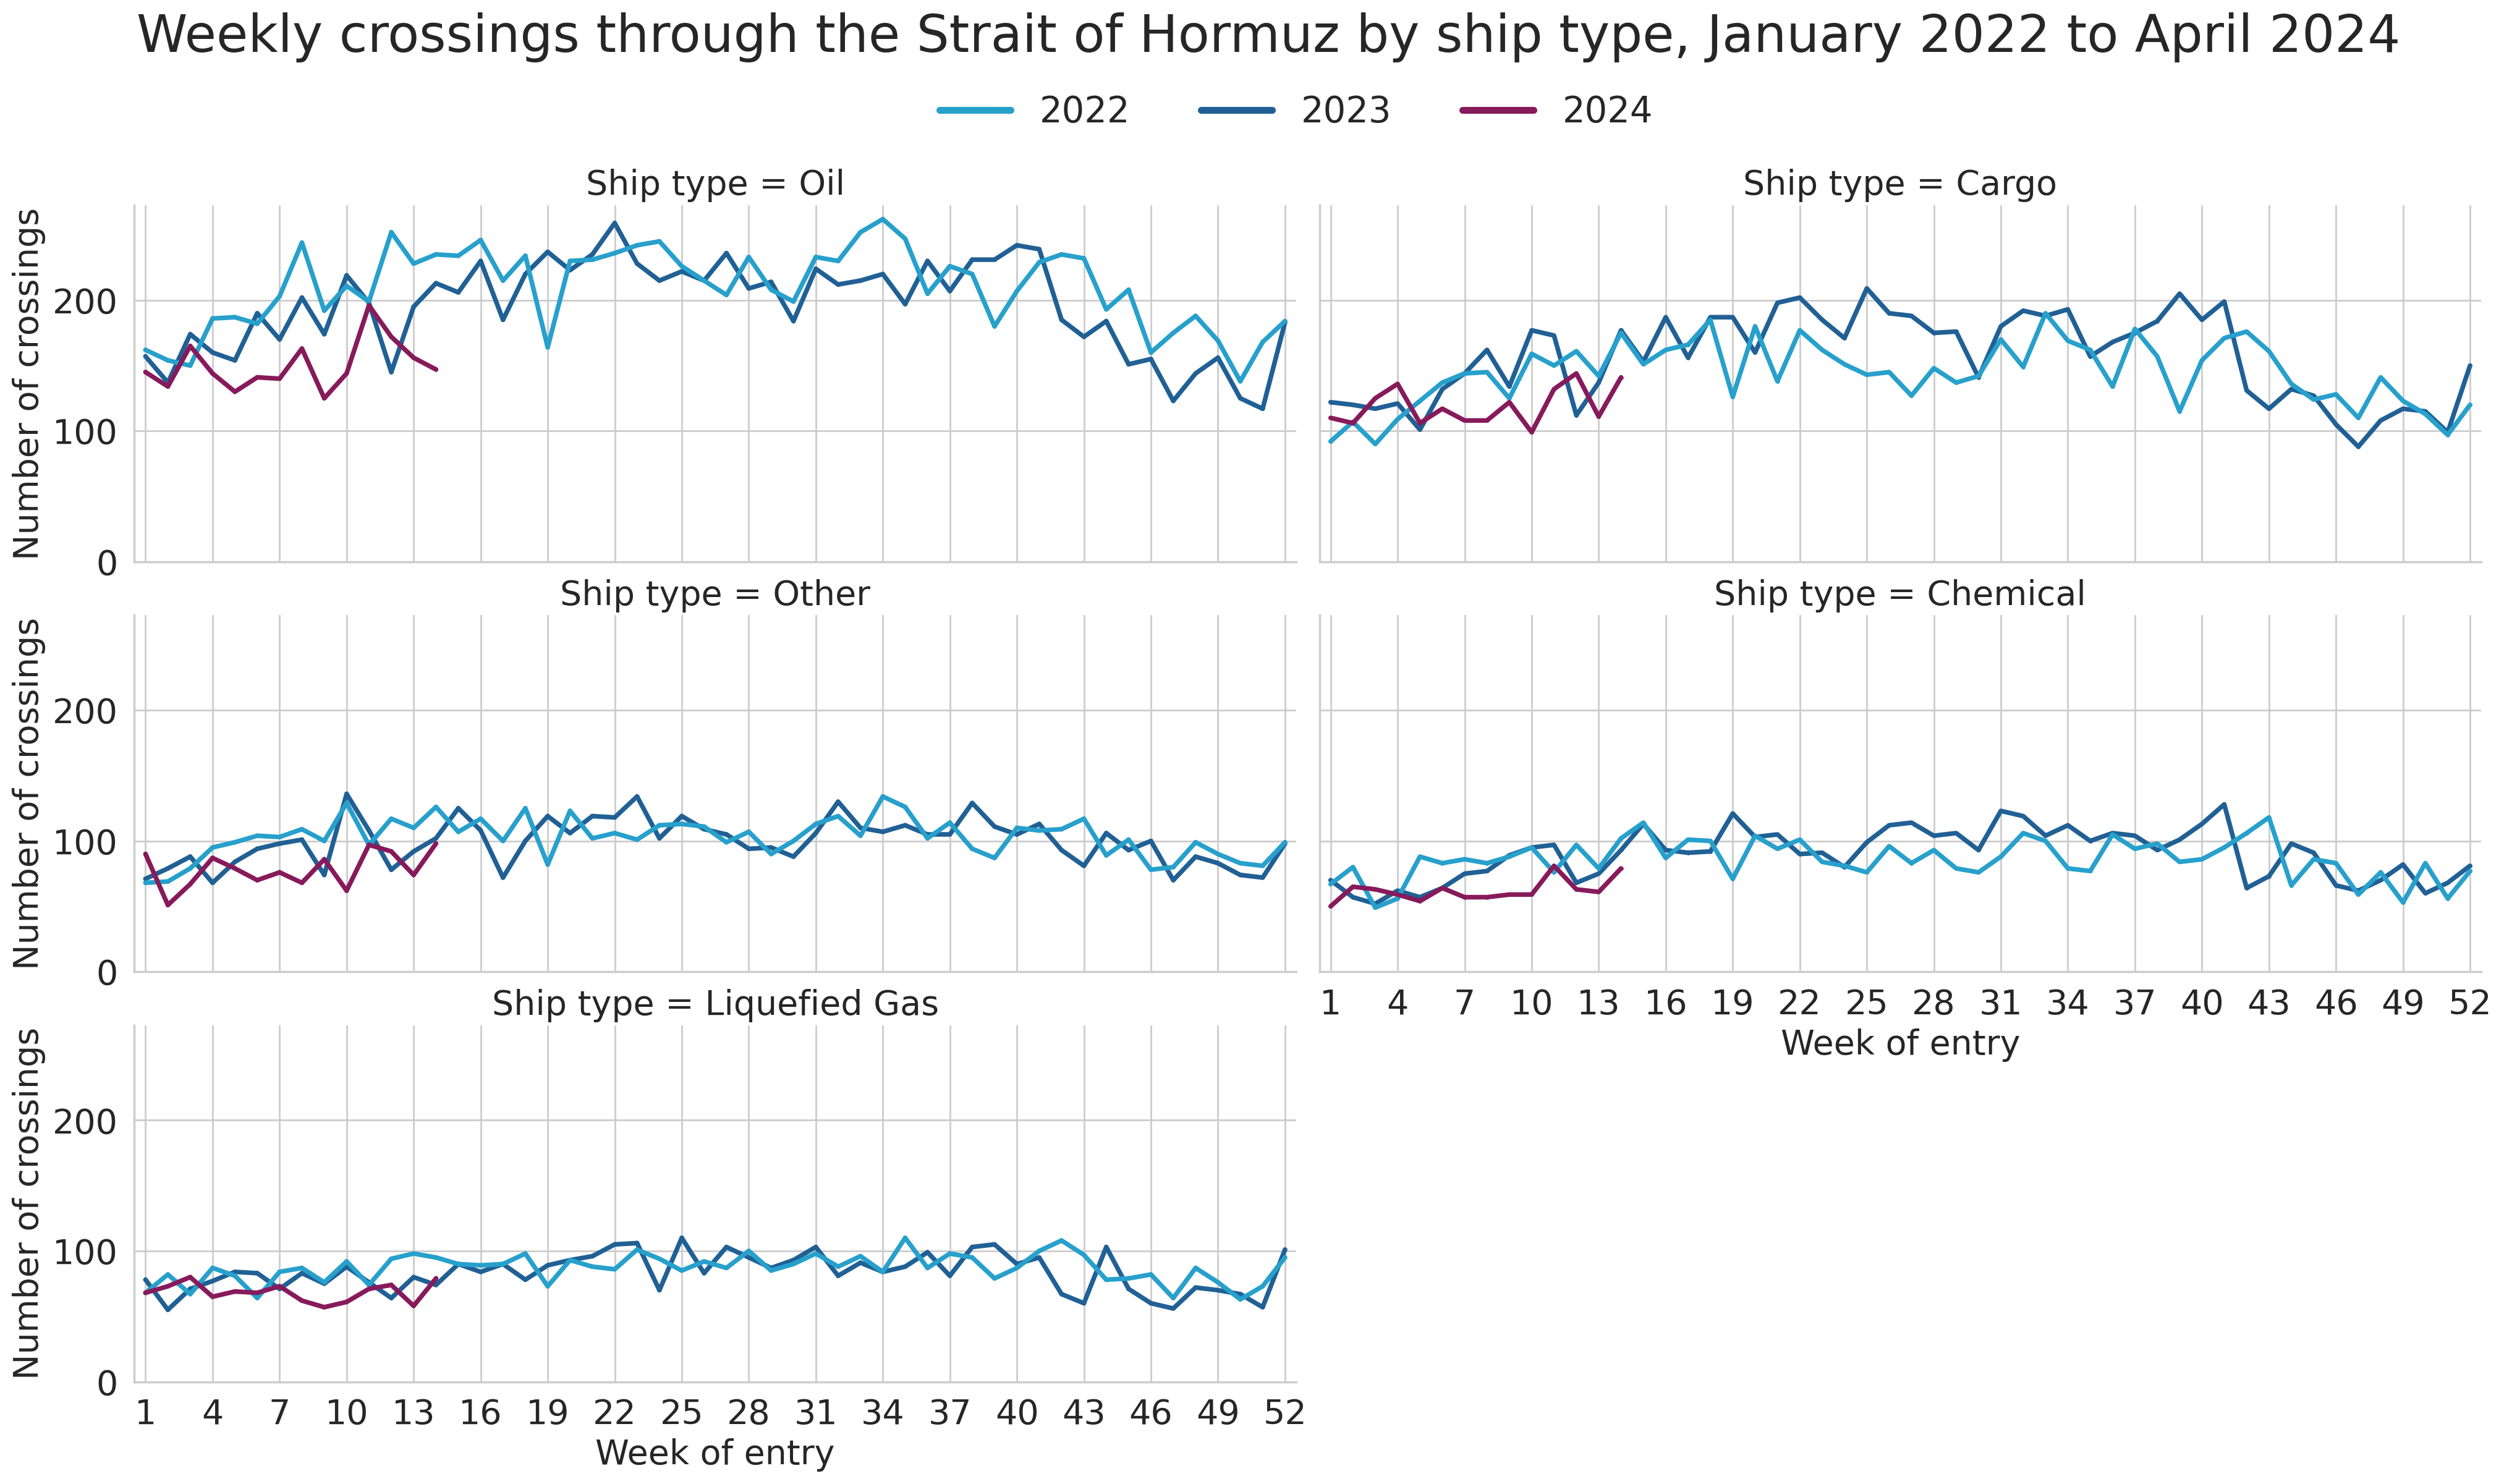
The most common type of ship passing through the Strait of Hormuz in 2022 and 2023 was oil tankers, closely followed by cargo ships. Between March and October 2023 (weeks 10 to 44), there were, on average, 214 oil tankers passing through the strait in a week (Figure 12).
Figure 12: Weekly number of crossings through the Strait of Hormuz by ship type
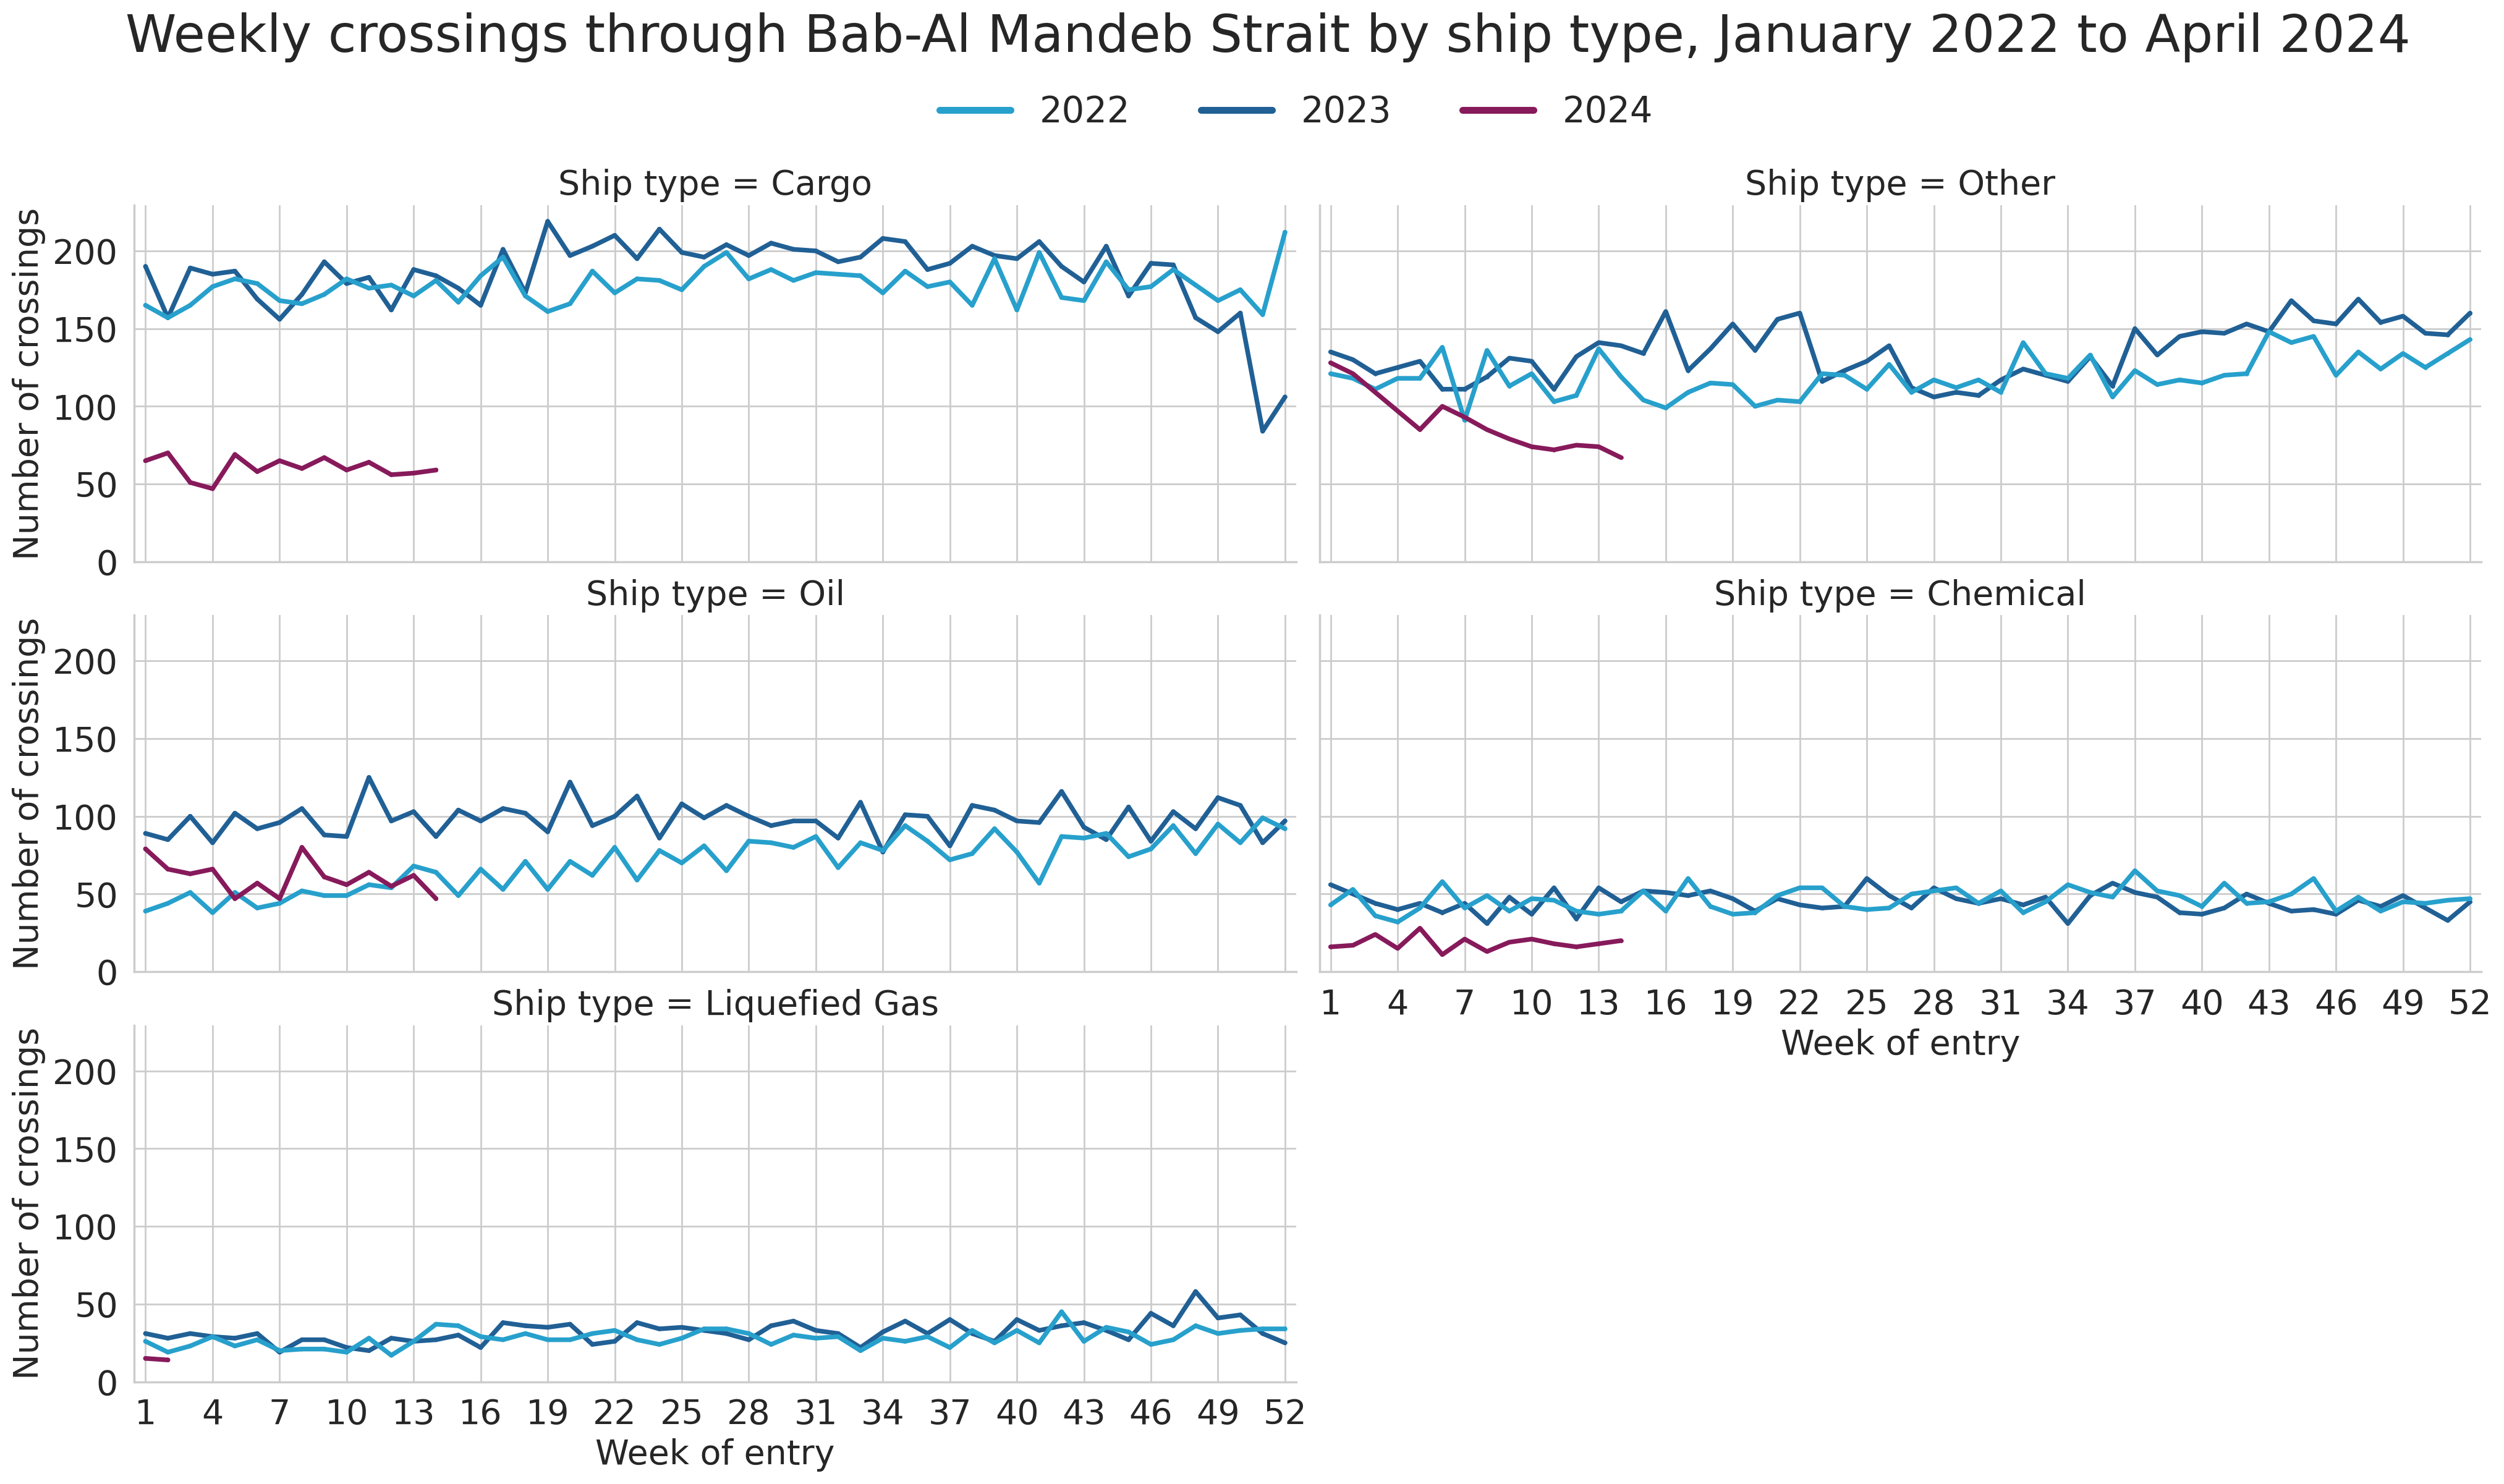
The Suez Canal and Bab-Al Mandab Strait both serve as key waterways for entering the Red Sea – an enclosed body of water often used as a passageway for accessing the Mediterranean Sea from the Indian Ocean and vice versa. Since ships must cross both straits to enter and exit the Red Sea, the trends observed in the two straits align with each other. For instance, the volume of oil tankers crossing both straits was lower in the first half of 2022, in contrast to the relatively consistent levels observed in 2023.
In the first week of 2022, oil tanker traffic through Suez Canal and Bab-Al Mandab Strait was 56 and 57% respectively lower compared to the same week in 2023, before gradually recovering by the second half of the year (Figure 13 and Figure 14). Similar to the Strait of Hormuz, the Suez Canal and Bab-Al Mandab Strait are also strategically important for the passage of oil. Oil tankers accounted for approximately a fifth of total crossings through each strait in 2023.
We can also observe a steep decline in the number of cargo and tanker ships in the last weeks of 2023 and the start of 2024 for both straits. This aligns with the widely-reported maritime disruption in the Middle East. By the first week of April 2024, weekly crossings made by cargo ships through Bab-Al Mandab was 68% lower than the level of ship traffic observed in the previous year. Similarly, the number of cargo ships crossing Suez Canal in the first week of April was 71% below the count of crossings in the same week of the previous year.
In the same week, the volume of chemical tankers at Bab-Al Mandab and the Suez Canal was 56% and 70% lower than in 2023 respectively. We are unable to share the results of the decline in crossings made by Liquefied Gas tankers, as the volume of weekly crossings were too low and therefore disclosive.
Figure 13: Weekly number of crossings through the Suez Canal by ship type
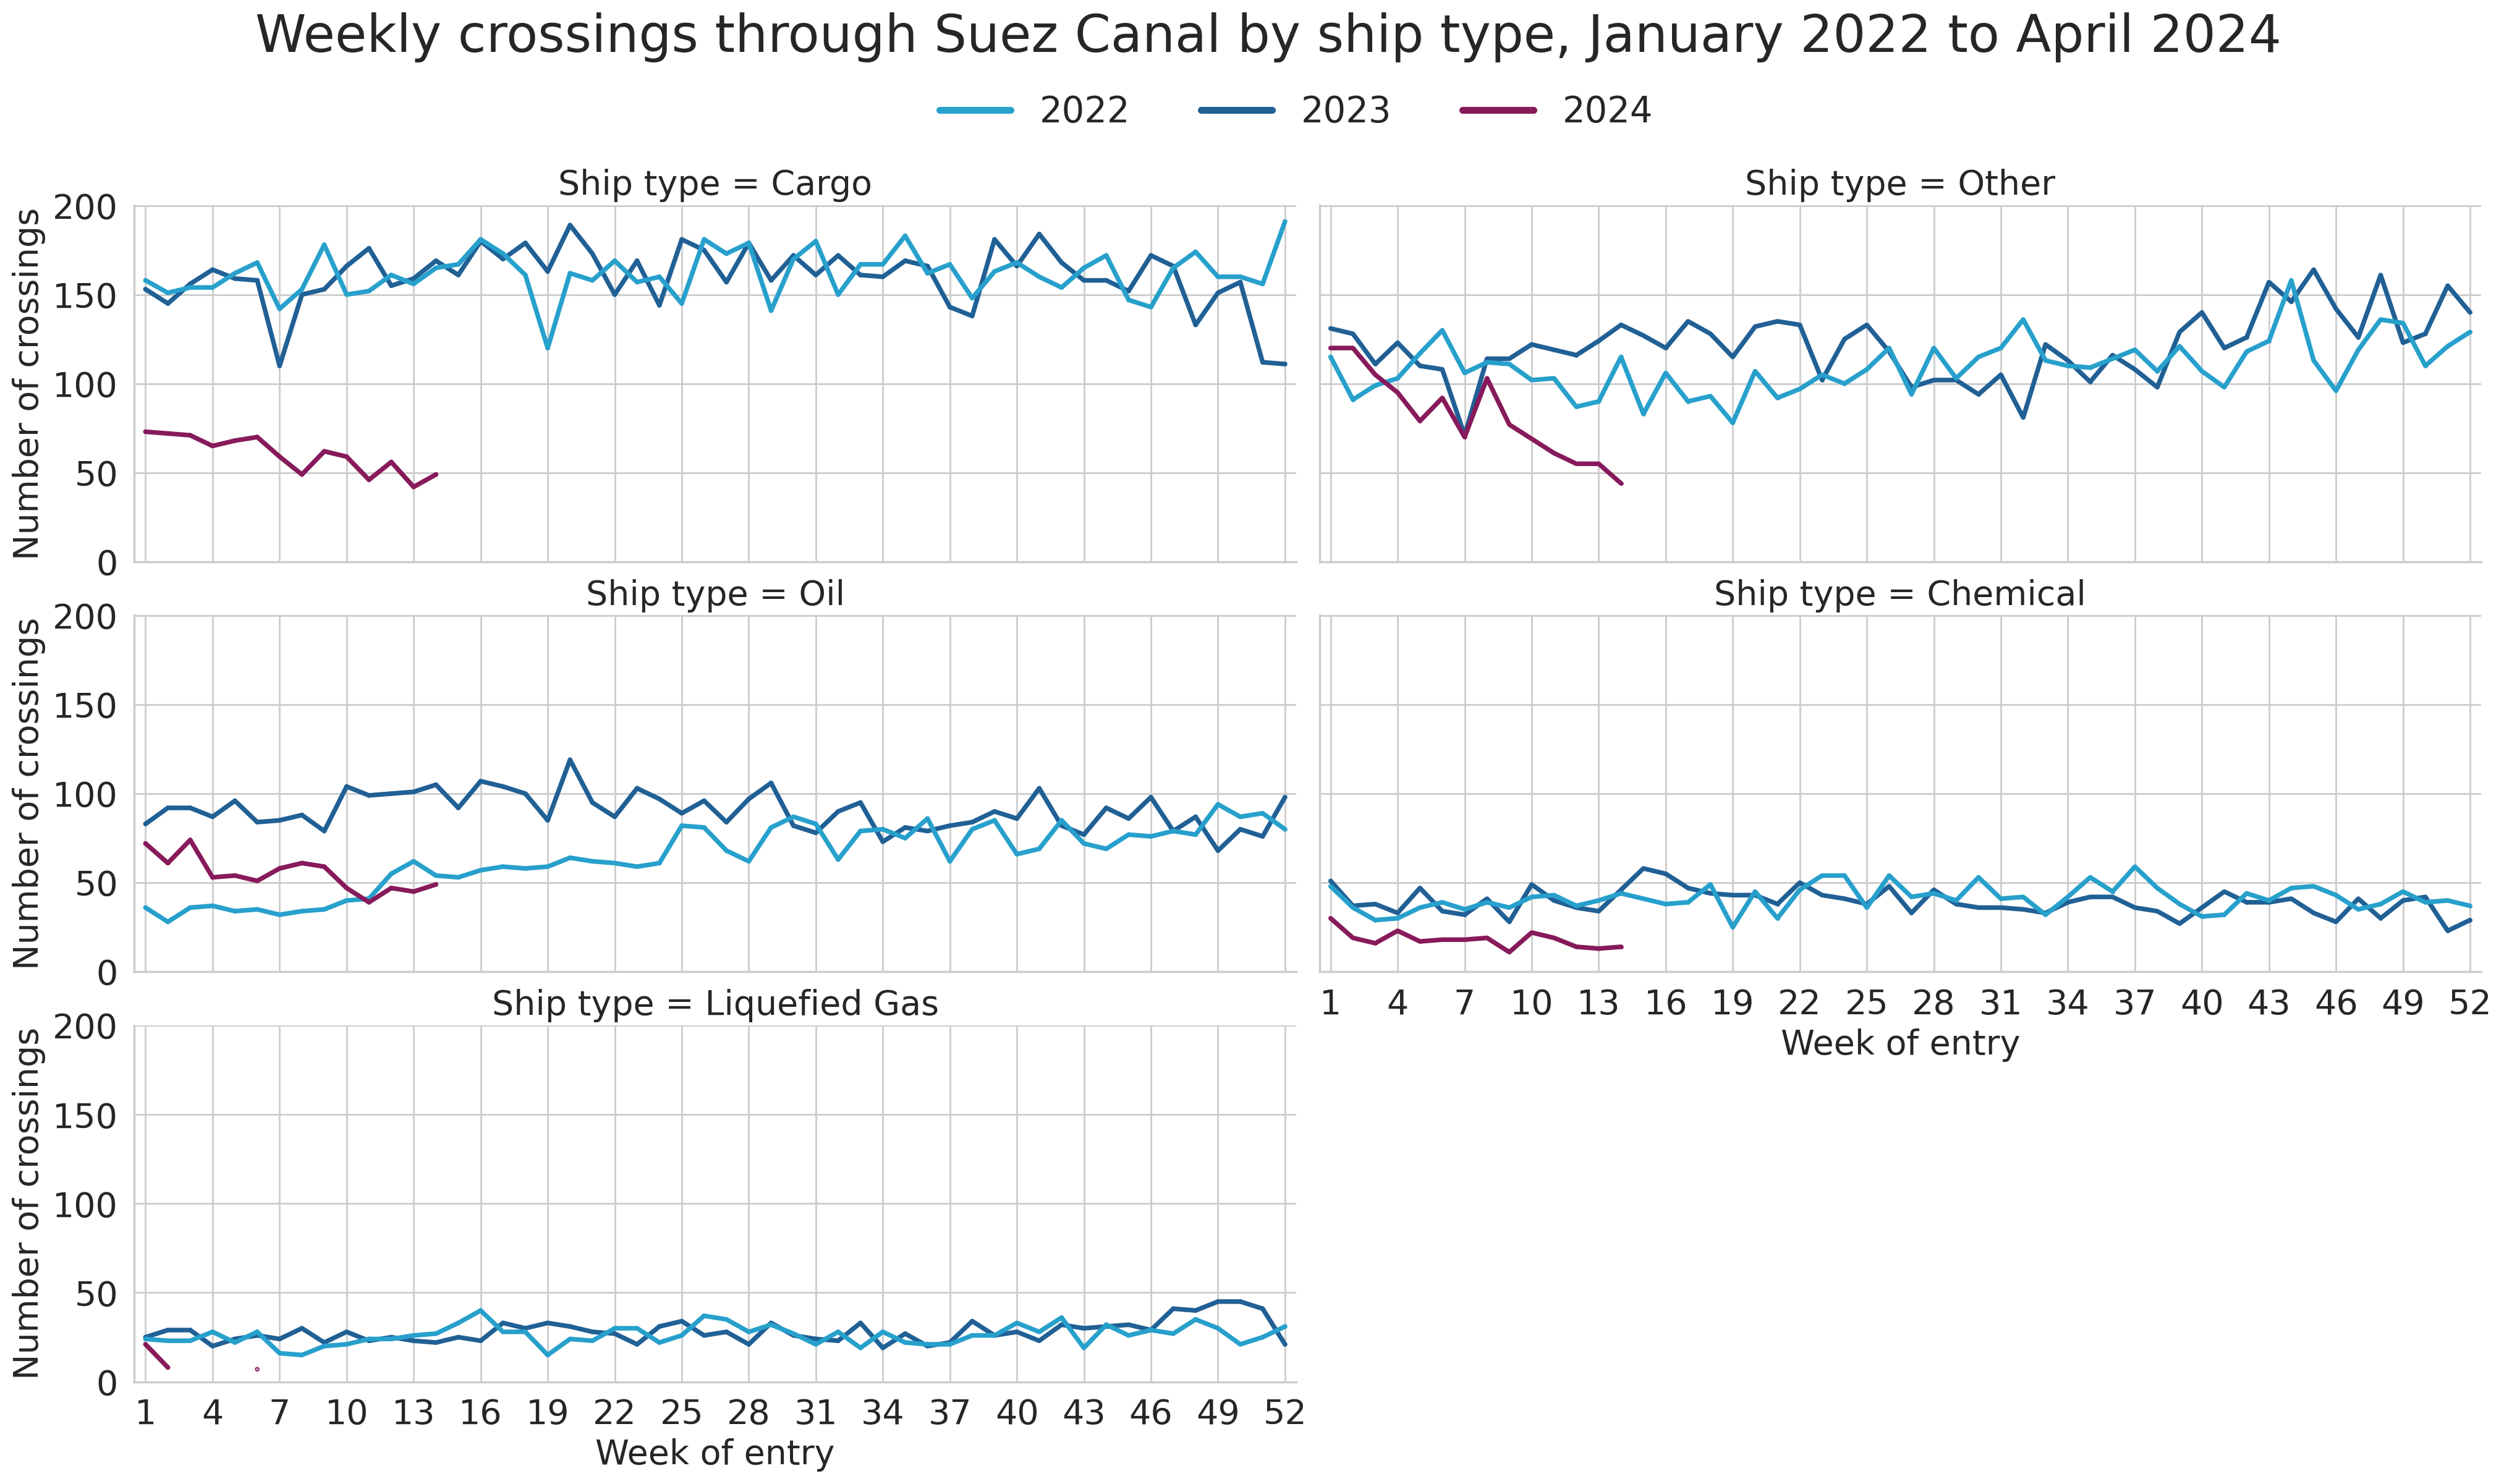
Figure 14: Weekly number of crossings through Bab-Al Mandab by ship type
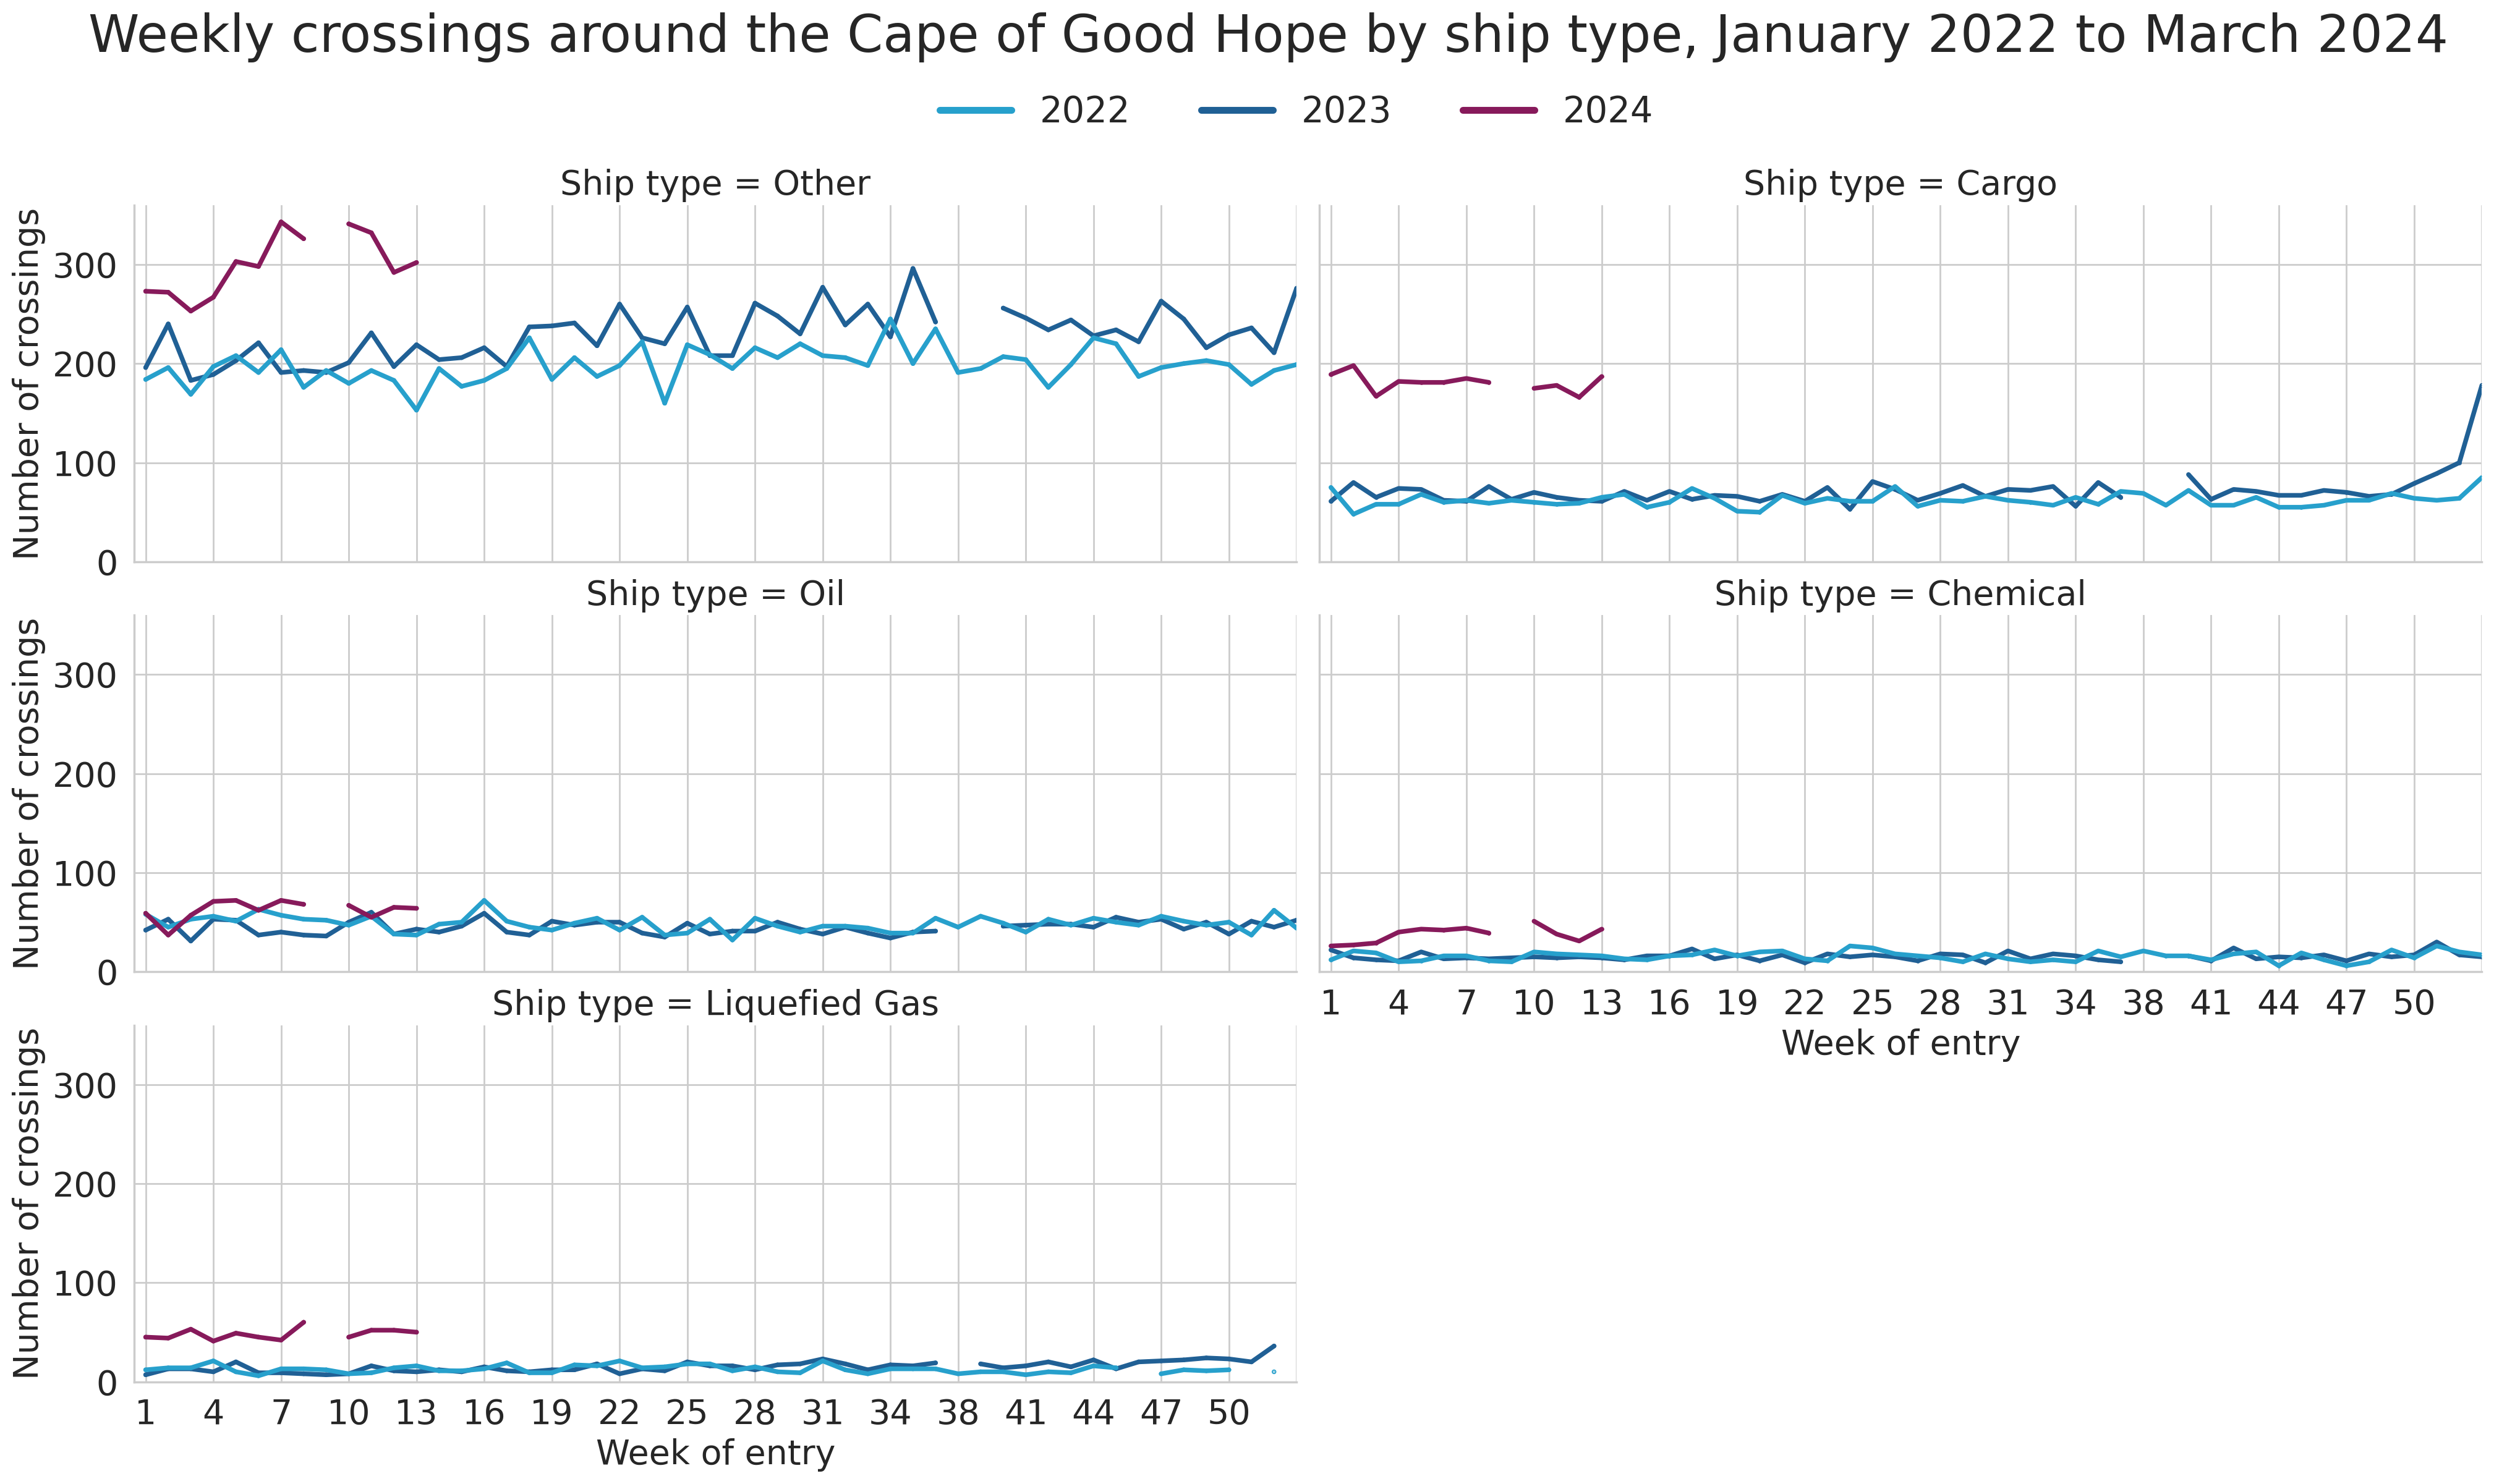
If ships are unable to cross Suez Canal and Bab-Al Mandab Strait, an alternative route is to sail around the Cape of Good Hope, although this would lengthen the ship journey. The steep declines in ship traffic at Suez Canal and Bab-Al Mandab towards the end of 2023 and start of 2024 coincide with an uptick in the number of crossings around the Cape of Good Hope.
We can observe a notable increase in ship traffic during the start of February 2024 across multiple ship types, in particular cargo ships, chemical tankers and liquefied gas tankers (Figure 15). For instance, weekly crossings made by cargo ships in the last week of March 2024 (Week 13) was triple the number of crossings in the same week of the preceding year. This type of information is valuable for the UK government in its assessment of the impact of geo-political events on trade flows.
Figure 15: Weekly number of crossings around the Cape of Good Hope by ship type
Limitations, caveats, and validation strategy
Our approach facilitates the production of novel, valuable insights into the flow of ships through global maritime passages. In presenting our methods and outputs, it is important to acknowledge certain caveats and limitations that may affect our findings:
- Data on the number of ships in the last month may not have fully stabilised and could change as we receive more instalments of data over time. However, we expect the changes to be marginal.
- We do not have complete information on the registered flag and ship type of all ships. Only trading ships have been included in this analysis and approximately 5% of ships are missing information on ship type. Furthermore, ship type information has been added using a single ships’ register, which was last updated on 30th October 2023. This ships’ register may not assign correct information for all ships throughout the year.
- AIS data can be switched off by the ship’s crew, rendering the ship untraceable.
- Due to the presence of noise or poor-quality AIS data, some passage crossings may be incorrectly identified or missing. While our algorithm reduces a portion of the noise, some may still persist.
- There is a gap in AIS data on 12th May 2022 and 14th February 2023, which will marginally impact the average number of ships in those weeks.
- Data corresponding to values associated with 5 or fewer ships have been suppressed to avoid disclosure.
To enhance the robustness of our statistics, we implemented a rigorous outputs validation strategy, consisting of the following steps:
- Comparison of our algorithm’s outputs for Suez Canal in 2019 with those recorded by the Suez Canal Authority, which showed that the trends align and that our algorithm demonstrates good accuracy. More recent trends are not available from the Suez Canal Authority, thus precluding comparisons with recent years.
- Validation at code level, using techniques such as unit testing and code peer review.
- Validation at data point level, to ensure that the crossings detected by our method are genuine and reduce misdetections.
Next steps
In our forthcoming publications, our primary focus will be on extending the scope of our analysis by linking AIS with shipping instructions data, which will enable us to monitor the journey of containerised goods through critical maritime passages in near real-time.
This will enable a thorough understanding of not just ship movements, but also the cargo they transport, enhancing our comprehension of disruptions and changes in trends within specific sectors and commodities. Moreover, this approach would provide further evidence regarding the route that certain products take, as opposed to relying on proxies derived from the predominant trade routes connecting countries.
Our analysis will be constrained by the data coverage of the Shipping instructions. As we have noted in our previous blog, this dataset covers around half of all container imports and exports to and from the UK and only gives access to the first six digits of the Harmonised System code for products. Additionally, we intend to broaden our analysis to include additional maritime passages of geopolitical, economic and trade importance such as the Strait of Gibraltar and the Panama Canal.