Automating consultation analysis
According to one estimate, globally we generate around 2.5 quintillions (number of zeros = 18) bytes of data every day! The majority of worldwide generated data is projected to be unstructured and text data forms a significant part of it. It is challenging, time consuming or even impossible to manually analyse this unorganised data and generate insights from it.
The use of data science and machine learning techniques, specifically Natural Language Processing (NLP) allows us to automate most of the processes involved in analysing large volumes of text data to generate actionable insights, saving both time and resources.
Early in 2019, the National Assembly’s Children, Young People and Education (CYPE) Committee approached us to explore data science techniques to carry out an independent analysis of 650 responses to a consultation gathering opinions on a recent Welsh Government Bill – the “Children (Abolition of Defence of Reasonable Punishment) (Wales)” Bill (“the Bill”). More information about the consultation and background of the Bill are available from the National Assembly for Wales.
Although it is a relatively small number compared with 2.5 quintillion bytes, it is enough to be challenging to fully analyse manually.
The number of unstructured text responses received as part of this consultation was relatively modest for many natural language processing techniques, including topic modelling, to be effective. We focussed on uncovering the key themes and phrases along with their context in the responses. Uncovering salient phrases was an important step in gaining insights into the responses received under this consultation. This report describes the methods and results of our analysis and is complimentary to the principal findings of the Committee’s independent analysis.
We used two techniques to extract key phrases from the responses to the consultation, namely word collocation, and term frequency–inverse document frequency (tf-idf) techniques. In addition to uncovering salient phrases in the responses to the consultation, we were also able to extract the context around the salient phrases. Understanding the context of key phrases was particularly important for those phrases which appeared in the responses of those who supported the Bill and also those who opposed it. Using the data science techniques laid out in detail in this report, we were able to independently analyse the consultation responses to provide a clear overview of important themes and trends to help inform the Committee in their evidence-based decision-making.
1. Background
‘For sale: baby shoes, never worn’ is arguably one of the most famous – and shortest – of stories widely attributed to American novelist Ernest Hemingway. The author’s clever choice of words goes on to show the strength of data-driven story-telling. Interestingly, using only three data points allows us to build our very own assessment of the context around the story. Something tragic might have happened to the baby, or, could it just be a simple case of shopping misjudgement? Of course, one has to look for extra information to complement one’s findings to be certain about the mystery around the shoes on sale. However, the important point is that data doesn’t always have to be big to draw meaningful conclusions from. The quality of collected data and the choice of approach to the analysis give us the ability to draw insights from it.
Data science is broadly about building stories from data, extracting meaningful information and conveying the findings effectively through appropriate means. As our lives become increasingly digital, our online footprints are expanding at a tremendous rate and they are monitored, collected and analysed in almost real time. Today, almost all aspects of our digital lives are monitored; Google searches, Facebook likes, online tweets, shopping habits to name a few. The daily volumes of data generated by us is unprecedented and the distinction between data science and this Big Data is becoming increasingly opaque.
Undoubtedly, data science can leverage the power of big data to make invaluable contributions, including cost reduction and improved decision making. However, the initial assumption that bigger the data, the more powerful its findings has been challenged with an ever-increasing view that bigger data doesn’t always translate into better decisions. One of the problems is that if all the data has the same bias, simply accumulating more of such data to train machine learning models will hardly be of much use. Instead, a relatively smaller dataset that is far more balanced and rich(er) in its contents and can potentially yield better results and insights.
In the spirit of experimenting with applying data science techniques on not-so-big data sources, we used natural language processing techniques to analyse free text responses submitted in written evidence to a National Assembly for Wales Committee (Children, Young People and Education Committee) in its scrutiny of the general principles of a recently introduced Welsh Government Bill. We specifically focussed on word collocation, and term frequency–inverse document frequency (tf-idf) techniques that can be applied on datasets with modest size and produce outputs with good interpretability. In addition, we were also able to extract the context around the key phrases appearing in responses to the consultation. The objective of our work was to analyse the online consultation responses using data science techniques, with a view to uncovering patterns and salient themes expressed in the opinions and which are difficult to uncover through manual analysis.
On 25th March 2019, the Welsh Government introduced the “Children (Abolition of Defence of Reasonable Punishment) (Wales)” Bill. This Bill proposes to abolish the common law defence of reasonable punishment for any parent (or any adult acting in a parental capacity) accused of assault. The Business Committee had remitted the Bill to the Children, Young People and Education Committee. The Committee held a public consultation between 2 April 2019 to Tuesday, 14 May 2019 to gather views on the general principles of the Bill. The committee approached the Data Science Campus at the Office for National Statistics to independently analyse the online consultation responses, to supplement its own analysis.
It should be pointed out that the Children, Young People and Education Committee independently analysed all the consultation responses in addition to our own automated analysis. The analysis conducted by the Committee should be considered the primary analysis of the online consultation responses and a detailed report of their findings is available from the National Assembly for Wales. The work carried out by the ONS Data Science campus is complementary to the findings of the Committee and to assist the Committee in their analysis by identifying the key issues raised by the respondents.
2. Data collection
Online consultations are becoming increasingly popular and a cost-effective way to use technology to understand public opinion on societal, political, national and international issues. Responses to the present consultation were received online.
Over the course of the six-week period, the consultation received 650 online responses. As part of the consultation, the respondents were able to respond in one of three different capacities (described in this report as “user type”):
- individual responding in a personal capacity (“Individual”)
- individual responding in a professional capacity (“Professional”)
- organisation (“Organisation”).
The dataset obtained as part of this consultation was rich in content, encapsulating a diverse set of opinions and views on the Bill. Respondents to the consultation were asked seven questions in connection with the Bill. These were based on the Committee’s terms of reference for the Bill’s scrutiny. The questions included:
- ‘Please outline your reasons for your support or otherwise for the Bill’
- ‘Do you think there is a need for legislation to deliver’
- ‘Do you have any comments about any potential barriers’
- ‘Do you think the Bill takes account of these potential barriers’
- ‘Do you think there are any unintended consequences’
- ‘Financial Implications of the Bill’
- ‘Other Comments’
We found that ‘Please outline your reasons for your support or otherwise for the Bill’ was answered by maximum number of respondents while ‘Do you have any comments about any potential barriers’ was answered by the lowest number of respondents. The responses to the above seven questions were recorded as free text responses and formed the basis of our analysis to uncover salient themes and issues present in the responses to the consultation.
Additionally, each respondent was required to identify their user type category (Individual, Professional, Organisation) and a baseline question to record their support or otherwise for the Bill was also provided. The response to this question could be one of the following four options: ‘No’, ‘Yes’, ‘Partly’, ‘Don’t have a view’. While analysing the responses, we found that the response type for this question was extremely useful by allowing us to create a labelled dataset by putting the responses in the respective category based on the response in support or otherwise for the Bill.
3. Data cleaning
The responses were provided to the ONS Data Science Campus in a Comma Separated Values (csv) file format. Since the dataset provided to us contained sensitive personal information, the dataset was anonymised before it was analysed (removing names, email addresses and actual postcodes replaced with location inside or outside of Welsh regions). Thereafter, the anonymised data was stored and handled according to the appropriate data security standards. This included, storing data onto a secured network drive with data access restricted to the project team members only and no remote working was allowed.
One of the very first steps in most data science pipelines is data cleaning. We cleaned the dataset by removing those columns and rows of which had missing values. The resulting shape of the dataset was 650 X 32. In other words, the dataset has 650 responses and each specific response had 32 different attributes. However, we focussed only on the attributes which were relevant to our analysis, including anonymised location of the respondents (this information was only available for Individual respondents), user type category, type of response in support (or otherwise) for the Bill and responses to the seven questions laid out in the data collection section.
4. Data analysis: data exploration
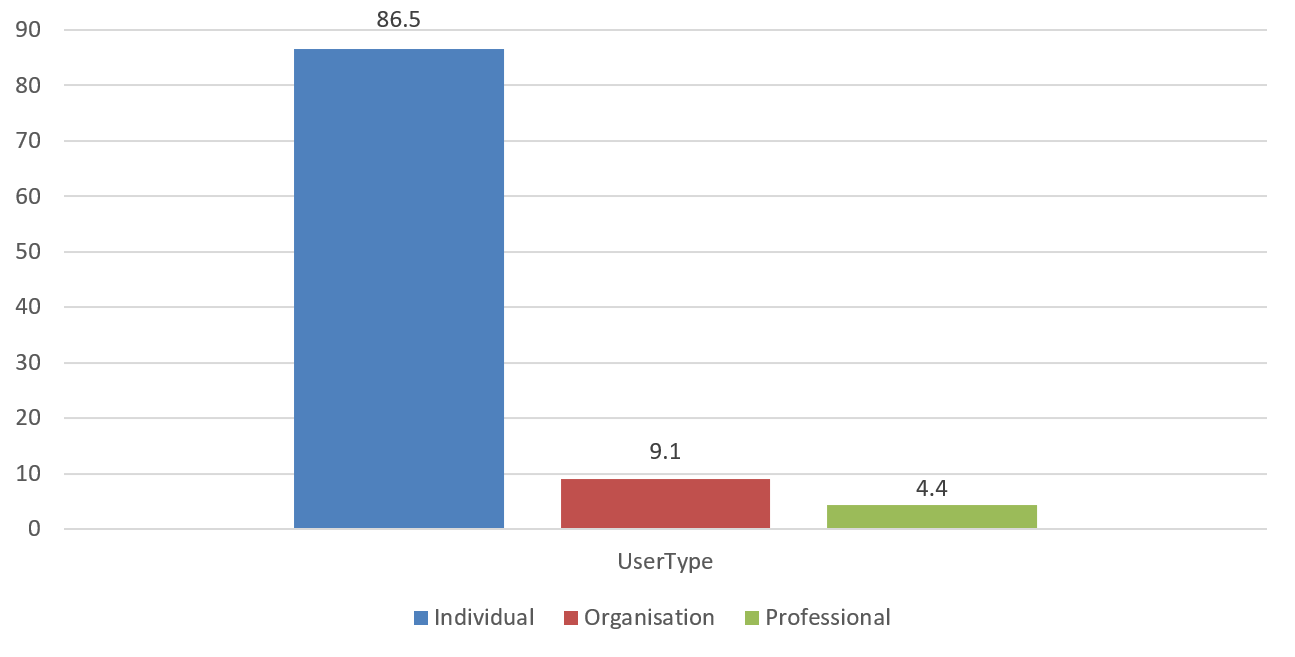
As outlined in the data collection section, the online consultation received 650 responses. As a first step in the analysis and to find the number of responses received under different user type categories, we grouped the responses according to the category of the respondents. We found that most of the responses were received from individuals, accounting for more than four out of five of the total number of responses (562). Responses from organisations were the second highest (59) followed by responses from professionals (29). Organisations typically represent opinions of more than one person, but in the present analysis each specific response from an organisation was counted as one instance and no additional weights were applied on the responses from organisations. Responses received under the three different categories is shown in Figure 1.
Figure 1: Responses to the consultation received under different user type categories (%)
As a next step, to find the total number of responses in support or otherwise for the Bill, we grouped the responses according to the type of response in support or otherwise for the Bill (ignoring the user type category). We then expressed the collected responses as a percentage of the total number of the responses as shown in Figure 2. We found that out of the 650 online responses received, approximately 60% of the responses (390) were not in support for the Bill while just under 37% of the responses (238) were in support for the Bill. The rest of the respondents were either in partial agreement to the Bill or don’t have an opinion on the Bill.
Figure 2: Overall support or otherwise for the Bill by response type (%)
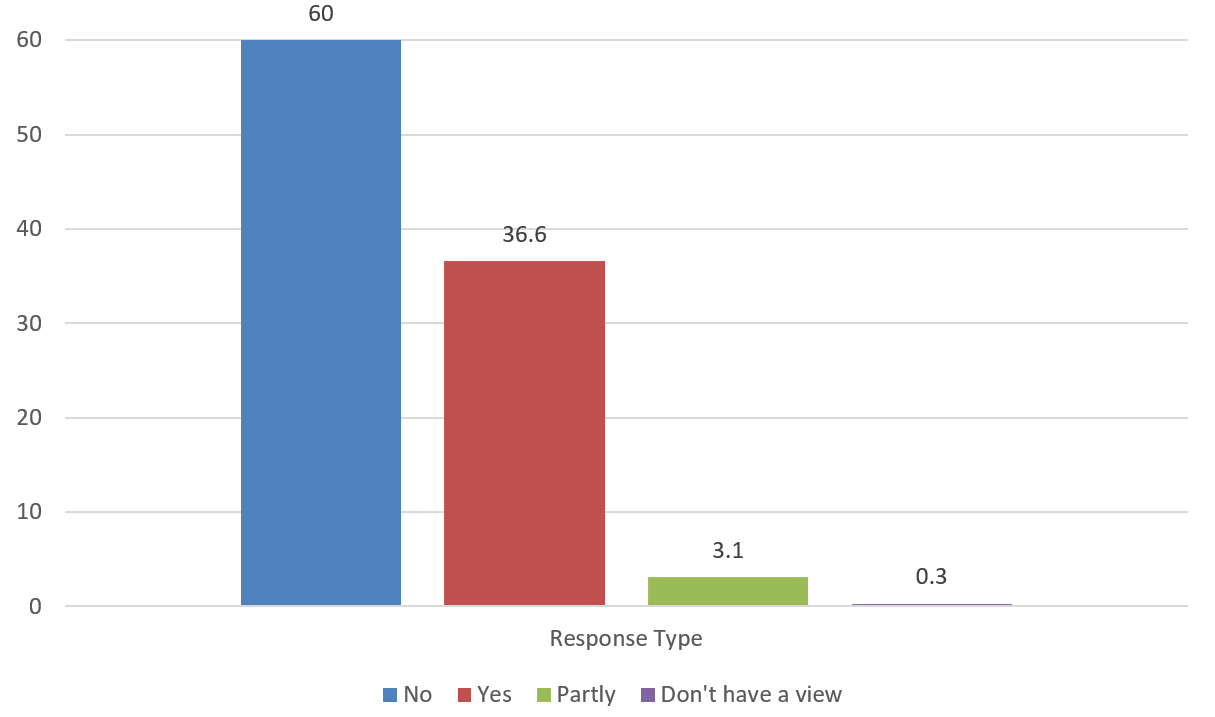
Note that organisations are likely to represent the views of more than one person.
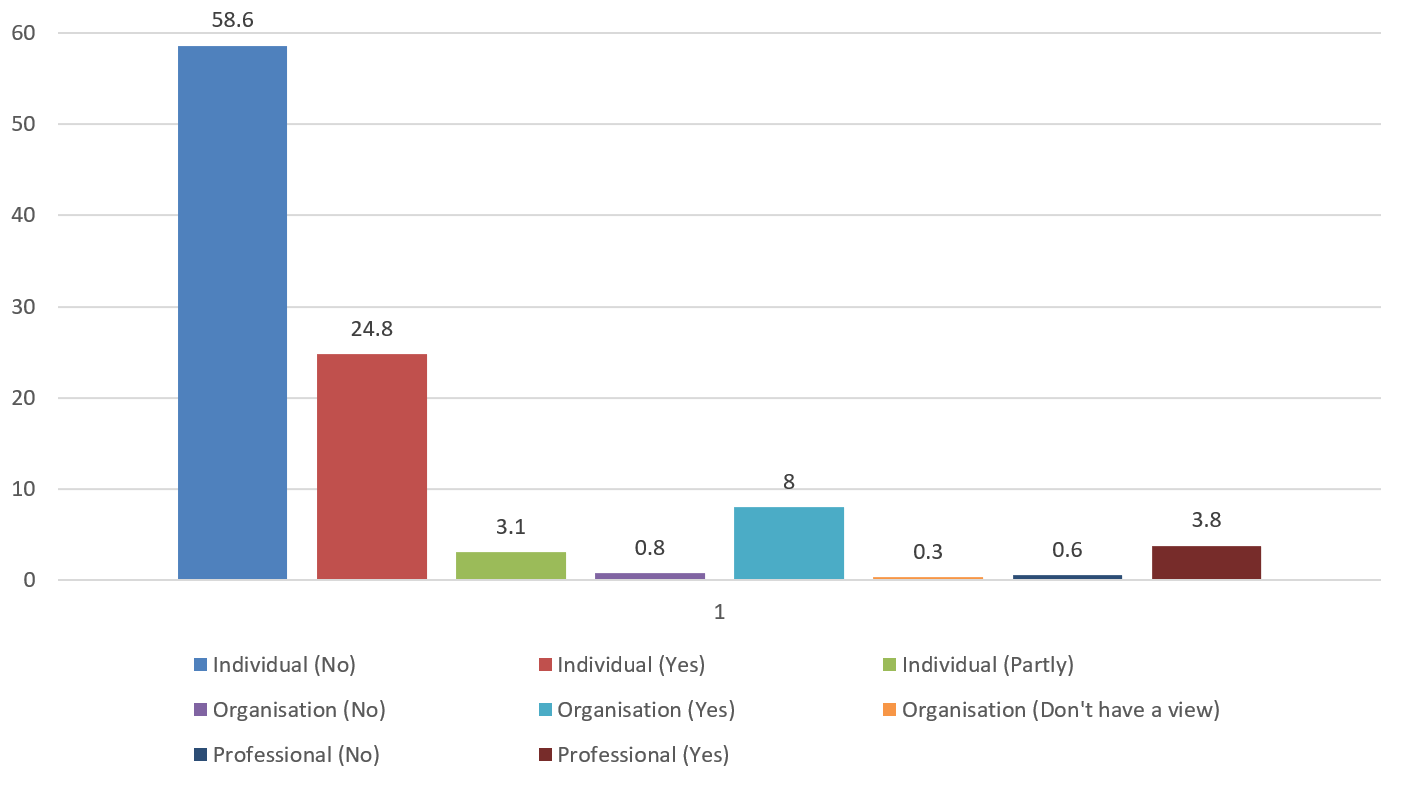
Our detailed analysis of the responses showed that there were big differences in responses from the different user types. Individuals were more likely not to support the Bill than any other option. Professionals and organisations were more likely to support the Bill. In detail, of the 650 responses we found that:
562 responses were from individuals (representing 86.5% of the overall number of responses):
- 28.6% (161 of 562) support the Bill (representing 24.8% of the overall number of responses)
- 67.8% (381 of 562) do not support the Bill (representing 58.6% of the overall number of responses)
- 3.6% (20 of 562) partly support the Bill (representing 3.1% of the overall number of responses)
59 responses were received from organisations (representing 9.1% of the overall number of responses):
- 88.1% (52 of 59) support the Bill (representing 8.0% of the overall number of responses)
- 8.5% (5 of 59) do not support the Bill (representing 0.8% of the overall number of responses)
- 3.4% (2 of 59) do not have a view on the Bill (representing 0.3% of the overall number of responses)
Note that organisations are likely to represent the views of more than one person.
29 responses were received from professionals (representing 4.4% of the overall number of responses):
- 86.2% (25 of 29) support the Bill (representing 3.8% of the overall number of responses)
- 13.8% (4 of 29) do not support the Bill (representing 0.6% of the overall number of responses)
This analysis, based on the user type and type of response in support or otherwise for the Bill is displayed in Figure 3. It is evident that most individual respondents do not support the Bill while reverse was true for both organisations and professionals. Nearly all the opposition to the Bill is from the Individual respondents.
Individuals fully supporting or opposing the Bill constitute over four out of five of the overall responses (542 out of 650 responses).
Figure 3: Responses in support or otherwise for the Bill, by response and user type (%)
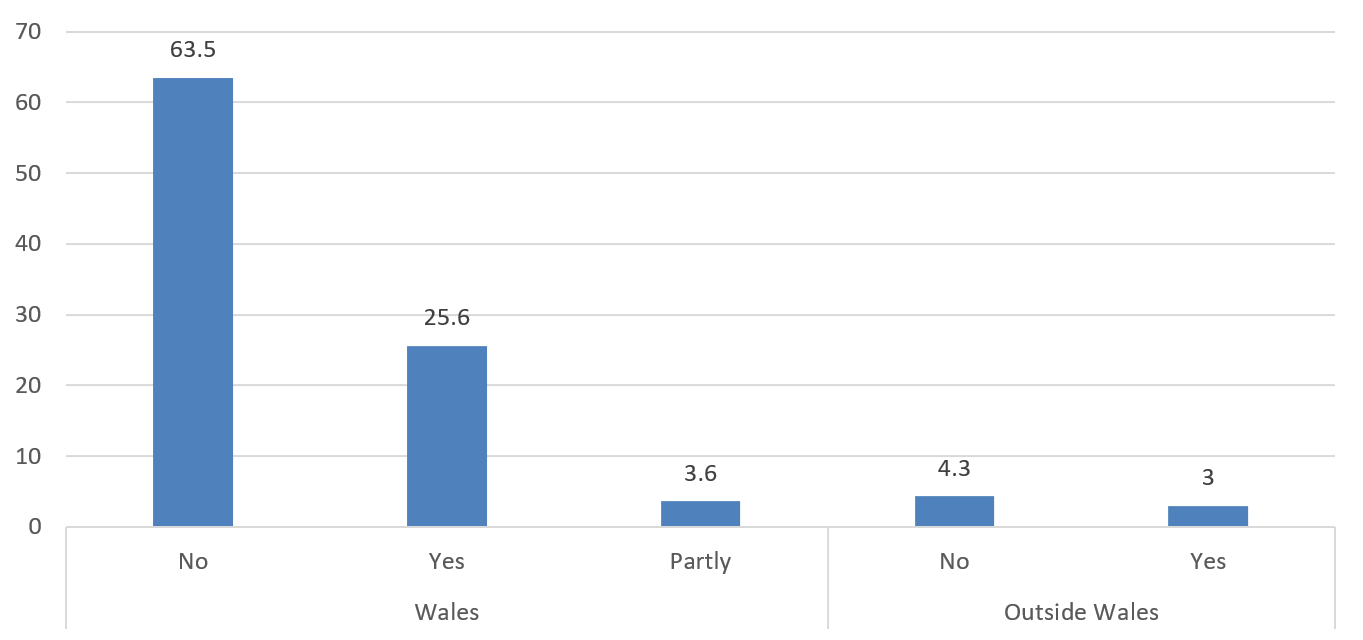
If enacted, the Bill would abolish the defence of reasonable punishment of a child taking place in Wales. We therefore also looked at the proportion of responses from Wales and outside Wales. This information was only available for Individual responses (562), and the split according to the regions is shown in Figure 4. Out of 562 individual responses, we found 92.7% (521 of 562) were received from within Wales.
Figure 4: Individual responses classified according to the region of the Individual respondents (%)
5. Data analysis: text mining
After exploring the distribution of the responses in support or otherwise for the Bill, in this section we will now focus on methods to extract the key themes that emerged in the responses.
An important task in text mining and natural language processing is to quantify what a document is about. A possible starting point to achieve this is to look at the words that make up the document. One idea would then be to pick out important words from a text document. One measure of how important a word may be is its term frequency (tf), that is, how frequently a word appears in a document. There are words in a document, however, that occur many times but may not be important; words like “a”, “the”, “is”, for example. One might remove all these so-called stop words from the document before performing any analysis, but this might not be the best solution to adjust for weights of the important words especially if one has different number of documents to compare each with varying number of words.
Even with using an improved strategy for assigning proper weights to important words in a document, one can stumble across another problem relating to the context. As we know there is a huge difference between phrases such as “support the Bill” and “don’t support the Bill”. Therefore, getting weights of one-words (unigrams) alone will not be enough, one may then instead get weights of n-adjacent words (ngrams) at a time to better understand the context.
We therefore used two improved techniques which overcome the above shortcoming to extract key phrases from the responses to the consultation, namely we made use of word collocation and term frequency–inverse document frequency (tf-idf) techniques. In addition to uncovering salient phrases in the responses to the consultation, we were also able to extract the context around the salient phrases. Understanding the context of key phrases was particularly important for those phrases which appeared in the responses of those who supported the Bill and also those who opposed it. The technical details of the two techniques used to analyse the consultation responses is available in a Python Jupyter notebook.
We started the text mining analysis by first splitting the responses under two main categories; full support or opposition to the Bill (ignoring the user type and region categories). Splitting the responses under these two categories allowed us to collate a sizeable number of free text responses to all the seven questions to extract most frequent (co-occurring) and important phrases present in the responses to the Bill.
Most frequent co-occurring phrases as detected using word collocation and most important phrases based on the tf-idf score along with their context in the respective responses were useful in identifying the key issues raised by the respondents in their support or otherwise for the Bill.
Most frequent (co-occurring) phrases
We began the text mining analysis by first extracting the most frequent phrases in the responses under the two broad categories – full support or opposition to the Bill. We first focussed on detecting word collocation, which can be understood as expressions of multiple words which commonly co-occur in a given context than its individual word parts. For example, in an article on American politics ‘Washington D.C.’ is more likely to co-occur than ‘Washington’ and ‘D.C.’ individually. Similarly, in a set of medical documents, the phrase ‘heart transplant’ is more likely to co-occur and is more meaningful than ‘heart’ or ‘transplant’ on their own.
We used Gensim to automatically detect common phrases and multi-word expressions from a stream of sentences. Gensim is an open-source library for unsupervised topic modelling and natural language processing, using modern statistical machine learning. It is possible that certain key phrases can appear in responses both in support of and opposition to the Bill. We therefore also extracted the context of frequently occurring phrases (e.g. ‘physical punishment’ as a phrase is present in both categories: responses in opposition to the Bill and responses in support for the Bill).
While detecting co-occurring phrases we can make use of two parameters, “min_count” and “threshold”, to ensure only meaningful key phrases are picked up by our Gensim model. The parameter min_count ignores all phrases with total collected count lower than this and threshold represents a threshold for forming the phrases (higher means fewer phrases). We used min_count=10 and threshold=5 in detecting most frequent (co-occurring) phrases. After experimenting with different values of min_count and threshold, we found the chosen combination of the parameters resulted in good quality of phrases based on their interpretability.
We first collated all the responses to all the questions which were in opposition to the Bill. Using the techniques outlined above, we first extracted most frequent co-occurring phrases which are laid out in bar charts and word cloud outputs. With the larger text size in the word clouds representing terms with higher weights (co-occurrence frequencies). A bar chart and word cloud showing most frequent (co-occurring) phrases and their frequency counts when respondents replied ‘No’ in support for the Bill are shown in Figures 5a and 5b.
Figure 5a: Most frequent (co-occurring) phrases when respondents replied ‘No’ in support for the Bill
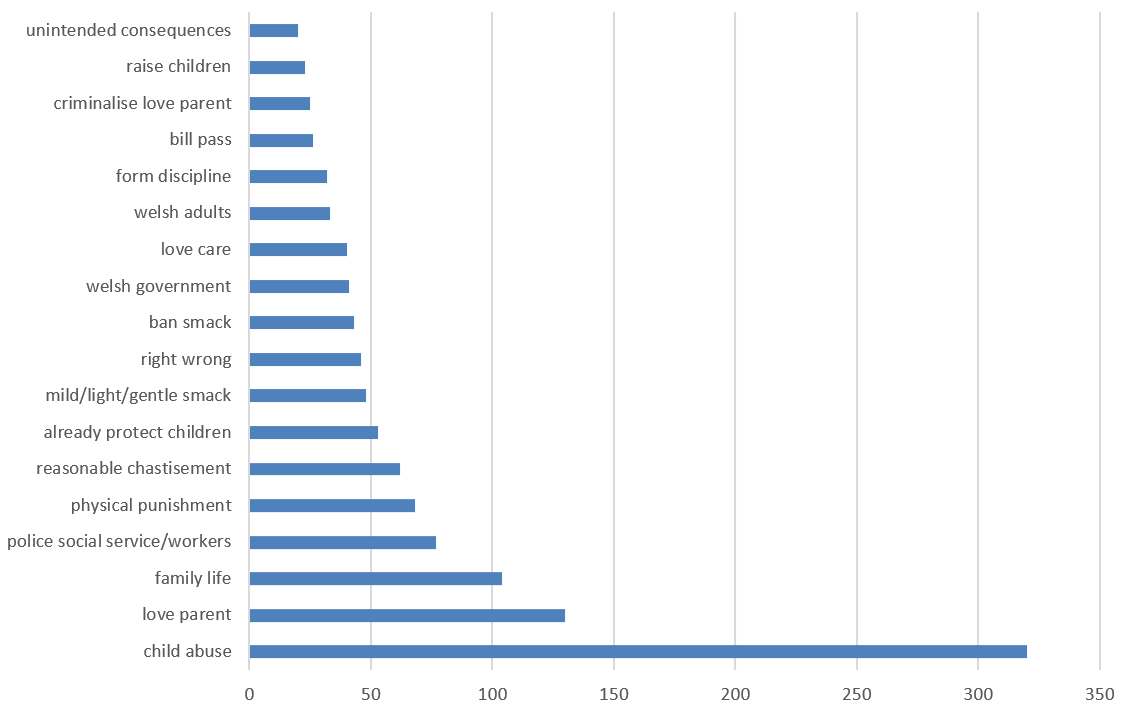
Figure 5b: Frequencies of co-occurring phrases when respondents replied ‘No’ in support for the Bill
Some of the most frequent (co-occurring) phrases used by respondents not in support of the Bill include: child abuse, love parent, family life, police social service/workers, physical punishment, reasonable chastisement, already protect children, criminalise love parent, unintended consequences. In addition to finding frequently used phrases in the responses, we can also find out the context around key phrases. This is particularly important when a similar key phrase appears in responses both supporting or opposing the Bill.
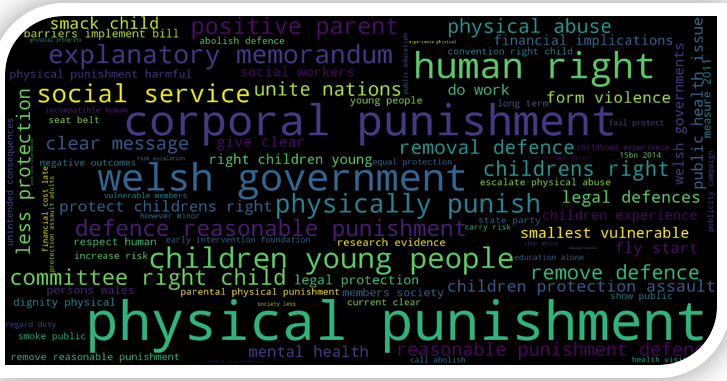
Similarly, we were able to extract most frequent (co-occurring) phrases when respondents replied ‘Yes’ in support for the Bill and the resulting phrases are shown in Figures 6a and 6b. Some of the most frequent (co-occurring) phrases used by respondents in support of the Bill include: physical punishment, corporal punishment, Welsh government, human right, children young people, positive parent, defence reasonable punishment, children’s right.
It was interesting to observe a linguistic distinction between the phrases appearing in the responses in opposition and support for the Bill. In addition to finding frequently (co-occurring) phrases in the responses, we also extracted the context around the key phrases. A few of the most frequent (co-occurring) phrases along with some of the respondents’ comments in support or otherwise for the Bill are included in our findings published alongside the Committee’s Stage 1 report .
Figure 6a: Most frequent (co-occurring) phrases when respondents replied ‘Yes’ in support for the Bill
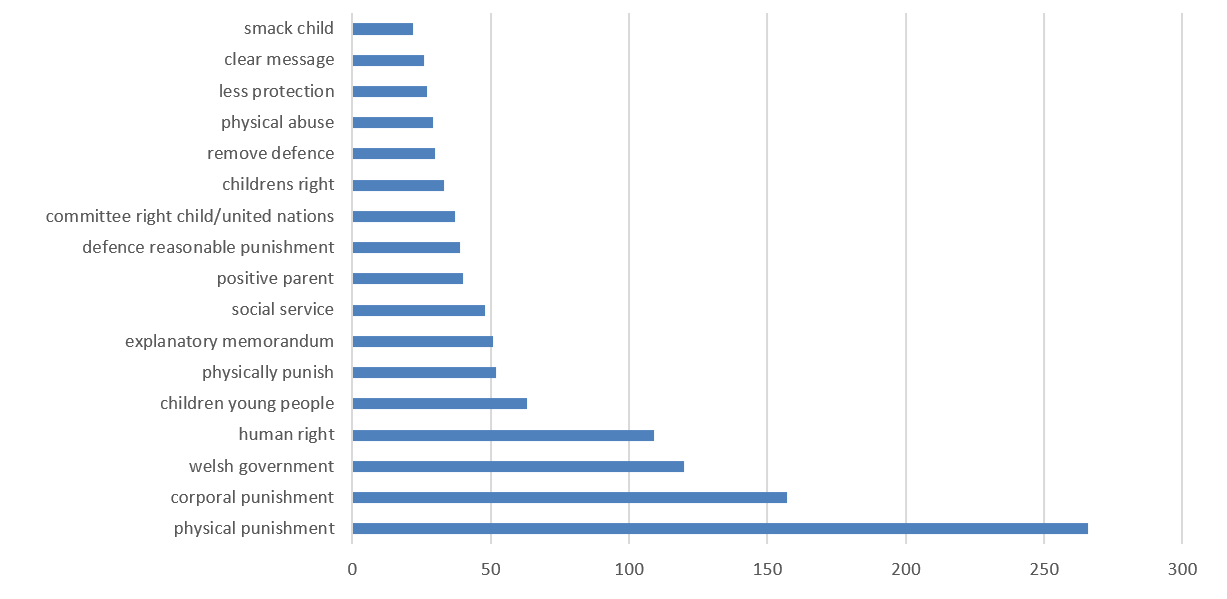
Figure 6b: Frequencies of co-occurring phrases when respondents replied ‘Yes’ in support for the Bill
Most important phrases
In a diverse set of responses, it is not enough to only focus on frequently co-occurring phrases. It is equally desirable to pull out salient phrases across all the responses. We apply term frequency–inverse document frequency (tf-idf), which is a numerical statistic that is intended to reflect how important a word is to a response in a collection of documents (responses in our case). The tf–idf value increases proportionally to the number of times a word appears in the document and is offset by the number of documents in the corpus that contain the word, which helps to adjust for the fact that some words appear more frequently in general. For example, a, the, of, at, are very frequent but do not convey much meaning on their own.
For example, consider a response containing 20 words wherein the phrase ‘good-discipline’ appears 3 times. The term frequency for ‘good-discipline’ is then (3 / 20) = 0.15. If we assume that we have 5000 responses and the phrase ‘good-discipline’ appears in 10 of these, the inverse document frequency is calculated as log (5000 / 10) = 2.69. Thus, the tf-idf weight is the product of these quantities: 0.15 * 2.69= 0.4035. Thus tf-idf allowed us to increase the weight of this key phrase from 0.15 to 0.40. We used Scikit-learn which is another free machine learning library for the Python programming language to extract important phrases based on their tf-idf weights.
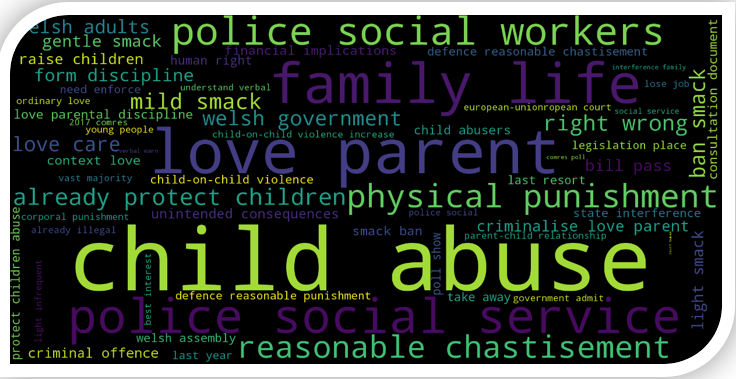
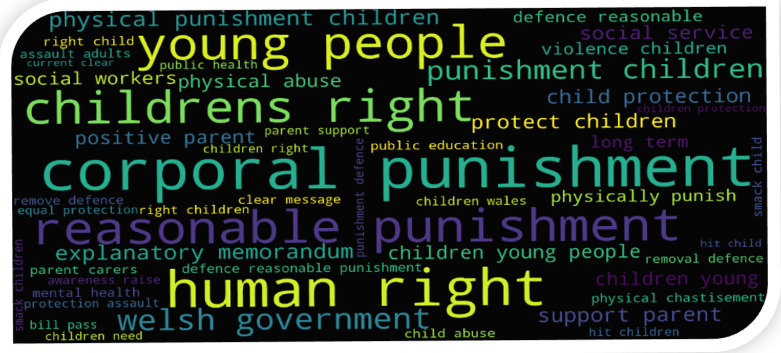
The most important phrases used by respondents in opposition to the Bill include: child abuse, love parent, social service, protect children, discipline children, family life, reasonable chastisement, parent criminalise. The most important phrases used by respondents in support for the Bill include: corporal punishment, welsh government, human/children’s right, positive parent, physical abuse, protect children. We find there is a good degree of overlap between the most frequent phrases and most important phrases emerging from the responses who do not support the Bill. Likewise, there is a good degree of overlap between the most frequent phrases and most important phrases emerging from the responses who do support the Bill. Most important phrases in the responses on both sides of the divide is shown in two separate word clouds (Figures 7a and 7b), where, as before, text size of the phrases in the word cloud is proportional to their tf-idf weights.
Figure 7a: The most important phrases used by respondents in opposition to the Bill
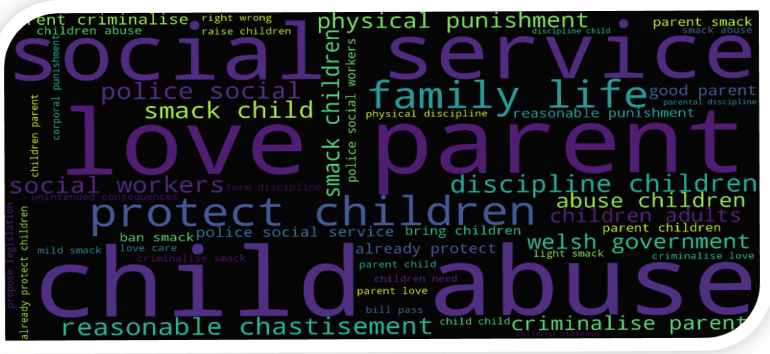
Figure 7b: The most important phrases used by respondents in support of the Bill
6. Conclusions
In this work we undertook an experimental investigation to apply natural language processing techniques to analyse responses to a consultation gathering views on the general principles of a recently introduced Welsh Government Bill – the “Children (Abolition of Defence of Reasonable Punishment) (Wales)” Bill. Our work represents one aspect of the Children, Young People and Education (CYPE) Committee’s analysis. Using data science techniques, we were able to independently analyse the free text responses to provide a clear overview of important themes and trends to help inform the Committee decision-making.
The size of the dataset was not large enough for ‘big data’ data science techniques including neural network based model training to be applicable. However, the results of our analysis based on methods such as detecting most frequent co-occurring phrases and most important phrases (based on tf-idf score) resulted in outputs which were found to be in very good overlap with the outputs achieved through an independent (manual) analysis conducted by the Children, Young People and Education Committee. The present work can be seen as an example of the usefulness of data science techniques in analysing modest size data sources and with high accessibility to interpret the results.
In its report the Assembly’s Children, Young People and Education Committee thanked the Data Science Campus at the Office for National Statistics for its analysis of the 650 consultation responses. The Committee’s report includes a section on ‘stakeholder and public opinion’, stating it had ‘been very conscious of the strength of feeling on both sides of the debate’. The ONS Data Science Campus report was published alongside the Committee’s main report and some of the findings of our work are incorporated on pages 76 and 77 of the Committee’s report. The project team members from the Data Science Campus attended a formal Assembly Committee meeting to present the findings of the free text analysis directly to the Assembly Members (AMs) who authored the report. This enabled AMs to consider and discuss the data science findings with the project team members. This was in order to inform the Committee’s consideration and whether it would support or otherwise the general principles of this legislation.
The Python code developed in the Data Science Campus and used to analyse the consultation responses is available as a Jupyter notebook.