Evaluating Calorie Intake
1. Executive Summary
The Evaluating Calorie Intake for Population Statistical Estimates (ECLIPSE) project was carried out by the Data Science Campus at the Office for National Statistics (ONS). Its goal was to better understand the apparent under-estimation of average calorie intake reported in national surveys. The aims of this project were to quantify the level of accuracy in estimates from self-reported data and explore methods for adjusting and improving the accuracy of population level statistics.
Doubly labelled water (DLW) is a method of measuring energy expenditure and is considered to be the gold standard in nutrition studies as an approximation of “true” calorie intake. There are considerable drawbacks to collecting large scale samples of DLW measures, including the substantial costs involved. Data for a small sub-sample of individuals are collected as part of the National Diet and Nutrition Survey (NDNS). NDNS data were used for the analysis, accessed via the UK Data Service.
Reporting error (the percentage difference in calorie intake between self-reported estimates and DLW measures) was modelled using multivariate linear regression with data from 197 adults. Errors were predicted to derive adjusted estimates with data from the remaining 4,255 adults in the sample. The percentage of individuals with calorie intake estimates outside of a biologically plausible range (the “implausibility rate”) was used to compare the accuracy of unadjusted and adjusted intake estimates.
The average reporting error across all adults in the sample was found to be 32.0%. The minimum was negative 16.5% (over-reported) and the maximum was 72.2% (under-reported). Absolute differences between self-reported estimates and DLW measures ranged from 598 to 3,671 calories. Self-reported intake, weight, age and gender were all significantly associated with reporting error. The (baseline) implausibility rate was 34.4%. Adjusted energy intake estimates produced an implausibility rate of 1.1%. The results suggest that this methodology offers an improvement to the accuracy of population level estimates by adjusting self-reported calorie intake data using factors predicted from DLW data.
The findings presented in this report corroborate weight as a significant factor associated with individual reporting error. Increasing obesity rates could be a contributing factor of reporting error in national estimates of calorie intake. It was not possible to analyse differences in reporting error over time, future research could investigate this in further detail.
The findings presented in this report are the results of experimental research. The statistics presented relating to mean calorie intake estimates should not be interpreted as official estimates. Further testing and validation would be necessary before implementing into production of official statistics.
2. Introduction
The Evaluating Calorie Intake for Population Statistical Estimates (ECLIPSE) project was carried out by the Data Science Campus at the Office for National Statistics (ONS). The objective was to research methods for improving national population level estimates of people’s energy consumption, taking into consideration the opportunities afforded with data science techniques. This included the exploration of novel data sources alongside the traditional survey data, of which the National Statistics on diet and nutrition are based upon. This report presents findings from research carried out as part of the ECLIPSE project.
ECLIPSE was one part of a programme of work across the Government Statistical Service (GSS) in response to findings published in the report Counting Calories: How under-reporting can explain the apparent fall in calorie intake. Analysis carried out by the Behavioral Insights (BI) team at the Cabinet Office (CO) investigated the declining trend in population calorie intake reported in official statistics over recent decades, alongside the rising levels of obesity observed in the same time period. The report concluded that the decline was due to the level of under-reporting in the survey data.
ONS are leading the programme of work aimed at addressing the issues highlighted in the Counting Calories report. The report A Government Statistical Service perspective on official estimates of calorie consumption discussed aspects in the production of official statistics that challenge efforts to accurately estimate true calorie intake. A number of alternative data sources were identified for their potential to help better understand the reporting error and/or improve the quality of official statistics. These included supermarket product information data, till point data from food outlets, data from food wastage and data from studies using biometric data.
The ECLIPSE project considered these novel data sources and assessed analytical methods that could help address the apparent issues reported in Counting Calories. An estimate of true national average energy intake would be required to facilitate evaluation of novel and alternative data sources, so that outputs derived from them can be validated and any potential accuracy gains accurately quantified.
ECLIPSE focused on the use of biometric data as it offers a robust and objective measure to benchmark and facilitates comparison of estimates derived from other data sources, including self-reported data collected in national surveys.
3. Background
Self-reported data on food consumption behaviours are widely recognised as containing inherent biases. Despite the meticulous and robust survey design methods, it is a challenge to accurately capture consumption. There is a vast amount of research describing the errors and bias contained within nutrition and dietary statistics compiled from self-reported data, and statistical methods used to adjust for them. For more information, see the following articles:
- The problem of accuracy in dietary surveys. Analysis of the over 65 UK National Diet and Nutrition Survey
- Underreporting of energy intake in repeated 24-hour recalls related to gender, age, weight status, day of interview, educational level, reported food intake, smoking habits and area of living The problem of accuracy in dietary survey: analysis of the over 65 UK national diet and nutrition survey
- The validity of self-reported energy intake as determined using the doubly labelled water technique
- Elevated BMI and male sex are associated with greater underreporting of calorie intake as assessed by doubly labelled water
- Comparison of two methods for adjusting self-reported dietary recall of total energy intake of populations
Estimating calorie intake is challenging due to variation in a multitude of contributing factors. Including, for example:
- the nutritional content and quantities of foods consumed is heterogeneous across the population
- the nutritional content within a given meal is dependent on ingredients used to make it, cooking methods and portion sizes
- the types of food consumed and food sources vary with the temperate climate and across cultures and between socio-economic groups and geographical locations
Biometric data are widely used in medical research and offer objective measurements across individuals, avoiding bias introduced by the data collection source or mechanism. Doubly labelled water (DLW) is a method of measuring energy expenditure. It is widely used for the purpose of estimating consumption and is considered to be the gold standard for estimating calorie intake in nutrition studies. The major drawback for large scale data collection is the considerable cost involved, due to the scarcity of the materials and the complexity of the laboratory work required.
DLW data are already collected as part of the National Diet and Nutrition Survey (NDNS). Public Health England (PHE) and the UK Food Standards Agency (FSA) jointly fund the UK NDNS. It is used to assess energy expenditure in a sub-sample of NDNS participants.
Previous analysis has shown there to be an overall average difference of 34% between self-reported energy intake estimates and measured expenditure. Whilst energy intake is not directly comparable with energy expenditure, it does provide a reasonably sound basis against which to compare other attempts at estimating true calorie intake.
Comparing calorie expenditure from DLW measures to estimates of calorie intake from self-reported survey data provides an opportunity to quantify individual reporting error in survey data, and the affect on error associated with individual characteristics. As there is an urgent need for a method to improve the national statistics describing calorie intake, the approach has focused on a methodology that could be incorporated into the existing process for producing official statistics.
4. Aims
The primary aim of the Evaluating Calorie Intake for Population Statistical Estimates (ECLIPSE) project was to compare energy intake estimates from biometric data with estimates from self reported data and to determine individual level factors associated with the quantified differences between them.
The secondary aim of this project was to explore potential methods to adjust self-reported calorie intake estimates for improving the accuracy of population statistics. This report describes the biometric data and the statistical methods used in the analysis. Results are presented and discussed along with an explanation of the limitations. Areas for further work are also highlighted.
The goal of the project was to develop a proof of concept for a statistical methodology and explore its viability for practical use. The analysis carried out in this project was an exploration of data science techniques that could improve the accuracy of national estimates of calorie intake. The results presented in this report should be corroborated and further validation of the model predicting individual error in self-reported data is required before incorporating into the production of official statistics.
5. Data
Data from the National Diet and Nutrition Survey (NDNS) were accessed from the UK Data Service . Data from survey years one to six were used (collected between 2008 and 2014). The NDNS data contain information on energy intake from self-reported diet collected using food diaries. Information on individual demographics and anthropometric measures are also recorded; and, for a sub-group of participants, biometric data from doubly labelled water (DLW) tests sampled during survey years one and three.
6. Methods
The methods presented in this section describe the use of doubly labelled water (DLW) data. The measure of “error” in the self-reported survey data is derived by comparing the biometric measure of energy expenditure with the self-reported estimate of calorie intake for each individual. The difference between these two metrics and the associated individual characteristics was analysed. The results were used to adjust calorie intake estimates from self-reported data for individuals for whom biometric measures are not available.
Records for adults aged 19 and over were extracted from the National Diet and Nutrition Survey (NDNS) data. After excluding records with missing values for height and weight, the total number of records was 4,452. Data were divided into a training dataset comprised of a sub-group used to develop the models (for those that had DLW measures, the number of records (n=197) and a test dataset of remaining individuals (for those without DLW measures, n=4,255).
The analysis used differences between energy intake from self-reported data (EISR) and energy expenditure (EE) measures from DLW to derive “reporting error” for individuals in the training dataset. In this context, EE is considered an approximation to EI and relies on the assumption of homeostasis (that is, that body weight is stable) for individuals in the dataset, and that therefore, energy intake equals energy expenditure (EI = EE).
The error for subjects in the training dataset was estimated as the difference between EE and self-reported EI (EISR), as a percentage of energy expenditure. For example: Reporting error = (EE − EISR)/ EE.
Basal metabolic rate (BMR) is a measure of the estimated number of calories required to sustain life. BMR was derived for all individuals in both datasets using age- and sex-specific formulas based on height and weight described in the Schofield equations. There are a number of methods to calculate BMR. The Schofield equations were used by NDNS at the time the analysis was carried out. Since then, this formula has been replaced in favour of the Henry equations, which will be used for the production of official statistics in future.
Physical activity level (PAL) is a ratio of energy expenditure to BMR (PAL = EE/BMR). In homeostasis, EE = EI and so EE/BMR = EI/BMR = PAL. Since EI cannot biologically be less than BMR, PAL has a lower bound of one for plausible values. Higher values for the lower bound cut-off are often used in studies using this method to identify under-reporters such as the “Golderberg cut-off” (Goldberg and others 1991). However, estimates for individuals within plausible ranges may still be under- or over-reported and so a minimal bound of one was used in the analysis. The implausibility rate was defined as the percentage of individuals with energy intake values outside the biologically plausible range (that is, where EI/BMR < 1).
Descriptive analysis from data on the entire dataset included unadjusted averages of calorie intake for males and females, exploration of trends over time and the percentage of individuals with values below estimated average requirements (EAR) for their respective age and sex group. Univariate analysis of both sample groups included means and standard deviations for individual characteristics represented by continuous variables, for males and females separately.
Multivariate linear regression was used to model percentage error in EISR associated with characteristics for individuals in the DLW sample group, where a positive value represented under-reporting and a negative value represented over-reporting. The distribution of the percentage error was examined with a quintile-quintile plot and found to be generally normally distributed, only slightly deviating from normality at the extreme end of over-reporters. As most people under-report, over-reporters represent only a small proportion of the data. A test of skewness did not yield any statistically significant evidence to reject normality and the outcome variable of percentage error was determined to be suitable for linear regression.
Independent variables considered for inclusion in the model were:
- age
- sex
- weight
- height
- body mass index (BMI)
- physical activity level
- reported calories
- BMR
Backward stepwise regression was used for variable selection in the model using a cut-off p-value of 0.05. Bootstrap methods were used to derive model estimates from 1,000 replications of sampling with replacement from the DLW sub-group. The linear equation from the model was used to predict the reporting error for individuals in the remaining sample and derive adjusted energy intake estimates. The implausibility rate was used to compare the accuracy of the adjusted and unadjusted estimates.
All statistical analysis was carried out in STATA 14.
7. Results
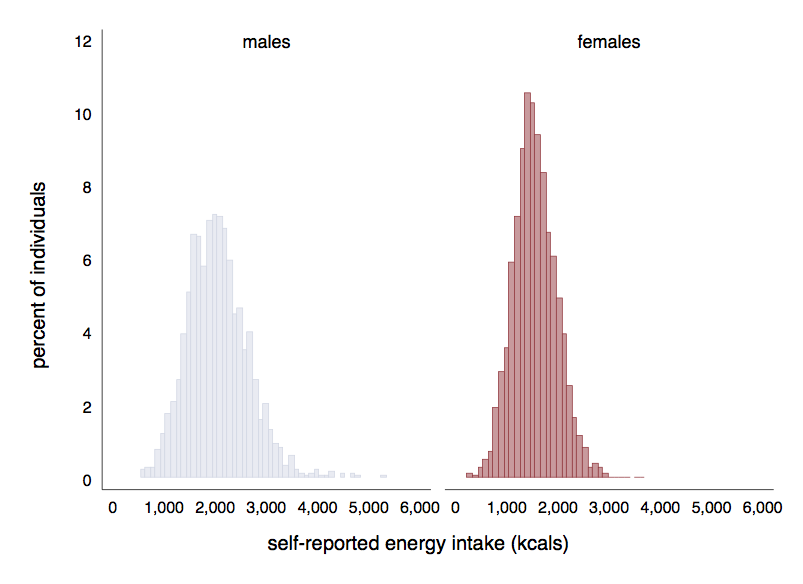
Figure 1 shows the distribution of energy intake from self-reported data (EISR). The mean energy intake estimated using self-reported data was found to be 2,065 and 1,570 calories for males and females respectively, across all survey years. Of all subjects, 78.8% (3,507 out of 4,452) had EISR values below the estimated average requirements (EAR) for their age-sex.
Figure 1: Distribution of energy intake estimates (mean daily calories) from self-reported data, for males (n=1,825) and females (n=2,627), UK, 2008 to 2014.
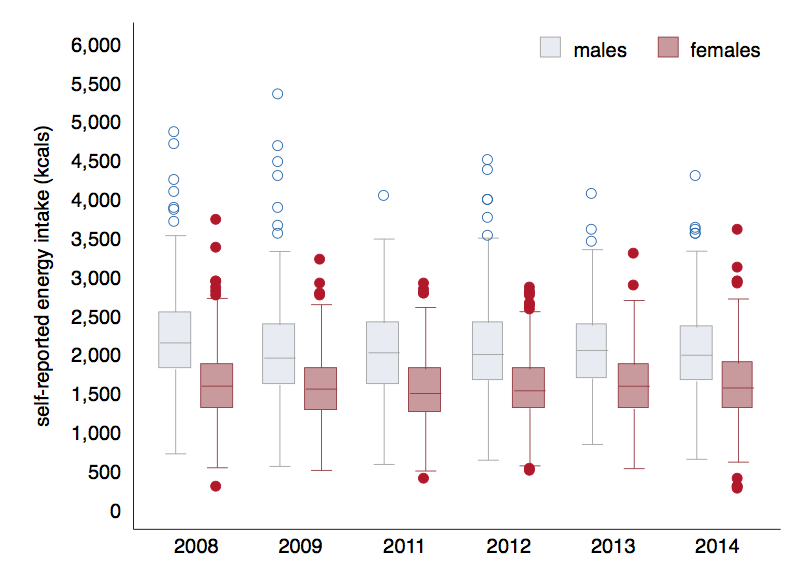
The estimated average energy intake (EI) declined across study years, from 2,198 and 1,600 calories in 2008 to 2,033 and 1,584 calories in 2014 for males and females respectively, as shown in Figure 2. The decline was found to be statistically significant for males (b= negative 19, p=0.02). There was no statistical difference in estimates for females (b= negative 1, p=0.46).
Figure 2: Intake estimates (mean daily calories) from self-reported data, by study year, UK, 2008 to 2014.
The distribution of physical activity level (PAL) scores derived from EISR are shown in Figure 3. The scores range from low (representing minimal energy expenditure, as would be expected in bed-bound individuals), to high (representing excessive energy expenditure, as would be expected by professional athletes). The scores are normally distributed centred on a mean value of 1.2. The percentage of individuals with PAL smaller than 1, the overall implausibility rate, was 34.4% (1,533 out of 4,452).
Figure 3: Distribution of physical activity level (PAL) scores from self-reported data (n=4,452), UK, 2008 to 2014.
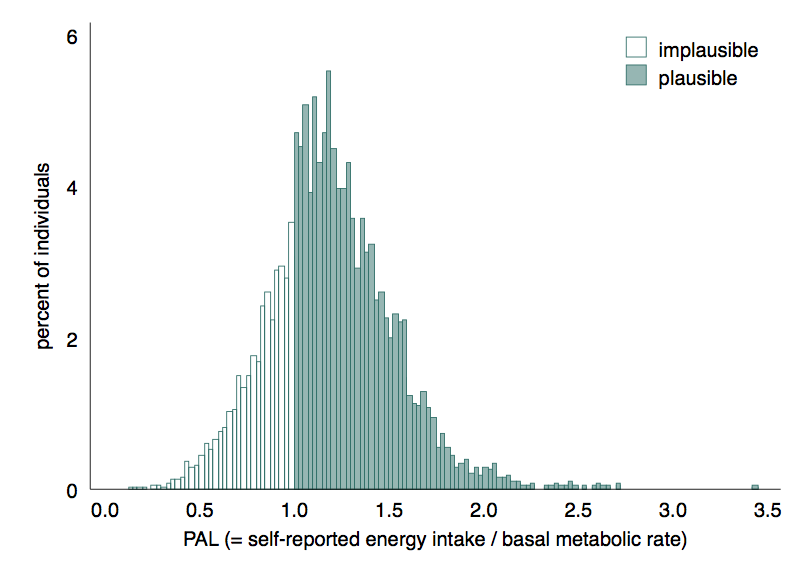
Figure 4 shows estimates of energy intake from self reported data (EISR) against the estimates of energy intake from doubly labelled water (DLW) data for individuals in the training data (n=197). Where these two estimates are the same, individuals would appear on the dashed line. Most of the points are above this line, representing under-reported estimates from self-reported data. There are a small number of cases that show over-reporting, represented by points below the dashed line.
Figure 4: Individual self-reported energy intake estimates against energy expenditure measures, for males (n=99) and females (n=98), UK, 2008 to 2014.
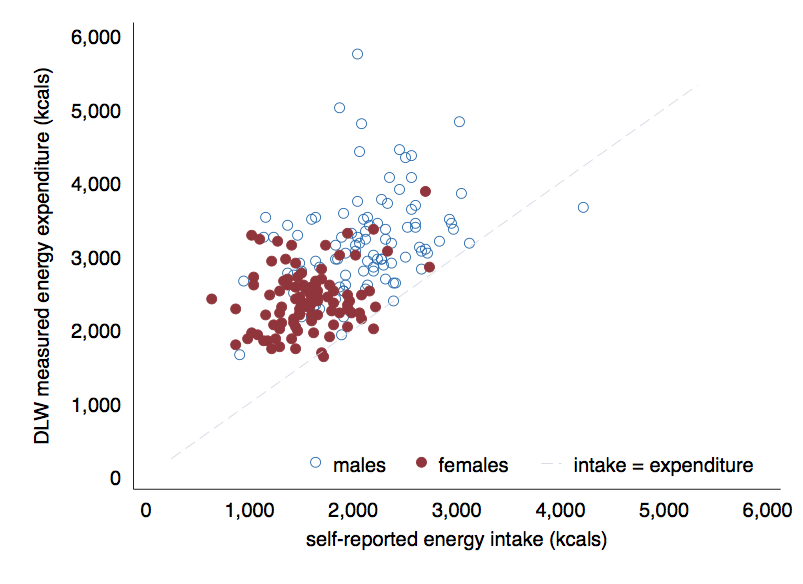
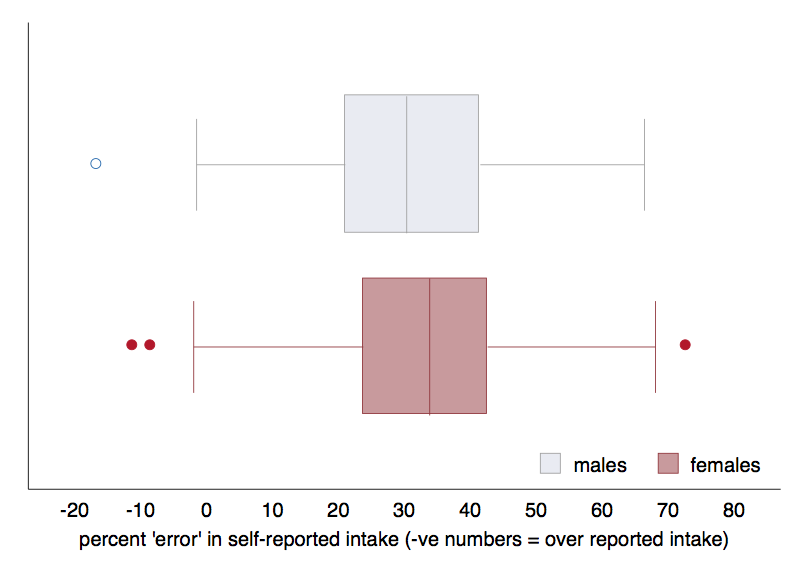
Self-reported estimates of energy intake (EISR) were found to be, on average, 32% lower than DLW measures of energy expenditure (EE). There was no difference between males (mean=31.1%, standard deviation =16.4%) and females (mean=32.7%, standard deviation =16.7%), as shown in Figure 5. Individual error ranged from negative 16.5% to positive 66.4% among males and from negative 11% to positive 72.2% among females. This corresponded to differences ranging from negative 598 to positive 3,671 calories for males and negative 222 to positive 2,217 calories for females, where negative values represent EI values greater than measured EE and positive values represent EI estimates lower than measured EE.
Figure 5: Distribution of “error” in self-reported energy intake estimates, for males (n=99) and females (n=98), UK, 2008 to 2014.
Characteristics of individuals in the DLW sample group and the remaining sample group are shown for males and females in Table 1. There was a higher proportion of females (59.4%) compared with males (40.4%) in the remaining group. On average, individuals in the DLW group were older, for both males and females, compared with the remaining individuals. Sample groups were similar with regards to height and weight, for both sexes.
Table 1: Means (and standard deviation) for characteristics of each sample group, by sex, UK, 2008 to 2014.
|
Males |
Females |
|||
| Remaining | DLW group | Remaining | DLW group | |
| count (%) | 1,726 (40.6) | 99 (50.2) | 2,529 (59.4) | 98 (49.8) |
| age (years) | 49.5 (16.9) | 55.5 (16.4) | 48.7 (17.6) | 56.0 (16.9) |
| height (m) | 1.75 (0.07) | 1.75 (0.07) | 1.61 (0.07) | 1.61 (0.07) |
| weight (kg) | 84.9 (15.2) | 85.4 (15.1) | 71.9 (15.8) | 74.5 (15.7) |
| BMI | 27.8 (4.7) | 27.8 (4.2) | 27.6 (5.9) | 28.7 (6.2) |
| EISR (kcals) | 2,061 (597) | 2,126 (517) | 1,569 (428) | 1,576 (370) |
The dependant variable appeared mostly normally distributed on examination of quintile-quintile plot, with some deviation from normality in the low end and negative range of error values, which represent a small number of over-reporters in the dataset. There is also no evidence to reject the hypothesis that the data are normally distributed based on skewness (p=0.44) or kurtosis (p=0.82).
EISR, age, weight and gender were significantly associated with percentage error. BMI and BMR were not significant and rejected from the final model. The coefficients from the multivariate linear regression for adults are shown in the Table 2, where all associations are significant at the 5% level (p is smaller than 0.05).
Table 2: Coefficients from the multivariate linear regression for adults, UK, 2008 to 2014.
| B | |
| constant | 78.7 |
| EISR (kcals) | -0.03 |
| age (years) | -0.31 |
| weight (kg) | 0.36 |
| female | -10.2 |
The R2 value for the model in Table 2 was 0.69, indicating that the variables age, weight and gender accounted for almost 70% of the variation in percentage differences between measured EE and estimated EI, among individuals in the DLW sample. Residual plots were inspected and no evidence of a relationship between the fitted values and the residuals, satisfying the assumption of least-squares.
The linear equation derived from the modelling described previously was applied to the test dataset to predict the error in EISR for individuals without DLW measures. The average predicted error was 34.0%. Individual predicted error was used to derive adjusted energy intake (EIADJ).
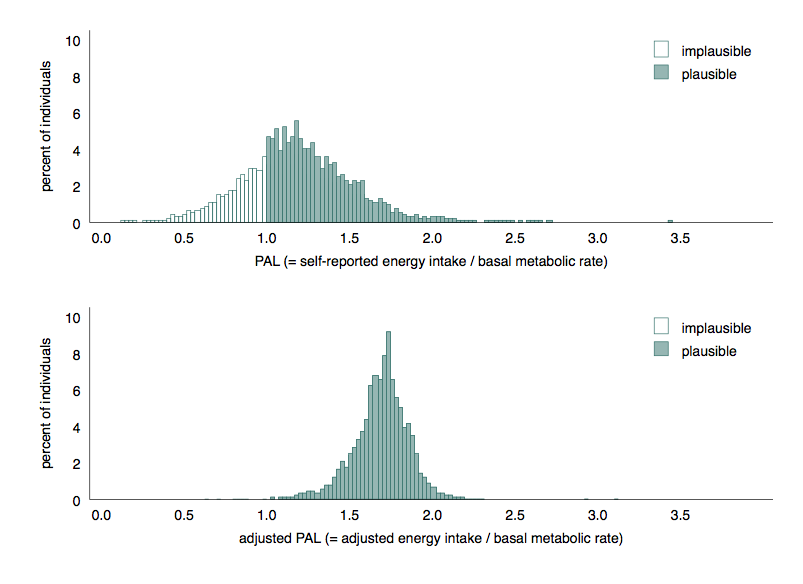
Physical activity levels (PALSR) derived from EISR produced a baseline failure rate of 34.4% in the test dataset (n=4,452). Using the predicted EI to derive adjusted PAL (PALADJ), the distribution of PAL scores is shifted to the right (shown in Figure 6) and the implausibility rate of adjusted energy intake estimates was 1.1%.
Figure 6: Distribution of physical activity level (PAL) scores for self-reported and adjusted estimates, UK, 2008 to 2014.
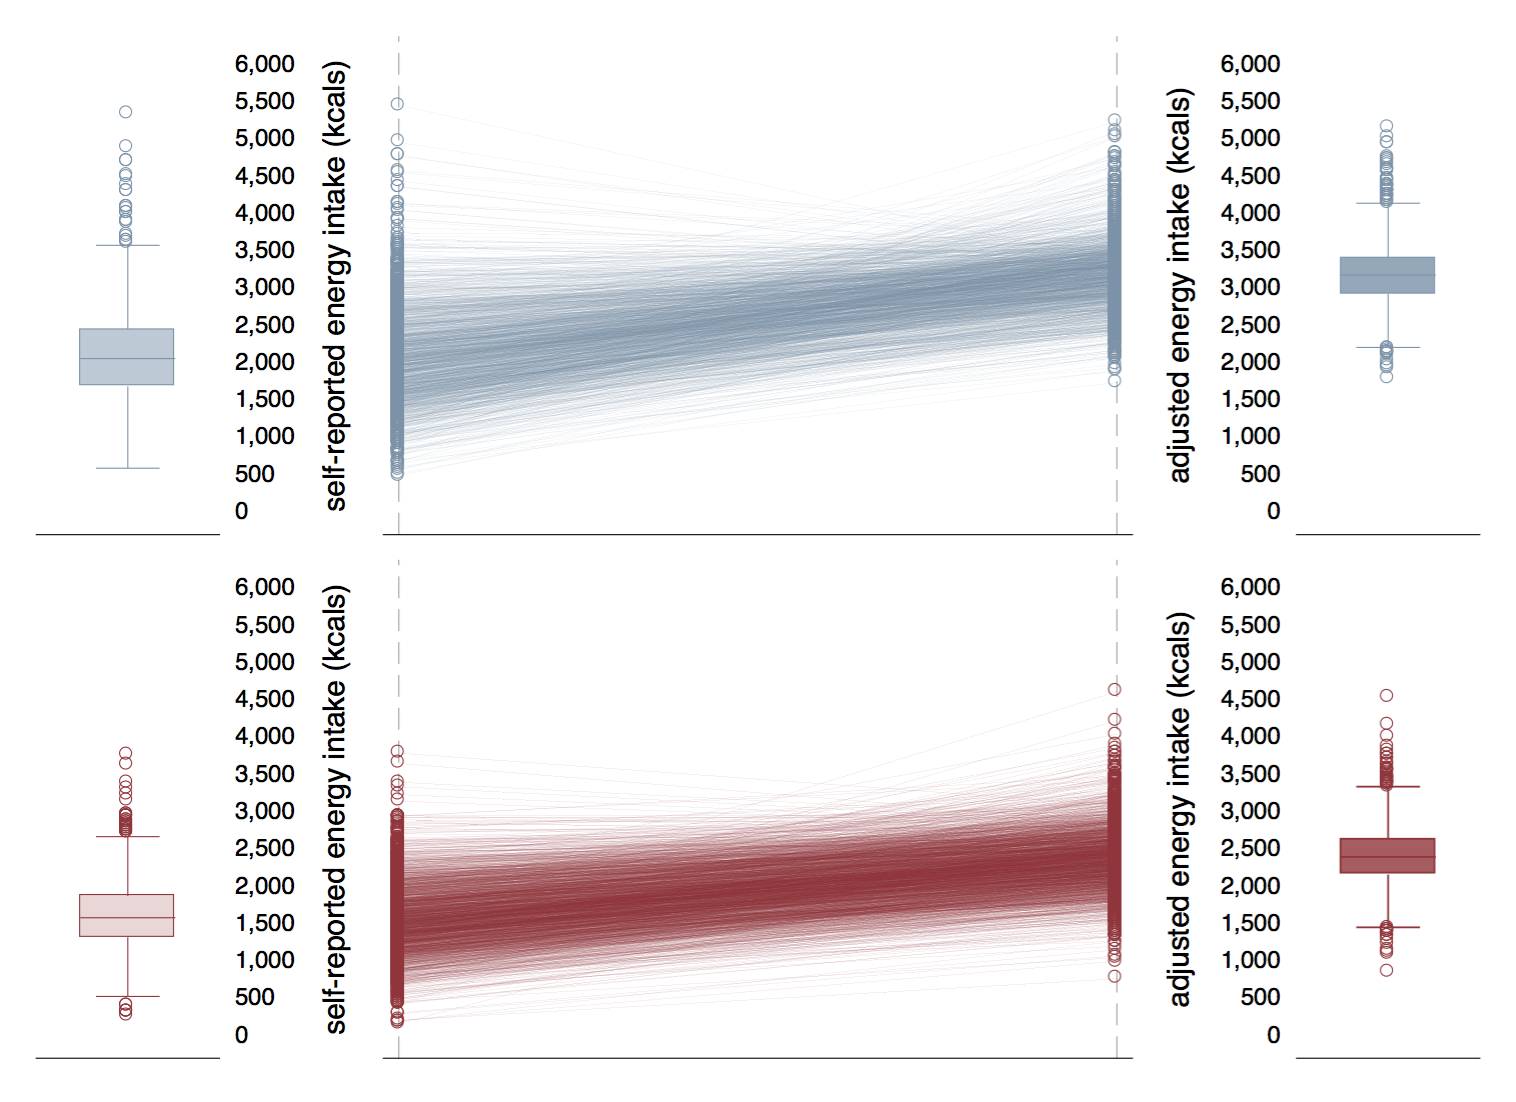
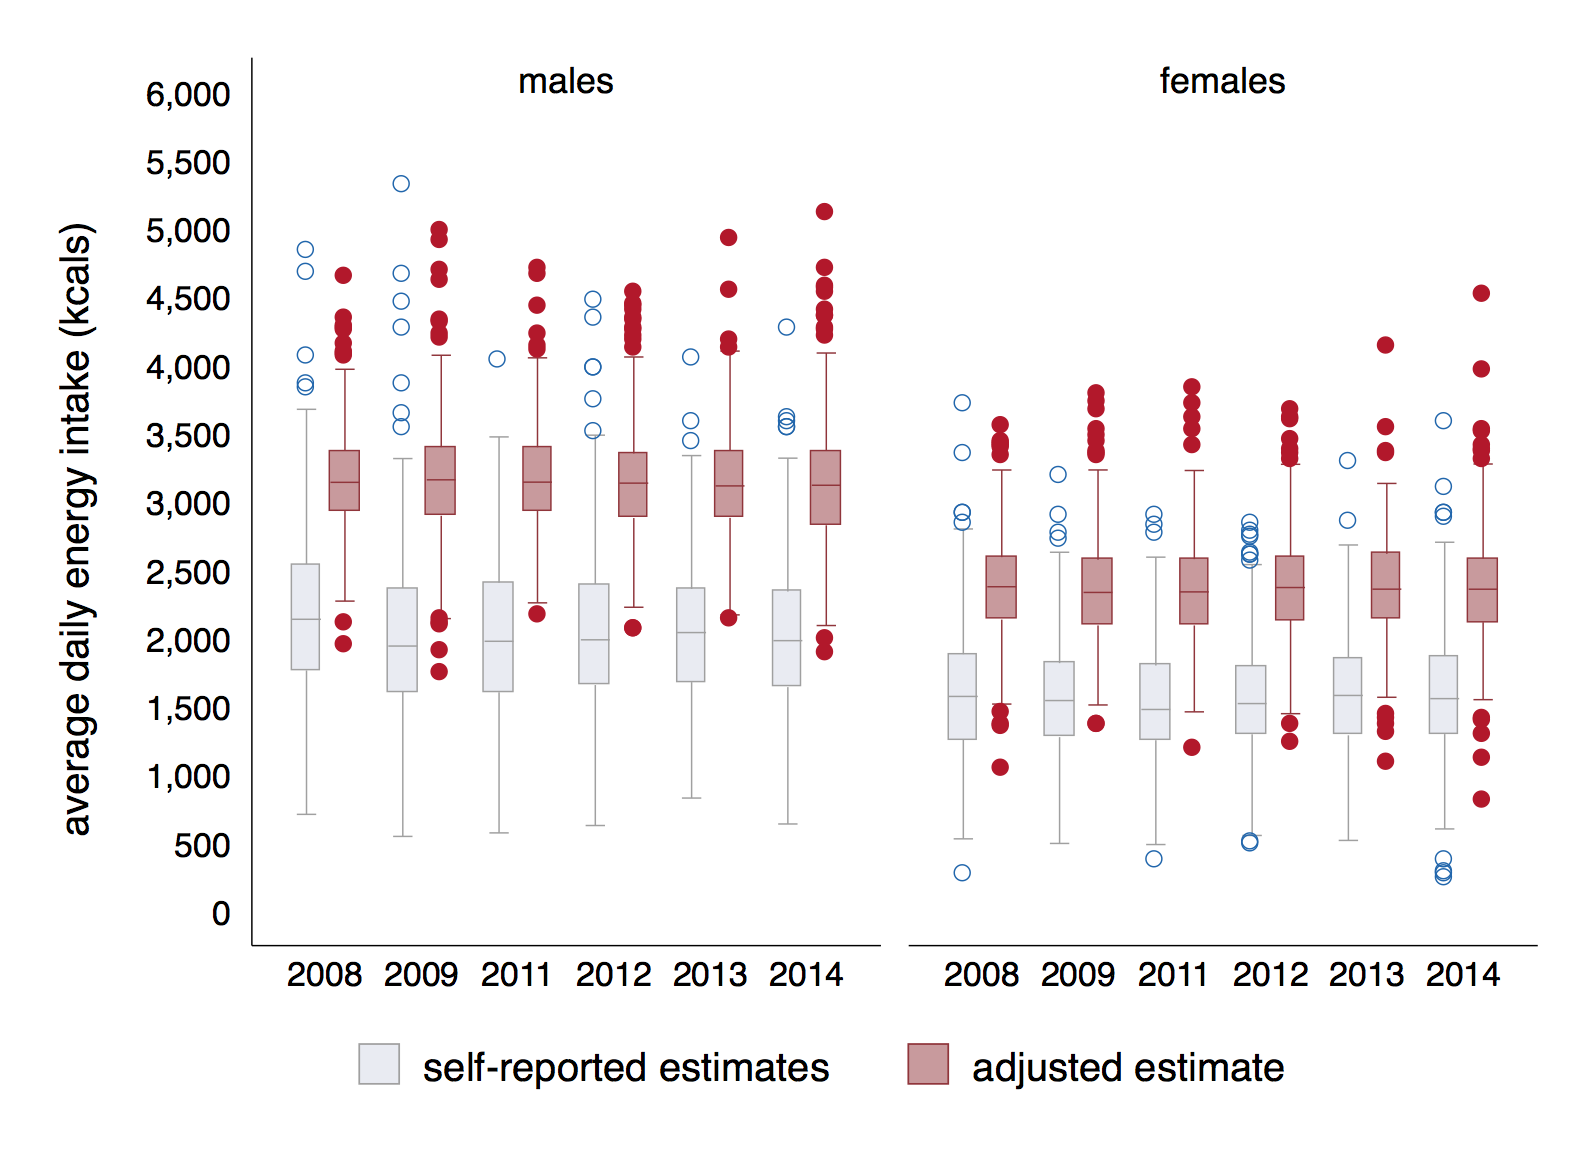
The adjusted average energy intake estimates were found to be 3,119 and 2,393 calories for males and females respectively. Males had an adjusted minimum energy intake of 1,879 calories and a maximum adjusted intake of 6,341 calories; while females had a minimum adjusted energy intake of 1,051 calories and a maximum adjusted intake of 4,601 calories. Figure 7 shows EI from self-reported estimates and adjusted estimates.
Figure 7: Self-reported and adjusted energy intake estimates, for males (top) and females (bottom), UK, 2008 to 2014.
The adjusted calorie intake estimates appear stable over the study years and there was no statistical evidence for decline, among both males (F=0.74, p=0.59) and females (F=0.31, p=0.91). Adjusted average daily calories were found to be 3,164 in 2008 and 3,140 in 2014 for males, and 2,376 in 2008 and 2,365 in 2014 for females.
Figure 8: Self-reported and adjusted energy intake (kcals) over survey years, for males and females, UK, 2008 to 2014.
8. Discussion
The test dataset produced average energy intake (EI) estimates based on self-reported information of 2,065 and 1,570 calories for males and females respectively. While not large, results showed a significant decline in average calories reported between 2008 and 2014 among males (p=0.02) but not females (p=0.46). The average under-reporting error for participants was 32%, a small number of cases over-reported intake.
Individual errors in self reported estimates from the test dataset were predicted using linear equations derived from bootstrapped sampling of the training dataset. The predicted errors were then estimated for individuals in the test dataset. Adjusted EI produced estimates of mean calorie consumption of 3,119 and 2,393 calories for males and females respectively. The model indicated that 69%% of the variation in individual reporting error was accounted for by self-reported energy intake, weight, age and gender. This suggests that the factors influencing reporting error may be fairly predictable across individuals.
Adjusted EI showed no statistical evidence of decline over the survey years for either males or females. The implausibility rate from adjusted estimates of energy intake was 1.1% compared with a baseline rate of 34.4% from unadjusted estimates. The results suggest this methodology offers an improvement to the accuracy of national estimates by re-calibrating self-reported data.
The Counting Calories report noted that the decline was increasing over time and this may be explained by an increase in under-reporting. As weight was found to be associated with level of under-reporting, this could be explained by a requirement for more calories to maintain energy balance and therefore error in the population increases as the weight of the population increases. Doubly labelled water (DLW) samples are not carried out annually, only two years of data were available at the time of analysis and so it was not possible to test the hypothesis that under-reporting has increased at an individual level over time. However, it is interesting to note that the decline in energy intake observed for unadjusted estimates was not significant after re-calibration.
The method presented in this report demonstrates that the existing repository of biometric data could be used to improve the accuracy of the official statistics on calorie intake, by adjusting self-reported data. The statistical methods described are simple to implement with standard statistical programming software (R, STATA, SAS). The model was tested using the remaining sample from the National Diet and Nutrition Survey (NDNS) data but the method has been designed to enable adjustment of any sample dataset containing individual estimates of calorie intake and the adjustment factors used in the model.
The findings presented in this report are the results of experimental research. The statistics presented relating to mean calorie intake estimates should not be interpreted as official estimates. Further testing and validation would be necessary before implementing into production of official statistics. This work has demonstrated the possibility of using biometric data to derive:
- further insight into the error associated with self-reported survey data
- statistical methodology for re-calibrating official statistics
This approach could be used as a practical solution for improving the accuracy of the calorie intake estimates, making use of an existing government data source. The issue of under-estimating calorie intake is influenced by many factors and so requires a multi-faceted approach to tackle. Potential solutions may involve a number of approaches, involving data science tools and techniques as well as the use of alternative data sources, such as supermarket data. The findings presented provide a quantified benchmark of error associated with self-reported data, which could be used to assess other such methods or in future research.
Furthermore, this method may be suitable for the production of other statistics on individual consumption behaviours such as smoking and drinking alcohol. Reporting bias can also be a challenge when measuring intake of alcohol or cigarettes and other behaviours that are subject to perception of social acceptability and food consumption is similar to these.
9. Limitations
The sample size of the data set used to model the adjustment factors was small (n=197). Bootstrapping methods were used to investigate the variability in the model, which ran the regression model on random samples drawn from the DLW group. Results from 1,000 replications were examined. The variation in the predictor variable coefficients was very small, providing assurance that the model is not unduly influenced by extreme values within the small number of data points. This cannot address selection bias which may occur if some unmeasured characteristic distinguishes those that agree to provide biometric samples compared to those that did not.
DLW does not measure the same physiological process captured in food consumption diaries i.e. energy expenditure (EE) is measured rather than energy intake (EI). EE was used as an approximation for EI. The method assumes a number of things:
- Individuals body weight is in homeostasis (energy intake is balanced with energy expenditure) i.e. not gaining or losing weight. It is assumed subjects were not dieting.
- Individuals dietary behaviour was consistent throughout study. DLW tests were carried out a different time to the food diaries, it is assumed subject’s eating behavior was the same over both data collection periods.
- Individuals in the DLW sample are representative of the total population. It is assumed that persons participating in the DLW sub-study do not differ from the remaining sample in relation to factors associated with percentage error in self-reported energy intake estimates.
The method is designed to adjust for population estimates and cannot be used to precisely estimate intake for a given individual as the variation within true individual intake averages out over a large sample.
This method can only adjust overall calorie intake estimates and cannot provide adjusted estimates for nutritional composition of those calories. It was not possible to assess whether under-reporting is biased towards certain energy sources such as sugar or alcohol.
10. Further work
It is recommended that the methods presented in this report be tested and results corroborated before implementation. The Evaluating Calorie Intake for Population Statistical Estimates (ECLIPSE) project has provided some insights upon which further work can be developed. This would require a range of expertise including data scientists and nutritional specialists, to refine the methodology and ensure it is fit for purpose. The code and outputs for the analysis are publically available on GitHub . The data are available from the UK Data Service.
Given the uncertainty around the cause and trend of under-reporting over time, it would be optimal to derive new models of reporting error each year. This would require expanding the collection of doubly labelled water (DLW) data. As previously discussed, acquiring these data for large-scale samples has many challenges.
Use of DLW data from existing data repositories such as the UK Bio Bank could be considered as one approach to overcoming them. Sharing or combining DLW data would increase the value derived from this expensive resource. Models derived from meta-analysis over different sources of DLW data could offer further improvements to the recalibration model by augmenting findings from studies of different populations. The availability and accessibility of data increasingly affords the opportunity to combine survey data with other types, such as biometric data to enhance statistical insights derived.
Given the known error in self-reported intake and in the inability to assess that error across nutritional factors, it is recommended that consideration be given to using bio-markers for main factors of interest for obesity epidemiologists so that the true intake of main dietary nutrients can be measured, and population estimates be recalibrated. As described in this report, biometric measures provide objective, scientifically-robust estimates of population dietary behaviour and could be used to improve the accuracy of statistics fundamental to our understanding, and ability to tackle, the obesity epidemic. Biometric measures of consumption for main components of energy composition such as fat, sugar, protein or fibre would allow further analysis to investigate if under-reporting is consistent across food groups. The method described in this report could be similarly used to adjust the nutritional composition of energy intake estimates.
This project only considered methodologies related to measuring calorie intake, which is only one half of the energy balance, calorie expenditure through physical activity being the other. Since these two factors of the energy balance are not mutually exclusive, data on intake and expenditure for the same individuals would allow more sophisticated analysis and application of data science techniques than is possible with disparate sources of data on these two important policy areas.
Further research may involve combining data on physical activity and food consumption, to facilitate analytical exploration into this important public health issue and enhance the evidence for important policy decisions aimed at tackling the obesity crises.
12 comments on “Evaluating Calorie Intake”
Comments are closed.
Please would you define acronyms such as doubly labelled water DLW. I eventually went to Google, having already looked at two of your references to see what it was. We cannot all be familiar with or up-to-date on them all.
oops! I was really careful in making sure I defined all acronyms to avoid the confusion that you experienced. Obviously I missed a couple, if you could kindly let me know the ones I missed, I will make sure they are updated in the next draft.
thank you for these amazing insights: astonishing that 17% of people under-report intakes to counter the ‘most people’ who over-report. What to do?
thanks – we thought these insights were really interesting too, they help to provide a better understanding of the individual variation in self-reporting error and we found that over-reporting occurs as well as under-reporting, though to a much lesser extent. As you say, the next step is to use this information in a positive way to help address the issue. We have some thoughts, but any other ideas are always welcome!
Interesting and potentially very important data. Reinforces my scepticism of observational research relating measures of diet and health that claim weak or small increases in risk. Many use dietary assessment methods that are even less robust than the NDNS. Also raises questions about assumed nutritional status of the population; if under reporting is across the diet then estimates of people below LRNI probably exaggerated but if it is focused on “naughty foods” then the population may be further away from fat, sugar and alcohol targets than NDNS suggests.
You raise some really interesting points there. Understanding the nutritional content of energy intake is vitally important. One of the limitations of using the DLW method is that it does not allow for exploration of the nutritional content of calories, however there are other biometric markers that could facilitate this and is a possible area for further research.
The old National Food Survey suggests a fall in UK per capita energy intake of over a quarter between 1950 and say 1990, this is supported by Food Balance Sheet data. Presumably these sources would be less liable to systematic under reporting than the individual diet records of the NDNS? These data have helped to persuade me that inactivity has been a major driver of population obesity especially as high BMI seems to be associated with inactivity. Do I need to adjust my views and teaching? Happy to receive thoughts or comments at g.p.webb@uel.ac.uk
Thanks for your comment. This study did not look at the associations between physical activity and calorie intake although this would have been an interesting avenue to explore. I have sent you an email with further information on this for your consideration.
Thanks for this nice description! You mention in the Data section that the self-reported energy intakes were determined from food diaries. I was wondering how many diary days were collected and whether the DLW period occurred over the same time period as the diaries? Also, you might be interested in the following paper for estimating changes in energy intake over time: https://www.ncbi.nlm.nih.gov/pmc/articles/PMC4515869/
That’s great to hear – thanks!
The food diary data is collected over 4 days and the DLW is measured at a later date. This method of analysis relies on the assumption that individuals dietary behaviour was consistent throughout study, such that eating behavior was the same between the two time periods was the same. Individuals included on the study had indicated they were not dieting.
Nice data – but Dale Schoeller and Bill Dietz showed this in 1990 (Can J Physiol Pharmacol. 1990 Jul;68(7):941-9. Inaccuracies in self-reported intake identified by comparison with the doubly labelled water method) with several papers in subsequent years. Would have been interesting to know how your data compared with the established literature and whether there was evidence for secular changes in under-reporting using these datasets. It was sad that the media used your results to stigmatise patients with obesity by calling them ‘liars’.
Thank you for your comment. The ECLIPSE project built on work reported in the Counting Calories report, which describes the established literature including references to Dietz work. The main focus of the ECLIPSE project was to assess potential accuracy gains using statistical adjustment, and while our findings did corroborate long standing findings which are widely reported in research literature, we decided not to repeat the discussion on established evidence here. It was unfortunate that some headlines from the media coverage were misleading. ECLIPSE did not examine reasons for under-reporting, which are varied and not necessarily conscious omission by the survey respondent.