Understanding NHS coronavirus (COVID-19) app reviews using topic modelling

The NHS coronavirus (COVID-19) contact tracing app launched on 24 September 2020 in England and Wales. During the initial launch of the app, an important challenge was to understand issues that could affect its use and efficacy. NHS Test and Trace asked the Office for National Statistics (ONS) Data Science Campus (aided by the ONS Best Practice and Impact Division) to help them extract insights from the app reviews as part of their effort to provide an effective service.
The app was designed to facilitate coronavirus contact tracing, using proximity sensing to alert close contacts of those testing positive for coronavirus. It also provided local coronavirus information and a venue check-in facility.
The data science method employed in this work was topic modelling: an automated method for analysing a collection of texts to identify or “learn” common topics within the texts.
The Data Science Campus was brought in at the start of the app’s operation to help support improvements in its operation. Therefore, the issues highlighted here are not representative of the later performance of the app. Also, as this project was aimed at supporting improvements in the app, the analysis in the rest of this report focuses on negative, rather than positive, user feedback and so is not representative of the overall user feedback. Although these user reviews were publicly available on the Apple and Google app stores, actual reviews have been replaced with synthetic reviews with similar properties in the examples presented in this report.
The main technical findings from this report were:
- Topic modelling was successful in uncovering topics or issues raised in text reviews of the NHS coronavirus contact tracing app. Outputs were effectively communicated using a prototype dashboard. This also indicates how insight might be obtained from similar texts.
- Topics were primarily communicated using key terms and representative review texts for each topic. The dashboard user works with these outputs to conceptualise the topics. Additional insight was gained using topic prevalence for each topic, its evolution over time, and mean star ratings for each topic.
- Topic informativeness was enhanced by limiting the analysis to reviews of at least 50 characters. Topic modelling appeared to work reasonably well even for a relatively small numbers of reviews (for example, a few hundred). Topics appeared to be robust to sample size as the analysis output from a 2% sample of the full dataset, or around 250 reviews, appeared to be similar to that from the full dataset.
Outputs from the project were shared with NHS Test and Trace to support identification of issues arising during the app’s initial deployment, to assist in evaluation of the app and to help build data science knowledge.
The method used for this analysis can be reproduced using the method description in the Data science methods section and in the Topic modelling details section.
1. Data and data infrastructure
The coronavirus (COVID-19) app review data are open and publicly viewable on the Apple App Store and Google Play Store. Google Cloud Platform was used to retrieve, store, and process app review data, as detailed in the Google Cloud Platform details section. The data analysed comprised:
- app review text (including capitalised review titles for Apple reviews)
- review date
- star rating (1 to 5, with 5 being most favourable)
Until the end of October 2020, there were approximately 17,000 review texts, heavily weighted towards the launch date. Around a third of these reviews were Apple reviews.
2. Data science methods for analysing app reviews
The primary challenge was to identify the main topics or issues within the text reviews, as a person reading them might do, and then present them in a useful way. The principal data science method used was topic modelling (see point 1 in the References details section). Topic modelling is an automated text processing method to identify or “learn” common topics within a collection of texts. More details can be found in the Topic modelling details section.
The process of topic modelling can be summarised in three concepts:
- Each text is associated with a (weighted) set of topics.
- Each topic is associated with a (weighted) set of terms (words, or combinations of words).
Mathematically, these represent two matrices that are derived by matrix factorisation from the words present in each text, as a third matrix, where:
- Each text is represented by a (weighted) set of terms, weighted according to term importance.
An important pre-processing step, identified through analysis of initial results, was to limit analysis to reviews that were at least 50 characters long. This reduced the number of reviews to 75% of the original number. There was a greater reduction for Google reviews, and a lesser reduction for Apple reviews. This step seemed to improve the informativeness of the topics, as previously some topic descriptions (key terms and example reviews, see Figure 1) could be short and positive, but non-specific in content.
Outputs from topic modelling
Figure 1 shows an example topic identified from user app reviews for 24 September to 31 October 2020. The primary outputs are the key terms and example review texts for the topic. The text size of each of the key terms represents its importance for the topic (its weight). The review texts are those most representative of the topic (highest weights for texts with that topic as their dominant topic). The user works with these outputs to conceptualise the topic, which in the case of Figure 1 is an issue with phantom notifications. Additional review texts or review sentences may also be investigated to better understand the topic. The example review texts shown are not actual texts but are designed to resemble actual texts.
Figure 1: Example topic for the period 24 September to 31 October 2020
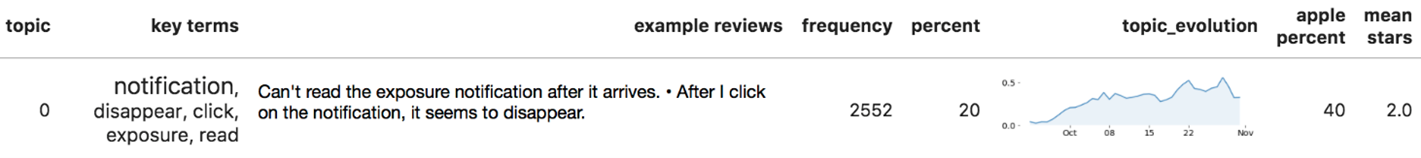
With each review assigned to its dominant (highest weight) topic, aggregate statistics can be produced. Figure 1 shows that these include topic prevalence (“frequency” and “percent”, a measure of topic importance), topic evolution over time, mean topic star ratings (“mean stars”, another measure of topic importance, indicative of which topics were problem issues), and platform relevance (“apple percent”). The percentage of reviews from the Apple app store for each topic (“apple percent”) is interpreted around a mean of 50%, after correcting for the overall prevalence of Apple versus Google reviews.
3. Prototype dashboard for inspecting topic modelling results
A prototype dashboard, incorporating the topic inspection methods in the previous section, was designed to provide a rapid overview of app reviews and the topics derived from them (Figures 2 and 3). As well as communication of outputs, this also facilitated data exploration, analysis of results, and elicitation of feedback.
The principal output comprises topics identified over selected time periods. The number of topics was set by experimentation at eight to maximise informativeness (or five for platform or rating-filtered models) but can be changed. Additional options are described in the Topic modelling details section.
For each time period, the analysis provides, for each topic:
- topic (an arbitrary topic identifier)
- key terms (weightings indicated by text size)
- example reviews (up to three reviews, separated by “•”, maximum total characters 200)
- frequency (number of reviews per topic)
- percent (percent of reviews per topic)
- topic evolution (fraction of reviews per topic per day)
- apple percent (per topic)
- mean stars (per topic)
For additional context, the analysis provides all topics information over time. Note that these do not correspond to individual topics, but have been incorporated into the same table for convenience. This includes:
- numbers of reviews (total per day)
- fraction apple reviews (per day)
- mean star rating (per day)
- star ratings 1 to 5 (per day)
Analysis of app reviews from 24 September to 31 October 2020
Figure 2 show the eight topics identified from app reviews from 24 September (launch) to 31 October 2020. The topics were reasonably understandable and correspond to those expected from manually reading reviews. The topics covered phantom notifications, test result codes, battery issues, app not working issues, risk area, QR code, checkout issues, and ease of use.
Figure 2: Analysis of app reviews from 24 September to 31 October 2020 (click to expand)
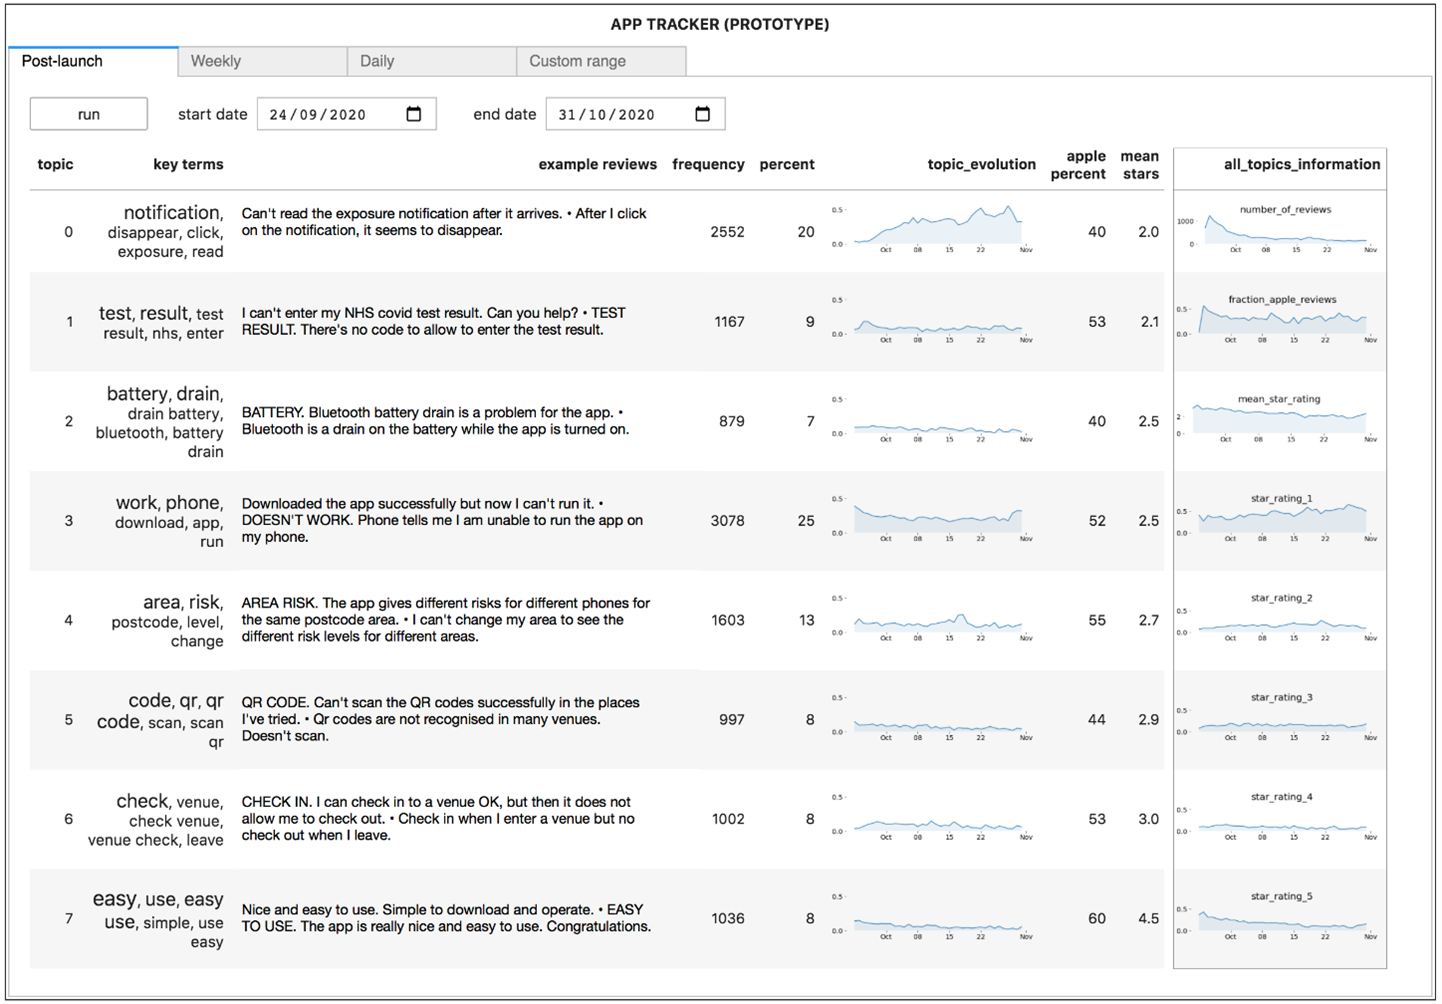
The topics with lower mean star ratings (“mean stars”) are placed toward the top of the table, as those are most likely to be of interest to the dashboard user. The top placed topic (topic 0) corresponded to a phantom notification issue with an overall prevalence of 20% (“percent”) for the reviews analysed. The prevalence of this topic increased over the time period from near 0% at product launch, to around 40% toward the end of the period (“topic_evolution”). The evolution of this and other topics might be correlated to events such as software updates.
Topic 3 had the highest number of reviews at 3,078, with an overall prevalence of 25%. This topic seemed to capture reviews saying the app was not working generally. However, it is not always straightforward to identify the balance between positive and negative comments for a topic (such as app (not) working or battery issues). More insight may be gained through reading additional review texts or looking at the top 10 most “representative” sentences for a topic. This is a limitation of the compressed output.
As a robustness check, these data were sampled to see whether data points would produce outputs that were consistent with the full sample. A 5% sample of around 625 data points produced outputs that were very close to those from the full dataset in the case of key terms and example reviews. A 2% sample of around 250 reviews showed similar results, while even a 1% sample of around 125 reviews appeared to produce informative outputs. This suggests that manual analysis of a sample from a large dataset is possible.
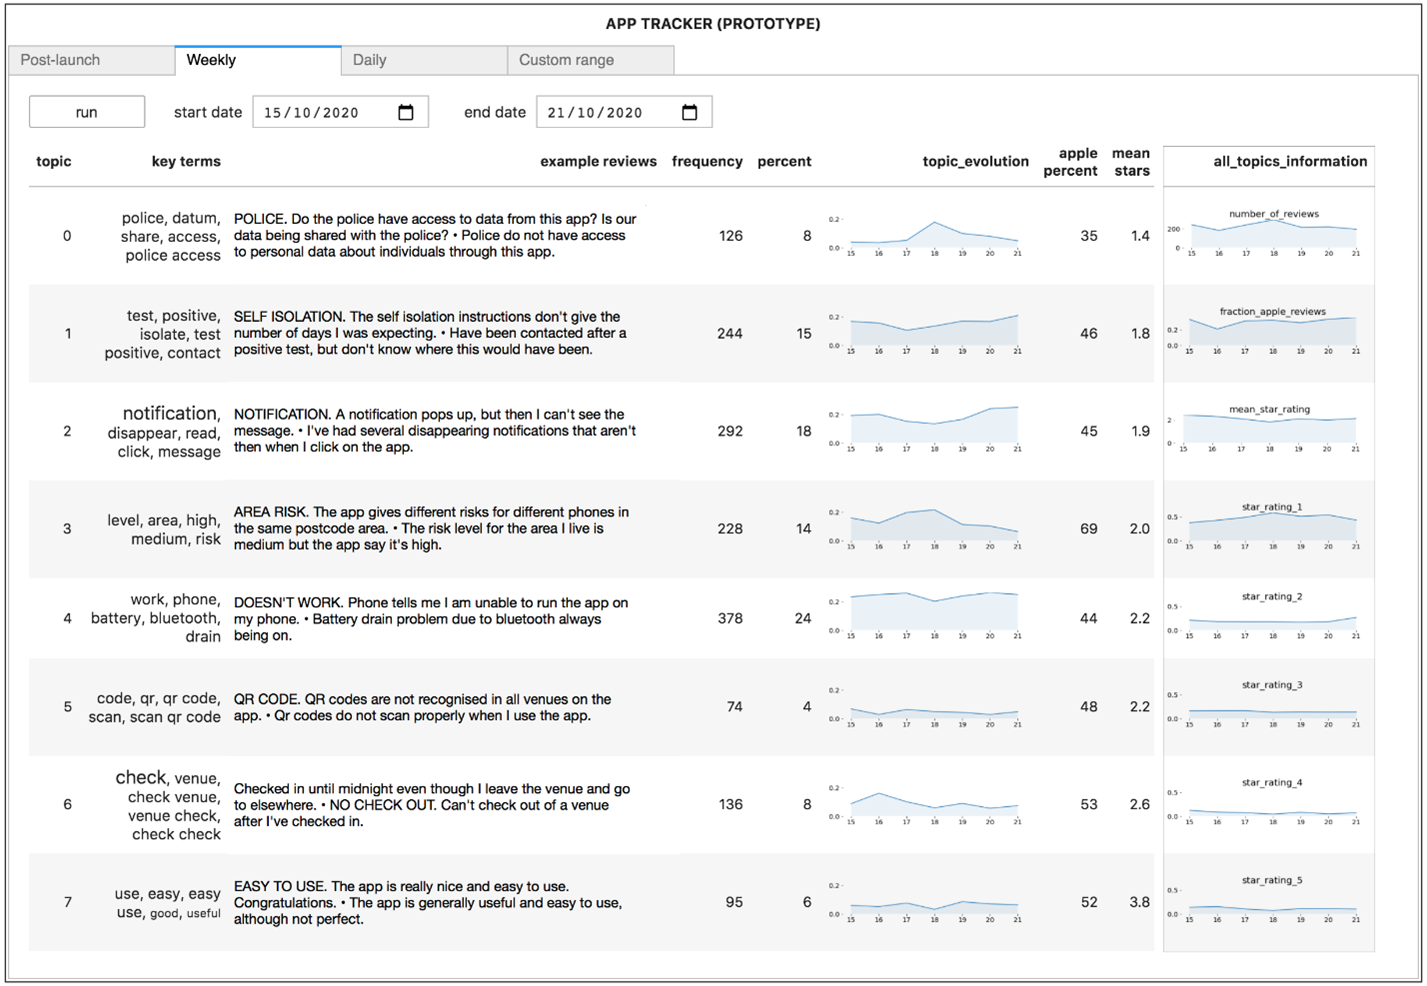
Analysis of app reviews from 15 October to 21 October 2020
Figure 3 shows a second example illustrating a more focused weekly analysis, covering 15 to 21 October 2020 (four weeks after the launch). There was a reasonable similarity to the topics found in the period in Figure 2 (as for other weekly analyses), but at the top, a new topic relating to data access is shown. The topic evolution graph for this topic, together with adjacent weekly analyses, suggest this topic appeared and disappeared quickly. A daily topic analysis on 18 October (of around 300 reviews), in the middle of this period, identified the same topic, suggesting that emerging issues might be picked up in real-time through daily analysis.
Figure 3: Analysis of app reviews from 15 to 21 October 2020
Trends in review numbers from 1 October 2020 to 20 January 2021
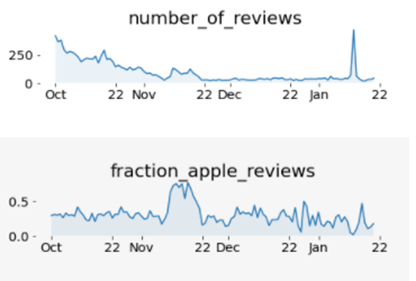
Overall trends in review numbers for the extended period 1 October 2020 to 20 January 2021 are shown in Figure 4. The number of reviews continued to drop after the end of October, from around 120 to a baseline of approximately 30 per day, with two interruptions. Firstly, there was an increase in reviews during the period 9 to 20 November, to around 100 per day. This was apparently associated with a software update on the Apple platform (“fraction_apple_reviews” was higher). Secondly, there was a one day spike in reviews on 13 January to around 400 per day, apparently associated with the Google platform (“fraction_apple_reviews” was close to 0).
Figure 4: Trends in review numbers from 1 October 2020 to 20 January 2021
Longer term trends in topics, for example a drop in the phantom notification issue after the end of October (not shown), may be more difficult to interpret. This difficulty may relate to lower numbers of reviews over time, the distance in time from product launch, possible conflation of topics over time, or new issues swamping the small baseline number of reviews. The issue of topic changes over time is further discussed in the Topic modelling details section.
4. Knowledge transfer
A prototype was applied to the pre-release version of the app prior to its release on 24 September 2020, and immediately after the official launch. The outputs were shared with NHS Test and Trace to support identification of issues arising in its initial deployment. Data underlying the prototype were subsequently made available to the NHS Test and Trace for their own analysis and use, including for evaluation work on the app. Outline infrastructure information and example code for retrieving app reviews were also available for further use within NHS Test and Trace if required. Presentation of the NHS Test and Trace evaluation work within the wider Test and Trace system, as well as to the Health and Safety Executive and Joint Biosecurity Centre, gave wider exposure to the data science methods used.
5. Notes and caveats
The results reported are prototype outputs designed to demonstrate methods suitable for the analysis of app reviews. Topic modelling is considered to be an experimental technique because there is no standard analysis pipeline for topic modelling, and because the interpretation and assessment of topic modelling output is subjective (see point 4 in the References details section).
Care is also needed when interpreting the outputs. The mean review star rating in the “all_topics_information” column of Figure 2 appears to be low and decreasing over time. However, the star rating reported in the app stores at the end of October 2020 was greater than 4 stars. This may be because of changes in the characteristics of the daily reviews or reviewers, the influence of star only reviews, or the algorithm being used to calculate star rating. Limiting reviews to those with at least 50 characters may have been another influencing factor. The reason for the small number of Apple reviews compared with Google reviews at app launch on 24 September (Figure 2) is unclear but is not thought to affect the validity of the overall method.
6. Google Cloud Platform
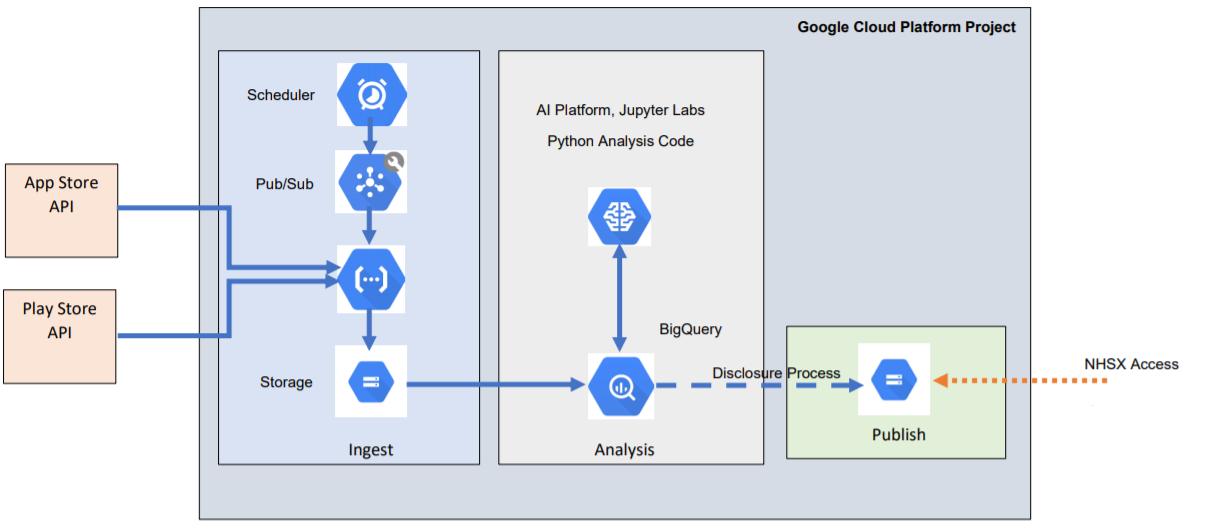
The Google Cloud Platform project was used to collect, store, analyse and share the data for this work. An overview of the architecture is shown in Figure 5 and the cloud-native services used are listed in the Description of cloud-native components section.
An automated pipeline was used to automatically collect the review data and make them available to analysts in BigQuery. Cloud schedulers triggered a Cloud Function every two hours that would download the available reviews from the relevant Google Play and Apple App store application programming interface (API) endpoints. The returned data were extracted into a CSV format and saved into a Cloud Storage bucket. This was used to UPSERT into the tables in BigQuery that held all the reviews. This created an automatically updating dataset that was able to quickly collate reviews and present them in an easily queried format for users.
Data scientists with the appropriate roles could query the BigQuery tables into Vertex AI Workbench AI Notebooks running JupyterLab, where they could perform analysis. Outputs were reviewed and went through a disclosure process before being moved to an output Cloud Storage bucket, where they could be viewed by authorised collaborators. The system was designed and implemented using the National Cyber Security Centre cloud security principles as a guide.
Figure 5: Cloud-native tools used to enable an automated scheduled ingest of data, and subsequent analysis and sharing
7. Description of cloud-native components
Ingest
Main tasks
- Automates the collection of reviews from the App Store and Play Store APIs on a given schedule.
- Saves raw JSON files to storage.
- Processes raw JSON files to create a flat CSV file, which is saved to storage.
- Ingests the CSV file to a temporary table in BigQuery.
- A separate table for each operating system (OS) is used to UPSERT the main review table for each OS, ensuring that any new reviews are added, and any updated information is captured.
- Saves intermediate steps to storage, meaning that the data can be retrieved and reprocessed in case of error.
Cloud-native tools used:
- Scheduler Pub
- Sub Cloud Functions
- BigQuery Storage
Analysis
Main tasks
- Users can open Jupyter Lab notebooks through the Vertex AI Workbench Platform.
- Reviews can be read from the ingest tables in BigQuery.
- Any outputs can be stored in work in progress tables and review tables.
Cloud-native tools used:
- BigQuery
- AI Platform
- Notebooks
Outputs
Main tasks
- Outputs that have been reviewed and been through disclosure checking can be moved to a specific published storage bucket, where approved external users can download files.
Cloud-native tools used:
- Storage
8. Topic modelling
Topic modelling pre-processing used the Python spaCy library and its “small English” model for tokenisation, stop word removal, and lemmatisation. The sklearn term frequency-inverse document frequency (TF-IDF) library was also used for ngram (term) creation (unigrams, bigrams, trigrams), vectorisation, and term weighting. Where reviews were updated or duplicated, only the latest reviews were retained.
The topic modelling proper used the Python sklearn non-negative matrix factorisation (NMF) topic modelling library. The number of topics was chosen experimentally, and subjectively, so that there were not too few topics (leading to missed issues) and not too many topics (leading to repeated issues, or creating too many issues to easily comprehend).
Time complicates topic modelling, as topics may change, be created or destroyed, while these analyses assume, for exploration purposes, a single topic model for each period covered. Possible solutions investigated included identifying emerging topics by comparing correlations between successive topic model vectors or by identifying emerging terms (using a percentage increase metric) and associating these with the topic vectors (see points 1, 2, and 3 in the References details section).
The number of reviews over time is heavily weighted towards the first days after product launch, and so may be less representative of later topics. Later topics will be relying on far fewer reviews. One solution explored was to set a maximum to the number of reviews analysed per day. However, this is not necessarily a “better” option.
Automated or manual topic labelling can be attempted. In this case, no attempt was made to assign topic labels; instead users conceptualised the topics themselves.
9. References
- Vayansky I and Kumar SAP (2020), ‘A review of topic modelling methods’, Information Systems, Volume 94, December 2020
- Blei DM and Lafferty JD (2006), ‘Dynamic topic models’, ICML ’06: Proceedings of the 23rd international conference on Machine learning, June 2006, pages 113 to 120
- Wang X and McCallum A (2006), ‘Topics over time: a non-Markov continuous-time model of topical trends’, KDD ’06: Proceedings of the 12th ACM SIGKDD international conference on Knowledge discovery and data mining, August 2006, pages 424 to 433
- Sievert C. and Shirley K.E. (2014). ‘LDAvis: A method for visualizing and interpreting topics (PDF, 780KB)’. Proceedings of the Workshop on Interactive Language Learning, Visualization, and Interfaces, pages 63 to 70, Baltimore, Maryland, USA, June 27, 2014
Team members
Data science: Bernard Peat and Dan Shiloh
Data engineering: Dan Melluish and David Pugh