Faster indicators of UK economic activity

The Faster indicators of UK economic activity project, led by the Data Science Campus at the Office for National Statistics (ONS) is an innovative response to the challenge of producing faster economic information. This article summarises our work so far. The goals of the project are to:
- identify close-to-real-time big data and administrative datasets, which represent useful economic concepts
- create a set of indicators that allow early identification of large economic changes
- provide insight into economic activity, at a level of timeliness and granularity not currently possible with official economic statistics.
This article summarises the initial work we have carried out, exploring 3 datasets: HM Revenue and Customs (HMRC) Value Added Tax (VAT) returns, Ship tracking data from automated identification systems (AIS) and Road traffic sensor data for England.
We publish this work as a monthly research output. The first report was published on 15 April 2019 and you can find the latest release and data on the ONS website.
18 March 2019
1. Motivation
The appetite for faster information on UK economic activity has never been higher. Policymakers and analysts demand faster insight into the state of the UK economy in order to make informed, timely decisions on matters, such as the setting of interest rates, which affect the whole UK.
This was noted in the Independent Review of UK Economic Statistics (Bean, 2016), which stated that “the longer a decision-maker has to wait for the statistics, the less useful are they likely to be”.
With the growing availability of big data and large administrative datasets, and the tools, technology and skills to understand and process these, National Statistics Institutes are being challenged to produce outputs that meet the growing demand for more timely data.
It is important to note that we are not attempting to forecast or predict gross domestic product (GDP) or other headline economic statistics here, and the indicators should not be interpreted in this way. Rather, by exploring big, closer-to-real-time datasets of activity likely to have an impact on the economy, we provide an early picture of a range of activities that supplement official economic statistics and may aid economic and monetary policymakers and analysts in interpreting the economic situation.
Although some of the indicators we have developed track GDP and other economic statistics relatively well over some periods, there is sufficient difference that none should be used to predict GDP on their own. Rather, they should be considered early warning indicators providing timely insight into real activities in the economy, and their potential impact on headline GDP should be carefully interpreted. It may be that these indicators have the power to improve the performance of nowcasting or forecasting models, as components of these models, but we have not as yet tested this.
We are now publishing regular, monthly updates, as research outputs using the most recent available data. We welcome feedback on this work.
A full description of the data, methodology and economic analysis, describing the time series, and the full datasets, can be found in the following articles:
- Faster indicators of UK economic activity: Value Added Tax returns
- Faster indicators of UK economic activity: shipping
- Faster indicators of UK economic activity: road traffic in England
- Faster indicators of UK economic activity: dataset (xlsx, 469kb)
Section 2 outlines the data sources and methodology used to construct our new indicators. Key findings are presented in Section 3. In Section 4, we present our proposals for regular publication, including our proposed publication schedule. Finally, in Section 5, we suggest some future work for the project.
This work is the first output from the project. As well as our proposals to extend the work on these data sources outlined in Section 5, we hope also to explore additional timely big data sources to supplement this work.
The indicators
In this section, we briefly describe the data and the indicators we have constructed. The proposed timetable for publication is presented in section 4. Most of our new series will be available one month before the corresponding official GDP estimate.
HM Revenue and Customs (HMRC) Value Added Tax (VAT) returns
We have constructed several monthly and quarterly diffusion indices from turnover and expenditure VAT returns. We have produced some novel indicators tracking changes in VAT reporting behaviour. These include:
- repayments, where firms claim VAT back
- re-input returns, where initial data checks are failed and returns are re-input by HMRC
- replacements, where initial returns are revised.
We have also constructed a proxy for firm births, based on new VAT reporters. Where possible, we have also created industry breakdowns of the new series.
Turnover diffusion indicators are available from 2008. Expenditure-based diffusion indicators are available from 2013, and indices of reporting behavior are available from 2007.
The diffusion indicators track firm turnover and expenditure growth, both important components of the economy. We explore whether VAT reporting behaviour changes under conditions of economic stress. For example, we might expect that during an economic downturn, turnover will be lower, and more firms might apply for VAT repayments. Figure 1 shows that the VAT turnover index does indeed capture the last recession quite well, but is less good at tracking small changes in GDP during periods of greater stability.
A full description of the data, methodology and analysis of the VAT indicators is presented in ‘Faster indicators of UK economic activity: Value Added Tax returns’.
Quarterly and monthly indicators will be available one month (v1)before the official GDP estimate. A second “vintage” of the monthly diffusion indices (v2), taking advantage of increased numbers of returns, which is therefore potentially more robust, will be available in the same month as GDP.
Figure 1: GDP quarter-on-quarter growth rates (current prices) and the VAT turnover diffusion index, both seasonally adjusted.
2. Ship tracking data
The automatic identification system (AIS) tracks ship location every few seconds whilst the ship is moving and every couple of minutes whilst it is in port. AIS is compulsory for all ships above 300 gross tonnes, and all passenger ships, and it is used voluntarily by many other vessels. In this work, we analyse two years of AIS data (July 2016 to August 2018) for UK ports, obtained from the Maritime and Coastguard Agency. A full description and analysis of this is presented in ‘Faster indicators of UK economic activity: shipping’. We also currently have access to real-time data from ORBCOMM, via the United Nations Global Platform.
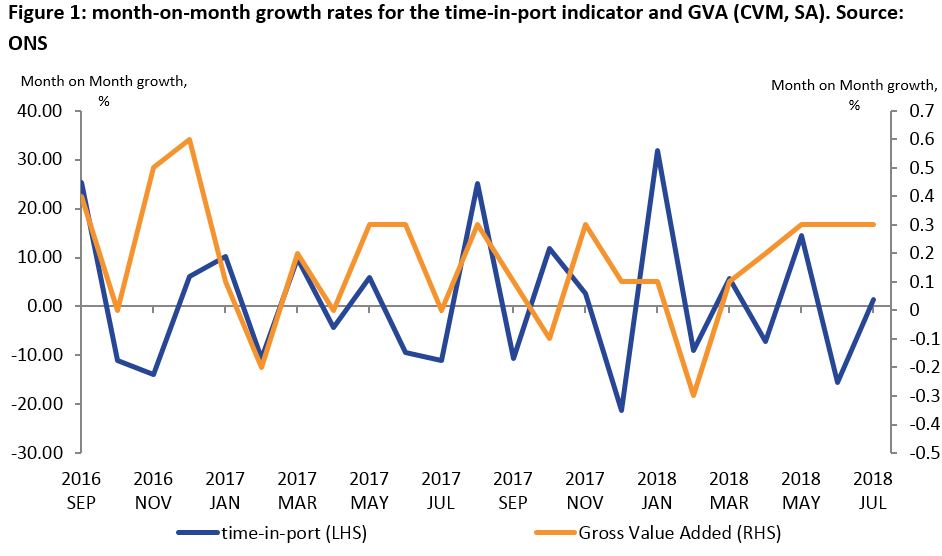
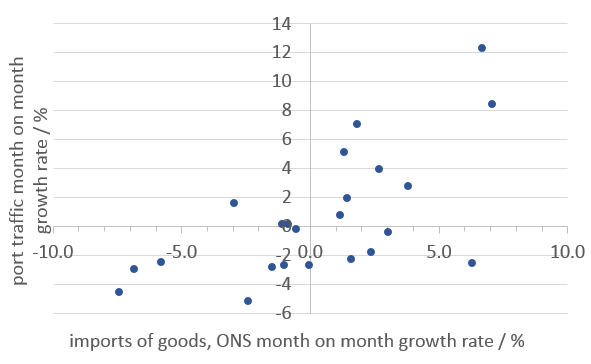
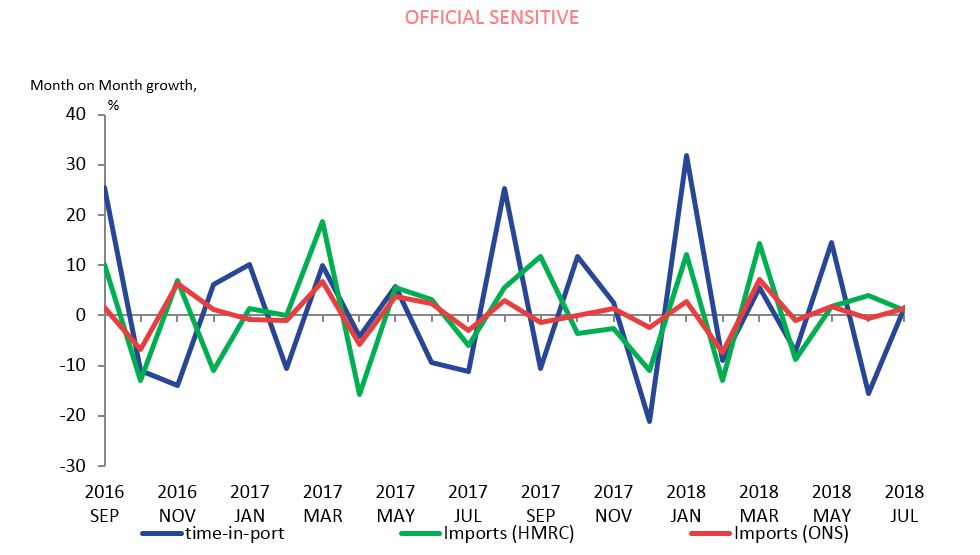
We use the data to construct monthly indicators of the time spent in port by ships, and the frequency of visits to ports, for the 10 largest ports in the UK. These indicators are likely to be important in supplementing our understanding of international trade activity. They offer a fast indication of the level of shipping activity, which is, as we show, related to trade in goods, by individual port. We compare data for July 2016 to August 2018 to official statistics for gross value added (GVA) and trade statistics. We find a surprisingly good correlation between the shipping indicators and imports, particularly given the noisy nature of these variables. The Pearson correlation coefficient for the port traffic indicator and estimates of the import of trade in goods is 0.64. However, care must be taken in the interpretation. We do not have a sufficiently long time series to be able to seasonally adjust it and this is likely to have an impact on the correlation. Furthermore, as we see in Figure 2, although the overall correlation is reasonably good, individual points can deviate strongly. For these reasons, we do not recommend interpreting these indicators on their own as predictors of GDP or other headline economic statistics, although they do offer a fast indication of the level of shipping activity, which is, as we show, related to trade in goods, by individual port.
The relationships between port traffic and international trade in goods could potentially be used in a mathematical model in combination with other indicators to estimate trends in trade. Given the fact that AIS can be obtained in timely fashion, in fact in near real time, the output of such a model can be a valuable tool for early economic trend discovery.
These monthly indicators will be available one month in advance of official GDP estimates.
Figure 2: scatter plot showing the relationship between port traffic growth rates (%) and the ONS estimates of imports of goods (%).
Road traffic data for England
We have used road traffic count data for England, from January 2007 to December 2018, published by Highways England to construct monthly indicators of average traffic counts and average traffic speeds for the whole of England and 13 main English ports.
Understanding road traffic is clearly important for understanding domestic and international trade in goods in the UK economy. Our new indicators offer the opportunity to do this in a timely way, and for localised geographies. Furthermore, they also have the scope to offer a new understanding of the supply potential of the UK, and how traffic by different types of vehicle relate to local economic activity involving the transport of goods and people. Traffic activity around ports is of particular interest, as this may offer further insight into understanding the potential impacts of delays on trade and other economic activity.
We find that the road traffic counts give us some interesting insights into road transport in England. Although correlations are weak, the average traffic counts for the largest vehicles are consistent with at least some economic events (the financial crisis), and the trend broadly follows that of headline official economic statistics, although care must be taken with interpretation. As we see in Figure 3, there is not a strong relationship between road traffic counts and GVA, and there is a large scatter. For this reason, we do not recommend interpreting these indicators as predictors of GDP or other headline economic statistics.
A full description and analysis of this is presented in ‘Faster indicators of UK economic activity: road traffic in England’.
The indicators will be available in the same month as official GDP estimates, although we will investigate whether we can access the data faster, and reduce this time lag to one month.
Figure 3: all England average traffic counts for vehicles greater than 11.66 m in length (heavy goods vehicles) and the volume measure of GVA, seasonally adjusted growth rates, July 2017 to November 2018, showing a large scatter in the relationship, which is weak.
3. Main findings
We have successfully identified a range of big data and administrative datasets, which have allowed us to construct useful, faster indicators of some types of economic activity. We have shown these are able to identify large changes to economic activity, and they may be used to provide insights to supplement and precede official economic statistics. However, some care should be used in interpreting the indicators, and they should not be considered a proxy for gross domestic product (GDP).
- The Value Added Tax (VAT) turnover diffusion index successfully identifies the 2008 to 2009 recession but is less good at tracking small changes in GDP during times of stability, and there are some false signals. We recommend caution in interpreting the indices.
- We note again that, as we have at most only one recession to compare our indicators to, we do not know how they will fare in any future downturn.
- Using the VAT quarter-on-quarter turnover diffusion index, we would have identified the first quarter of the last recession five months before it was seen in official estimates, but we note that both the GDP publication and methodology have undergone improvement since that time, and this may not be the case in any future downturns.
- The novel VAT indicators, based on reporting type, show significantly different activity occurring during the last recession, likely because economic stress had an impact on reporting behaviour. However, we note that any future economic shock might not result in the same changed behaviours.
- We find a surprisingly good correlation between the shipping indicators and international trade in goods, particularly given the noisy nature of these variables. However, care must be taken in the interpretation. We do not have a sufficiently long time series to be able to seasonally adjust it, so correlations may be driven largely by seasonal variation. We do not recommend interpreting these indicators on their own as predictors of GDP or other headline economic statistics, although they do offer a fast indication of the level of shipping activity, which is, as we show, related to trade in goods, by individual port, and they could potentially be used a component in more complex mathematical models.
- We find that the road traffic counts give us some interesting insights into road transport in England. Although correlations are weak, the average traffic counts for the largest vehicles are consistent with at least some economic events (the financial crisis), and the trend broadly follows that of headline official economic statistics, although care must be taken with interpretation. They also have the scope to offer a new understanding of the supply potential of the UK, and how traffic by different types of vehicle relate to local economic activity involving the transport of goods and people.
4. Proposed publication schedule and presentation
Figure 4 shows the proposed publication schedule. Most of the majority of the new indicators are available one month in advance of official gross domestic product (GDP) estimates. The first publication is planned for mid-April 2019, with an article setting out the full set of faster indicators of UK economic activity (covering those based on VAT returns, road traffic data and shipping) and the format of the publication to be released in advance.
Figure 4: Proposed timetable for publication. The rows refer to the month of publication, and the columns the latest reference period for the new series.
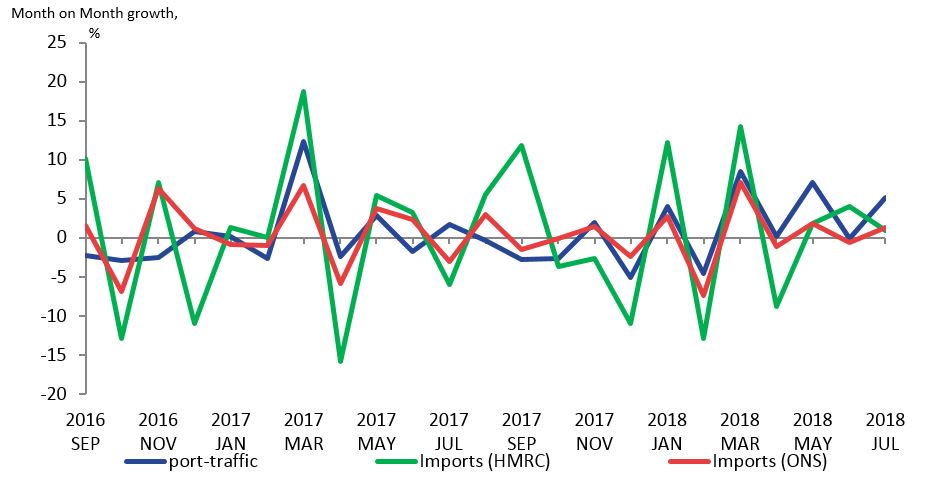
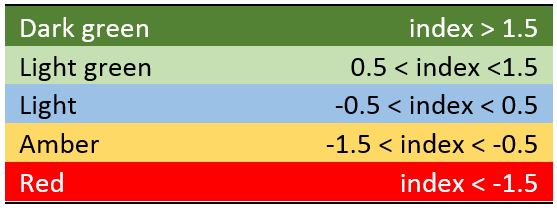
Figure 5 presents the heatmap we propose as the headline output for the new indicators, shown for the VAT turnover diffusion indices. The colour scheme is defined in Table 1. The bands are derived from standard deviations from the mean of the diffusion indices, but it should be noted that i. the data are not normally distributed and ii. the thresholds have been set based on visual inspection of the data. We will continue to monitor the suitability of these bands as new data is added.
We intend to add other indicators to the heatmap, which may then act as a warning panel for the economy: one amber square in a period may not be too much of a cause for concern, but a full set of red squares might require further investigation. White denotes where no data are available. We also plan to make the time series available at the same time as the heatmap in the regular publication. The data for the indicators presented in Figure 5 can be found in the ‘Faster indicators of UK economic activity: dataset’.
Figure 5: proposed headline presentation of the VAT indicators. The right-hand column shows when data would next be available.
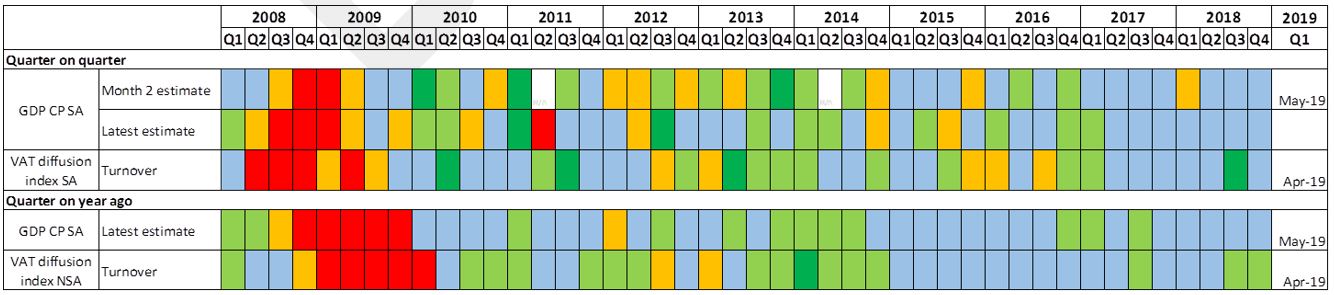
Table 1: The thresholds for the colour bands for the heatmap in Figure 5. These are based on standard deviations from the mean of the diffusion indices. The ranges are listed in the table. See Section 4 for more details.
Future work
We anticipate our first regular monthly publication using the most up-to-date data to be published in mid-April 2019.
Some potential areas for future work include:
- developing interactive maps and visualisations, to allow users to explore this rich dataset in more detail, and linking the road traffic data to the new shipping indicators by port, as a potential indicator of how goods are moved around the country
- exploring the availability of road traffic data for Wales, Scotland and Northern Ireland
- linking the shipping indicators to port freight information, to better understand the movement of goods into and out of the UK
- linking the automatic identification system (AIS) data to ship identities, so we can separate freight ships out of the data
- linking the Value Added Tax (VAT) data to the Inter-Departmental Business Register, to allow breakdowns by firm size, and more robust industry classification
- investigating weighting the VAT diffusion indices, possibly by gross value added (GVA), so the indices better reflect the structure of the economy
- developing an indicator for late VAT reporting, as a measure of economic stress
- exploring access to other big datasets, which could be used to develop indicators on other aspects of the economy.
We welcome feedback on this work, which can be addressed to: Faster.Indicators@ons.gov.uk.
5 comments on “Faster indicators of UK economic activity”
Comments are closed.
Brilliant news.
It shows the ONS is becoming even more relevant today. With the proposed improvements it also further demonstrates that the ONS will continue to be providing really helpful information from the mass of available data.
Well done ONS!
Agree with Nicholas here.
ONS is a wonderful resource, and the new proposals will help many industries with having this information/data to hand.
In Figure 3, July 20017 is a typo. Great article.
Hi Joseph. Glad you enjoyed the article! Thanks for flagging the typo. This has been amended now. Gareth
An awful lot of information here. I am a bear of very little brain and long words bother me. Once numbers get above 1000 I start to lose interest.