Faster indicators of UK economic activity: Value Added Tax returns

The Independent Review of UK Economic Statistics (Bean, 2016) stated that “the longer a decision-maker has to wait for the statistics, the less useful are they likely to be”. Faster indicators of economic activity help inform policy-makers such as HM Treasury and the Monetary Policy Committee of the Bank of England to develop more timely policy responses to economic changes.
The Faster indicators of UK economic activity project, led by the Data Science Campus at the Office for National Statistics is a response to this challenge. Its goals are to:
- identify close-to-real-time big data or administrative data sources, which represent useful economic concepts
- create a set of indicators, which allow early identification of large economic changes
- provide insight into economic activity, at a level of timeliness and granularity not currently possible with official economic statistics
In this project, we have initially explored 3 datasets: HM Revenue and Customs (HMRC) Value Added Tax (VAT) returns, ship tracking data from automated identification systems (AIS), and road traffic sensor data for England. This paper focuses on the indicators that have been developed from HMRC VAT returns. Information on the other indicators describing the time series up until the end of December 2018, and the full dataset, can be found in the following publications:
- Faster indicators of UK economic activity: summary
- Faster indicators of UK economic activity: shipping
- Faster indicators of UK economic activity: road traffic in England
- Faster indicators of UK economic activity: dataset (xlsx, 469kb)
It is important to note that we are not attempting to forecast or anticipate official gross domestic product (GDP) estimates or other headline economic statistics here, and the indicators should not be interpreted in this way. Rather, we provide an early picture of specific economic activity – in this case, derived from VAT returns – which may be of interest to policy-makers. It may be that these indicators have the power to improve the performance of nowcasting or forecasting models, as components of these models, but we have not as yet tested this.
The VAT returns may be used to construct a range of indicators, and the different indicators are likely to reflect different types of economic behaviour, and different components of the economy. The different indicators may therefore be more informative at different times – there is no single ‘best’ indicator. We have developed indicators assessing changes in firms’ turnover and expenditure, and also additional innovative indicators which track changes in reporting behaviour over time, such as in the number of new reporters and the number of VAT forms which have been re-input or replaced. Changes to reporting behaviour may reflect changes in the economic climate, such as increased economic stress.
Table 1 shows the range of indicators we plan to publish, and our proposed publication timings. They have the potential to be available on a timelier basis than official estimates of gross domestic product (GDP). Estimates that are published within one month of the end of the reporting period are named M1 and estimates available within two months of the end of the reporting period are named M2.
Table 1: List of proposed VAT-based indicators, and their availability for publication
| Indices | Publication timings | |
| Monthly | Diffusion indices for turnover and expenditure | Within one month of the end of the reporting period for certain industries, with an updated version including other industries available within two months of the end of the reporting period |
| New reporters | Within one month of the end of the reporting period | |
| Record type indicators | Within one month of the end of the reporting period | |
| Quarterly | Diffusion indices for turnover and expenditure | Within one month of the end of the reporting period |
The particular strengths of the VAT indicators and the data we have used to construct them include:
- the indicators are generally available within a month of the end of the reporting period
- HMRC can issue penalties to firms that report errors on VAT returns and the data is subject to various validation checks making the data more likely to be accurate. Therefore the indicators built on these data are unlikely to reflect changes only in sentiment
- the indicators record the behaviour of a large number of firms. For example, there are usually over 250,000 firms contributing towards to the M1 quarterly diffusion index for turnover
- we have developed a wide range of indicators covering turnover, expenditure and reporting behaviour
- the size of the dataset means we can provide high levels of granularity, particularly into the behaviour of different industries
- turnover and expenditure are fundamental economic concepts, so we expect the indicators to be very relevant for economic analysis.
Our main findings from analysis of these indicators are as follows.
- The indicators show promise for indicating large changes in the economy quickly, so there may be potential in being able to identify signals around turning points in closer to real time. There are some false steers and they are less good at identifying smaller changes so care is needed with interpretation.
- The turnover diffusion indices show similar trends to the latest version of current price GDP growth in 2008 to 2009. Furthermore, the quarter-on-quarter (QonQ) diffusion index would have indicated a potential downturn in the economy five months before the official GDP publication first recorded negative current price quarter on quarter growth (although we note that, since 2008, both the publication of GDP and its compilation have been improved).
- The industry-level indicators are informative in understanding the behaviour of individual sectors and how this affects the overall indices. For instance, the 2015 dip in the overall turnover diffusion index is heavily influenced by agriculture. Every firm in the data currently has the same weight in the diffusion indices so certain sectors that have a large number of firms are particularly important in the overall indices.
- Measures of reporting behaviour available on a monthly basis show some relationship with economic stress. The number of new reporters of VAT data was relatively low at the start of 2009. There were also occasionally an increased number of firms reporting repayment claims, re-input or replacement returns during 2008 and 2009.
Initially, we anticipate publishing monthly indicators with a one-month lag (i.e. publishing indicators for March in April). This is one month in advance of official estimates of GDP. The first publication is planned for mid-April 2019, with an article setting out the full set of faster indicators of UK economic activity (covering those based on VAT returns, road traffic data and shipping) and the format of the publication to be released in advance. Proposed future work includes the development of interactive visualisations to allow analysts and policy-makers to easily explore these new datasets in rich detail.
In Section 1, the background to this work is discussed. The characteristics of the VAT data are described in Section 2. Section 3 discusses the methodology used to construct the indicators. Section 4 compares the historic trends in these indicators against other published economic series to provide insight on how these indicators may be useful for analysis of the UK economy in future. The historic performance of the indicators relative to other series may be different in the future and so care is needed in interpretation. Section 5 summarises the conclusions and potential further work. The data contained in this article is published in ‘Faster indicators of UK economic activity: dataset.’
We welcome feedback on this work, which can be sent to Faster.Indicators@ons.gov.uk.
1. Background
There is currently a large appetite for faster information on UK economic activity. Policy-makers and analysts demand faster insight into the state of the UK economy in order to make informed, timely decisions on matters, such as the setting of interest rates, which affect the whole UK. This was noted in the Independent Review of UK Economic Statistics (Bean, 2016), which stated that “the longer a decision-maker has to wait for the statistics, the less useful are they likely to be”.
With the growing availability of big data and large administrative datasets, and the tools, technology and skills to understand and process these, national statistics institutes are being challenged to produce innovative outputs which meet the need for more timely data. The project is part of the Office for National Statistics’ (ONS) response to this challenge.
Gross domestic product (GDP) is one of the main indicators of economic activity (see UK National Accounts – a short guide for a summary). In practice, three approaches are taken to estimate GDP: production or output, expenditure, and income. The output approach of GDP, which provides the best short-term picture of the economy because of its higher data content, is estimated as total output less intermediate consumption. That is, the output of goods and services that are produced, less the intermediate inputs used in their production. We have recently incorporated VAT turnover estimates into the National Accounts, where they are used to supplement survey data for industries covered by the Monthly Business Surveys, both for production and services, and for the construction industry.
Value Added Tax (VAT) returns capture both turnover and expenditure. Whilst these are not identical to output and intermediate consumption, and the VAT expenditure returns include capital expenditure as well as intermediate consumption, they are related for the majority of industry sectors. VAT returns are submitted by the approximately 2.2 million live VAT-registered UK traders, with a total taxable turnover of £8.2 trillion (2017 – 2018; VAT Annual Statistics). In the face of increasing demand for timelier information, we here produce and test the potential of innovative new fast indicators built from VAT returns data.
We are able to produce most of our indicators within one month of the close of the period of interest (the reference period), although two months are required to amass sufficient data to provide broad industry breakdowns for the monthly diffusion indices. This timeliness can be achieved as we choose outlier-robust methods, allowing us to use VAT returns data in their raw state, rather than relying on the more intensive processing approach that is required in producing official estimates, consistent with international conceptual and methodological standards, in the National Accounts[1].
2. Characteristics of the VAT data
Who makes VAT returns?
Generally, traders must register for VAT when their VAT taxable turnover over the previous 12 months exceeds the registration threshold, or if they expect their VAT taxable turnover to exceed this limit over the next 30 days[2].
We expect to receive VAT returns data from the vast majority of traders with turnover above that threshold, which currently stands at £85,000. Turnover from VAT exempt trade, for example betting and gaming, does not count towards the VAT taxable turnover. Traders that only have turnover from exempt goods and services are not allowed to register for VAT, although partially exempt traders, who have both exempt and non-exempt sales, can (VAT exemption). It is important to clarify here that there is a difference between exempt and zero-rated goods and services. Turnover from the latter is considered taxable, albeit at 0%, and does count towards the registration threshold.
There are exceptions to the general rules for what should be included in turnover and expenditure, notably for traders using the flat rate scheme. The flat rate scheme is intended to simplify accounting for small companies. Uptake of the scheme steadily increased from approximately 4% of VAT traders in 2004 to 2005 to a peak in 2015 to 2016 at approximately 19% of all VAT traders. However, uptake of the scheme has since decreased, potentially due to policy changes.
Flat rate traders do not subtract VAT from their flat rate turnover, although it is subtracted from any flat rate exempt turnover. Also, flat rate traders do not report most purchases, and hence often have zero expenditure, although they do report expenditure on capital assets above £2,000, acquisitions from other EU member states (this refers to a box on the VAT return that specifically asks for total value of all acquisitions of goods and related costs, excluding any VAT, from other EU member states), and reverse-charge transactions.
Timeliness of the VAT data
The deadline for submitting monthly or quarterly VAT returns is one calendar month and seven days after the end of the VAT accounting period. Annual returns are due two months after the end of the accounting period. The data are delivered to Office for National Statistics (ONS) through a secure monthly feed, which is received on the first working day of each calendar month. The ONS hold VAT turnover and expenditure data that go back to April 2001 and 2012 respectively, which are used primarily for updating the Inter-Departmental Business Register.
In this article the diffusion indices are published from 2008 and the reporting behaviour measures are published from 2007, as further research is needed into the characteristics of earlier data.
The majority of firms reporting for a monthly or quarterly period ending in March would be expected to submit returns to HM Revenue and Customs (HMRC) during April or early May. The resulting data would be transmitted to the ONS at the beginning of May or June.
Variables in the VAT returns data
Table 2 shows the VAT return variables that are received by the ONS. The goal of this research is to make the most of these variables to construct various faster indicators of economic activity in the UK. In particular, we use reported turnover and expenditure for the diffusion indices, record type to study changes in reporting behaviour, and the other variables to help to attribute the data to the correct time period or sector.
Table 2: VAT data variables used in the construction of the new indicators
| Variable | Description |
| VAT period | The closing month of the period to which the VAT return refers |
| VAT reference | A unique nine-digit identifier for each VAT trader |
| Record type | An integer used to flag six different types of returns: tax due or zero-return expected, tax repayment, re-input tax due, re-input tax repayment, replacement tax due, or replacement tax repayment. Repayment returns indicate that a repayment is due from HMRC to the trader. Re-input returns are those that fail checks and are re-input by HMRC. Replacement returns are those which replace a previous acceptable return. |
| Stagger | An integer between 0 and 15 inclusive describing the reporting pattern of the VAT trader. Traders can return either monthly, quarterly or annually. Stagger zero refers to monthly returns, and staggers one to three, to quarterly returns (see Figure 1). Staggers four to fifteen refer to annual returns, but these are not used in the diffusion indices we construct in this work. |
| SIC 2007 | Standard Industrial Classification 2007 (SIC 2007) of VAT unit held by HMRC. The SIC 2007 system has been used by HMRC for this purpose since January 2008, SIC 2003 was used from around 2002 to 2003, and SIC 1992 before this. |
| Receipt date | The date on which HMRC received the VAT return. |
| Turnover | Generally, the “total value of all sales and other outputs excluding VAT”, but see exceptions that follow. |
| Expenditure | Generally, the “total value of purchases and all other inputs excluding any VAT”, but see exceptions described previously. Note it includes other expenditure in addition to intermediate consumption, most notably capital expenditure, and goods and services bought for resale without further processing. |
VAT reporting periods
As discussed previously, VAT returns refer to different reporting periods, determined by the stagger – that is, the reporting pattern of the VAT trader. We show the pattern of monthly and quarterly reporting periods in Figure 1.
Quarterly returners make up approximately 91% of the VAT trader population, of which approximately 42%, 30% and 28% are in staggers 1, 2 and 3, respectively (2017 to 2018, VAT Annual Statistics). Traders on stagger 1 have higher average turnover compared with staggers 2 and 3. According to ONS analysis, stagger 1 returners account for 56% of turnover for the entire VAT population and 73% of turnover for quarterly returners. While there are fewer monthly, stagger zero VAT returners (approximately 3% of VAT traders in 2017 to 2018, VAT Annual Statistics), the same ONS analysis shows that they represent approximately 22% of turnover.
Figure 1: Calendar pattern of monthly and quarterly VAT returns
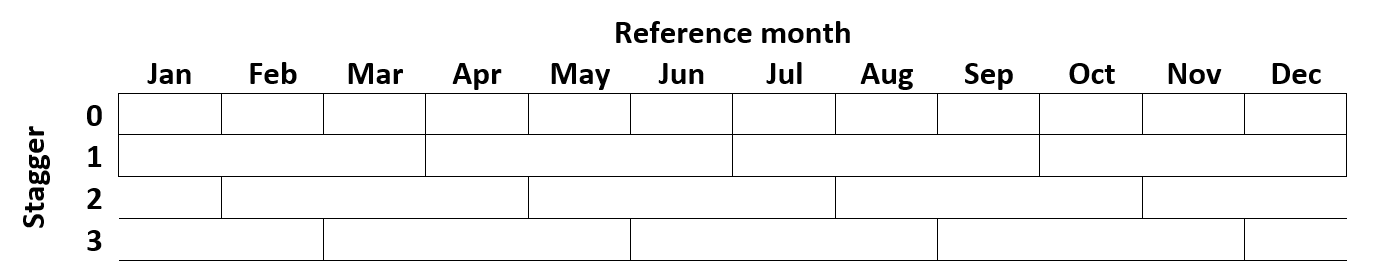
Each box in this figure corresponds to the reference period covered by an individual VAT return for a particular VAT stagger. Stagger 0 returners report monthly, staggers 1 to 3, quarterly, where stagger 1 corresponds to calendar quarters, and 2 and 3 are offset by plus one and two months, respectively.
If we combine the VAT stagger patterns with the timeliness of returns, we can calculate the approximate data-content of our diffusion indices at various points in time. We calculate these indicators for both calendar quarters and months. For quarterly indices we include monthly and quarterly VAT staggers, where the offset quarterly staggers are associated with the calendar quarter that they most overlap with. For instance, a quarter one index would include stagger 0 returns for reference periods January, February and March; stagger 1 returns for the March reference period; stagger 2, for April; and stagger 3, for February. The quarter one index would include data from approximately 330,000 firms if published in mid-April (M1 estimate), which is approximately 20% of the eventual set (averaged over 2008 to 2018, inclusive). Monthly diffusion indices are calculated from stagger 0 returns only and so may show different trends to the quarterly diffusion indices. A March monthly index would contain data from around 900 firms if published in mid-April (M1 estimate) and around 40,000 in mid-May (M2 estimate), which represent 2% and 73% of the eventual set, respectively (averaged over data from reference periods 2008 to 2018, inclusive).
There are biases in the repayment position of firms by stagger, most strikingly, the majority of stagger 0 VAT traders are in a net repayment position (VAT Annual Statistics), which, for example, could be due mainly to trading outputs that are zero-rated, such as a large number of food items. Our early exploration of the data found that approximately 80% of monthly VAT returners (stagger 0) were in a net repayment position, while the equivalent for quarterly VAT returners (staggers 1 to 3) was only 20%.
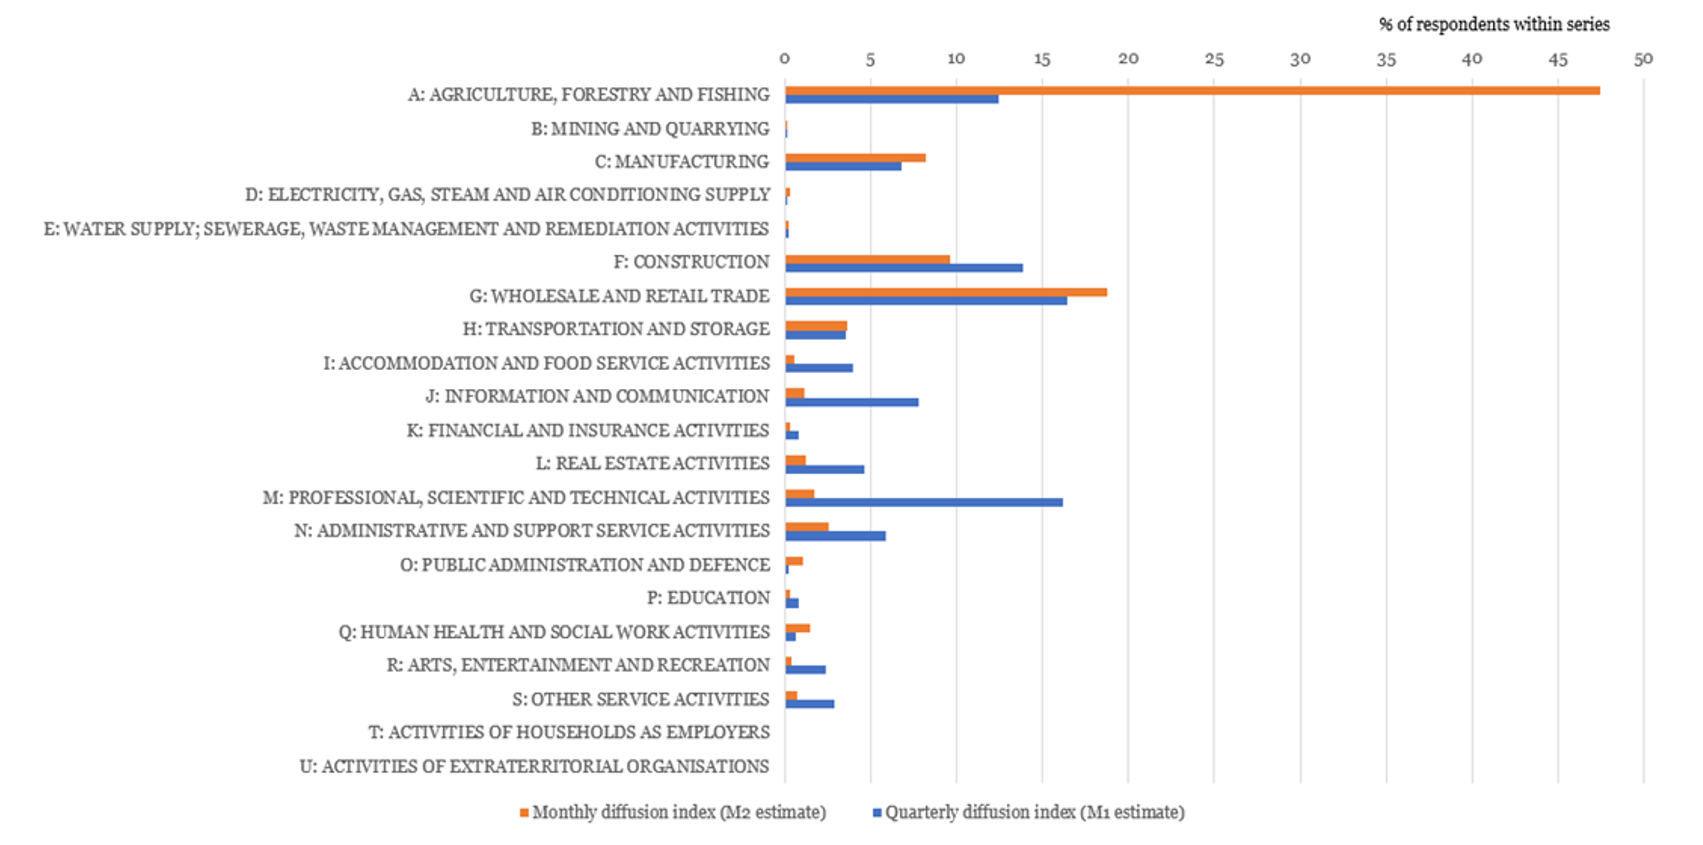
We propose to publish two estimates of the monthly diffusion indicators: monthly M1 would be available in the month following the reference period and monthly M2 a month later, e.g., mid-April and mid-May for a March reference period. A single estimate would be produced for quarterly indicators, which would be available in the month immediately following the close of the reference period, e.g., mid-April for quarter 1, and that we refer to as quarterly M1. Figure 2 shows the average contributions by industry for the monthly M2 and quarterly M1 diffusion indices, using SIC 2007 as reported in the VAT returns. The monthly returns are dominated by agriculture, forestry and fishing (section A), followed by wholesale and retail (G) and construction (F). When publishing the M1 estimates of the monthly diffusion indicators, it is only these three sectors for which there are enough returns to publish the indices.
Figure 2: SIC 2007 industries of firms contributing to monthly and quarterly turnover indices (2008 – 2018 average)
To maximise coverage and timeliness, the work presented here uses the full raw monthly delivery of VAT returns data, not the cleaned and processed data used elsewhere by the ONS. We limit ourselves to outlier-robust methods to account for the lack of data cleaning.
[1] For the purposes of the National Accounts, VAT data are matched to the IDBR, automatically adjusted using two cleaning rules, apportioned from the VAT traders to the reporting units used in ONS surveys, and temporally apportioned to produce a monthly series from the mixed frequency data, estimates are made for any reporting units that are missing in the data, and if needed, manual interventions are made to adjust any suspicious data.
[2] If a trader exceeds the threshold, it is possible to apply for an exception to registration. The trader must write to HMRC detailing why they believe that their VAT taxable turnover over the following twelve months will not exceed the deregistration threshold of £83,000. Similarly, VAT registered traders can request that HMRC cancels their registration if their annual VAT taxable turnover falls below the deregistration threshold. Furthermore, traders must cancel their VAT registration within thirty days if they cease to be eligible for VAT, if for example they stop making VAT taxable supplies.
3. Indicator methodology
Diffusion indices
In economics, diffusion indices can be used to show the proportion of firms reporting an increase in activity. They are commonly used in unofficial indicators, such as those based on business surveys. Diffusion measures can be particularly useful in identifying major turning points (for example, during an economic recession) but can provide less information in normal and stable times.
For our Value Added Tax (VAT) diffusion indices, we measure changes in economic activity across a broad cross-section of firms, not just the largest. As such, each firm is weighted equally in the index, regardless of its size – that is, the measure is democratic rather than plutocratic. A diffusion index signals a contraction when a majority of firms report a decline in activity over a given period, but if there are sufficient large firms growing in the same period to counteract this, that contraction may not be reflected in official estimates of gross domestic product (GDP).
We have produced diffusion indices for the following breakdowns:
- quarterly and monthly
- turnover and expenditure
- period-on-period (seasonally adjusted) and period on same period a year ago
- different “vintages” representing how long after the reporting period the index is calculated
- industry.
For each of these dimensions, the process is broadly the same, as outlined in the following steps:
Step 1: filter the data
The diffusion indices only consider monthly and quarterly VAT reporters, and annual returners are discarded. We also discard records that we deem to be invalid, for example, if no reporting period is provided, or if the period and stagger combination reported is not possible (for example, a period indicating that the return applies from Dec to Feb, but a stagger indicating that the return applies from Jan to Mar).
Step 2: assign quarterly returns to calendar quarters
Firms that submit returns for quarterly reference periods can report on three possible staggers. One of these staggers matches with calendar quarters, but the other two do not. To simplify our index, we make the assumption that for off-calendar staggers, these returns apply to the calendar quarter in which two of the three months fall. For example, if a firm reports from Dec to Feb, we count the return in the quarter 1 version of the index. Similarly, if a firm reports from Feb to Apr, they are also counted in quarter 1.
Step 3: determine lagged turnover and expenditure values
To construct the diffusion indices, we need both the value of turnover or expenditure for the reference period, and for the period with which it will be compared (the lagged value). For example, for a month-on-month index for January, we need turnover and expenditure values for both January and December of the preceding year. Therefore, the index only includes firms that reported in both periods.
Importantly, when calculating the indices, we only consider returns that would have been available at the time – we do not consider late returns or amendments. For example, when we calculate the M1 estimate of quarter 1 2008, we only consider returns that would have been available to the ONS in early April 2008. In the event of a firm making multiple returns for the same period, we retain the latest available at the time and drop the others.
For the monthly version of the indices, only firms that report monthly are considered, so the calculation is trivial. We simply look up the 1-month or 12-month lagged values for each firm, depending on the index version, and if no such value exists in one or both of those periods, the firm is not included in the index.
For the quarterly version, we include four possible combinations of firm returns.
- A quarterly lagged return to a quarterly current return. For example, firm A reports £100 for quarter 1 2015, and £200 for quarter 1 2016, so for the quarter 1 2016 index, they count as growing. In this category, firms must have the same stagger type in both the current and lagged periods, or else they are discarded (we do not compare Dec to Feb to Jan to Mar, for example).
- A monthly lagged return to a monthly current return. Monthly returns are summed over the quarter. For example, if we are calculating the quarter 1 2016 index, for a monthly reporter we would sum Jan to Mar 2015, and compare that with the sum of Jan to Mar 2016. There are a few variants on this:
- if not all months of the quarter are available in the current quarter, we compare the total with the equivalent months in the lagged quarter (for example if we only have Jan and Feb returns, we compare the sum of Jan and Feb 2015 with Jan and Feb 2016); these returns are counted as equal to a complete return
- however, if there are gaps in the returns that make the current and lagged periods inconsistent then the return is discarded in the index; for example, if we are missing a Feb return in 2015, we discard it
- Firms that switched reporting from monthly to quarterly. The sum of the monthly returns is compared with the quarterly return. We compare equivalent months for firms that switch to off-calendar staggers. For example, if a firm now reports on stagger 3 (Dec to Feb), we compare the sum of the months Dec to Feb in the lagged period.
- Firms that switched reporting from quarterly to monthly. The quarterly returns are compared with the sum of the current, equivalent monthly returns. If we do not have a complete set of equivalent monthly returns, the firm is discarded in the index. For example, if a firm previously reported on stagger 2 (Feb to Apr), we compare this return to the sum of the months Feb to Apr in the current period. If we don’t have an April return yet, the firm is discarded.
Step 4: flag growth
Once we have reduced the data to firms that have valid returns for both the reference period and the lagged period, we assign them to one of four categories:
- value increased compared with lagged period (growth)
- value decreased compared with lagged period (decline)
- value in the current period identical to lagged period (no change), and value not equal to zero
- value in the current period identical to lagged period (no change), and value equal to zero
Firms in category 4 are dropped from the index.
Note that the data are unweighted, that is, the categories do not account for the size of the value change. The impact of a £1 change is equal to a £1 million change. The rationale for taking this approach is described previously.
Step 5: calculate index
Using the remaining firms, the index for each time period (t) is calculated using the following formula:
\( \)\[VAT \; diffusion \; index_t = \frac{Number \; growing_t – Number \; declining_t}{Number \; growing_t + Number \; declining_t + Number \; unchanged_t}\]
The formula ensures the indices fall in the interval [negative 1 to 1], inclusive. If all firms report an increase in the latest period relative to the base period, the index would be 1. If all firms report a decline, the index would be negative 1. If an equal number grow and decline, the index would be 0.
Seasonal adjustment is performed on the final index itself, rather than the firm-level values underlying the index. Details of the seasonal adjustment method are provided in ‘Timing and level of detail’ in section 3.
Reporting behaviour
Two indicators based on reporting behaviours of firms have also been created:
- a measure of new reporters: how many new VAT references are reported each month
- a measure of record types: how many of each of the six reporting types are reported each month.
Both the number of firms reporting particular record types and the number of new reporters over time could be affected by changes in HMRC rules and procedures, so care is needed in interpreting movements.
The initial filtering of the data is the same as that for the diffusion indices, but without filtering out annual returners or invalid period and stagger combinations.
Step 1: assign month
These reporting behaviour measures are classified by the month the data were received by HM Revenue and Customs (HMRC), which is not necessarily the same as the reference period (the period for which the VAT return is made). Therefore, in contrast to the diffusion index, these indicators have no vintages. This is because we are specifically interested in identifying aggregate changes to reporting behaviour at the time of reporting.
For a small number of returns, ONS does not receive a firm’s data until more than one month after the receipt date. These returns are removed, as they are not available at the time the indicators are constructed. The indicators are not revised when these data come in, as this would lead to an upward bias in older periods for which more data have been received. When the receipt date variable is unavailable, the assumption is that the return was made during the previous month.
Step 2: new reporters
A new reporter is defined as a firm with a VAT reference (that is, firm identification number) which has not previously reported its VAT returns. We use the VAT returns since 2001 to assess whether a firm is a new reporter but the indicator is only published for 2007 onwards.
The percentage of new reporters per month is the percentage of total unique returners (that is, unique VAT references) that were first seen in that month. The total number of firms is defined as the number of unique returners for the month. It is not uncommon for one firm to submit multiple returns over one month, for example, as a replacement return or because they are returning for different reporting periods.
Step 3: record type
Each return, by definition, has a record type in one of six categories. These are defined as:
- tax due or zero-return expected
- tax repayment claim
- re-input tax due
- re-input tax repayment
- replacement tax due
- replacement tax repayment.
Re-input returns are those that fail checks and are re-input by HMRC, replacement returns are those where a firm corrects a previous acceptable return.
The number of returns in each category is counted. As there are so few returns in the final two categories listed, and they represent similar types of activity, they have been combined in the output.
Timing and level of detail
Data vintages
Data pertaining to a particular VAT reference period are returned to HMRC periodically. Therefore, we can construct different vintages of the VAT indicators. For example, consider the quarterly diffusion estimate for the first quarter of 2019. ONS receives the first cut of data that might apply to this quarter in February 2019 (that is, monthly reporters returning for January). Each month after this, we receive more data pertaining to Quarter 1 2019. By the time we get to the beginning of April we have enough data to form a fairly representative estimate – around 20% of the eventual returns (a combination of monthly and quarterly returners). This quarterly estimate is available within a month after the end of the reporting period, and is labelled M1.
For the monthly version of the diffusion index we only use monthly reporters and we construct both a first and second vintage. The first is available in the month immediately after the end of a given month (M1 estimate), and the second is available in the next month (M2 estimate). For example, the estimates for April 2019 would be available in May (M1) and June (M2).
For the reporting behaviour measures, there are no vintages, as we are interesting in the reporting behaviour in the relevant month only.
Splitting the indicators by industry
The HMRC VAT data contains a field providing a five-digit Standard Industrial Classification (SIC) code, so we can split our headline indicators using this information. Note these codes differ from those on the ONS’ Inter-Departmental Business Register. Using the HMRC SIC field, we have broken the data down into four industry components: agriculture, forestry & fishing; production; construction and services, and 21 sectors (A to U). The industry breakdown is currently only available since 2008 as this is when the data moved to be reported on a SIC 2007 basis.
To combine diffusion indices, they need to be weighted by the number of observations, that are also published.
Seasonal adjustment
Seasonal adjustment is the process of identifying, estimating and removing seasonal and calendar related effects from a time series. Seasonal adjustment at ONS is performed using the software X-13ARIMA-SEATS. The method of seasonal adjustment used is the X-11 algorithm, which is an iterative process that decomposes an observed time series into a trend, seasonal and irregular component using a variety of different moving average filters. The X-11 algorithm is relatively robust as it includes some extreme value adjustment, but X-13ARIMA-SEATS also enables the user to perform some pre-treatment on the series, which includes adjusting for outliers and calendar related effects using a regARIMA model. In this work we have produced seasonally adjusted estimates for the month on month diffusion indices, quarter on quarter diffusion indices, new reporters indicator and record type indicators. We also publish the non-seasonally adjusted values. Initial investigations suggest less seasonality in the quarter on a year ago and month on a year ago diffusion indices although there may be calendar effects.
Avoiding identification of individual firms
Splitting the data by industry occasionally results in only a small number of firms left in the index. In cases where fewer than 15 firms have reported in a particular component or sector, we suppress the entire series. In the event where only a single series is removed, we also remove the next smallest to prevent any derivation of the suppressed series from the total.
Figures are also rounded, to prevent possible inference of exact values. The diffusion index and percentage of new reporters are rounded to two decimal places, and the number of firms for any measure is rounded to the nearest 10.
It should be noted that for some indicators although they meet these disclosure thresholds, the number of firms contributing can still be low, for instance below 100 firms, so caution is needed in interpreting the data. Future publications may choose to not show the latest data for all the indicators which have been published in this release. We are interested in the perspectives of users on the level of detail which they find useful.
4. Economic comparisons and analysis
In this section, we present comparisons of our new indicators with headline economic statistics, and explore the trade-off between early indicators, sample size and bias. We note again that our main goal is to be able to help identify large changes in economic activity and behaviour in a timely fashion, not to predict exact changes in gross domestic product (GDP).
Unlike business sentiment surveys, which can be prone to sharp movements in sentiment, such as those reported immediately following the outcome of the EU Referendum, the information recorded in VAT is a reflection of actual economic activity that has taken place.
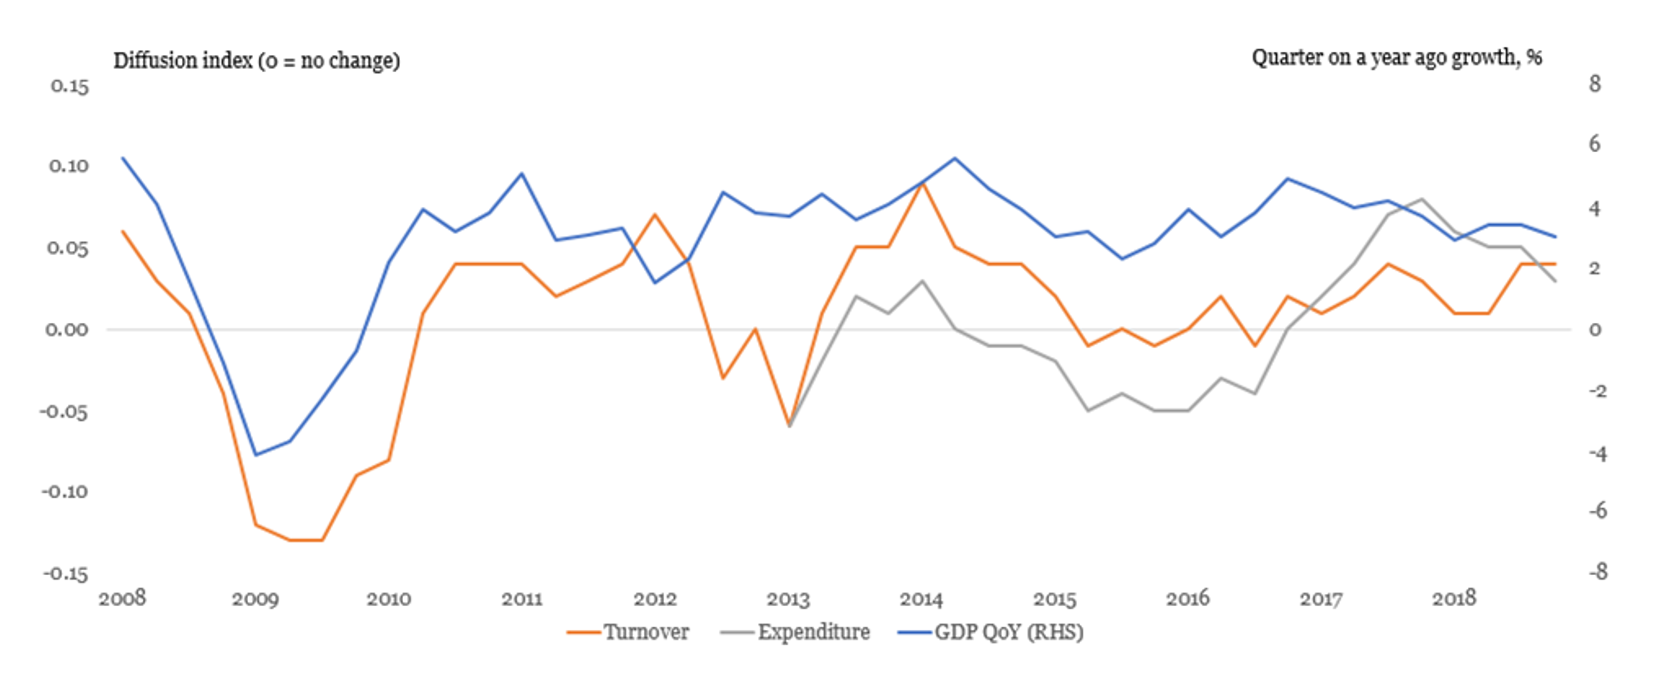
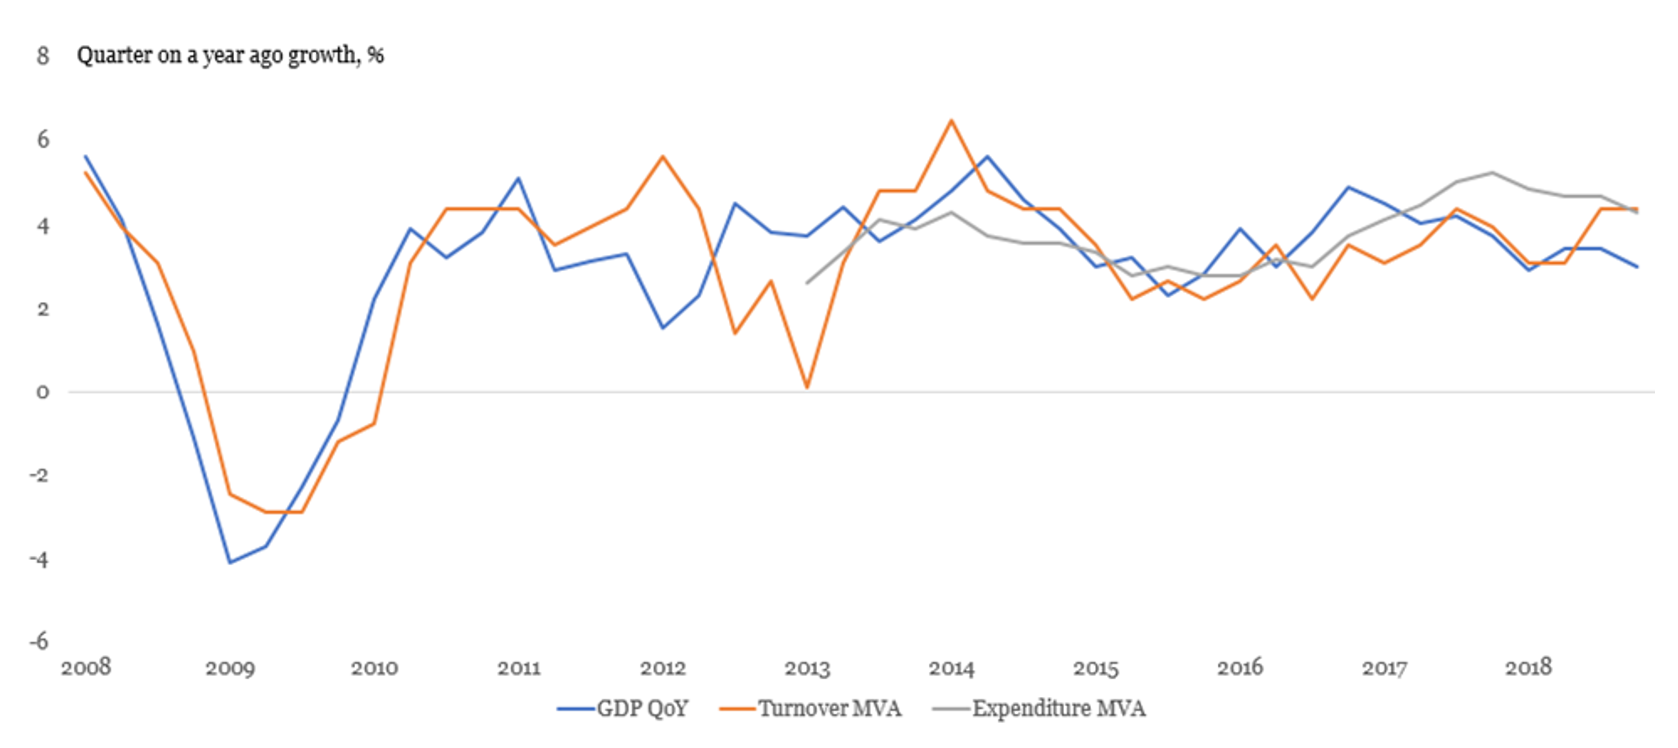
Comparison of the QonQ4 turnover diffusion index with GDP
Figure 3 shows how the growth rates of the quarter-on-a-quarter a year ago (QonQ4) turnover index compares with growth in nominal GDP over the same period. This demonstrates that there is early information in the VAT turnover diffusion index that provides an early signal of economic activity, especially where there are large changes but there are also periods which show differences. This is most evident around the time of the recession itself.
This reflects the ability of the diffusion index to potentially capture broad-based changes in activity and economic turning points. The expenditure index is also shown here from Quarter 1 (Jan to Mar) 2013, when this information is available. Expenditure data are available only from 2012 onwards, and so we cannot comment on how it would have behaved during the last recession.
Figure 3: Quarter on a year ago GDP CP seasonally adjusted (SA) vs VAT turnover and expenditure diffusion indices not seasonally adjusted (NSA)
It is clear from Figure 3 that there are some periods where the diffusion index is negative, but GDP growth is positive. Figure 4 shows this relationship in a scatter plot of the QonQ4 turnover diffusion index and official estimates of nominal GDP, together with coloured bands representing different levels of the diffusion index relative to their average level over the period 2008 to 2018. We see that:
- the recession is captured by the diffusion index: all negative periods of QonQ4 GDP growth are also negative for the diffusion index
- there is no case where the index growth is positive, but GDP growth was negative
- there are a handful of periods when GDP growth was positive, but the index was negative
- where both the diffusion index and GDP growth are positive, there is a lot of scatter.
From this, we can see that this measure has been:
- a good indicator of large negative changes to the economy
- a poor predictor of precise values of GDP
- more likely to be negative when GDP growth is positive than the other way around.
It is worth exploring the periods in the amber band (diffusion index level slightly below its mean). In these periods sometimes GDP growth was negative (2008 Q4) like the diffusion index but sometimes GDP growth was positive. One of the quarters in this band where GDP growth was positive was in 2012, and may in part be due to the effect of so-called “special events”. Recent analysis highlighted how additional Bank Holidays and the London 2012 Olympic and Paralympic Games led to an increasing volatile path of GDP.
Further work is required in interpreting this, and we suggest caution in interpreting the exact level of the diffusion indices. We also note that, although the diffusion index identified the last recession well, it is difficult to foresee what impact any future economic shocks would have on VAT returns and hence the index.
Figure 4: Quarter on a year ago GDP CP SA vs VAT turnover diffusion index NSA
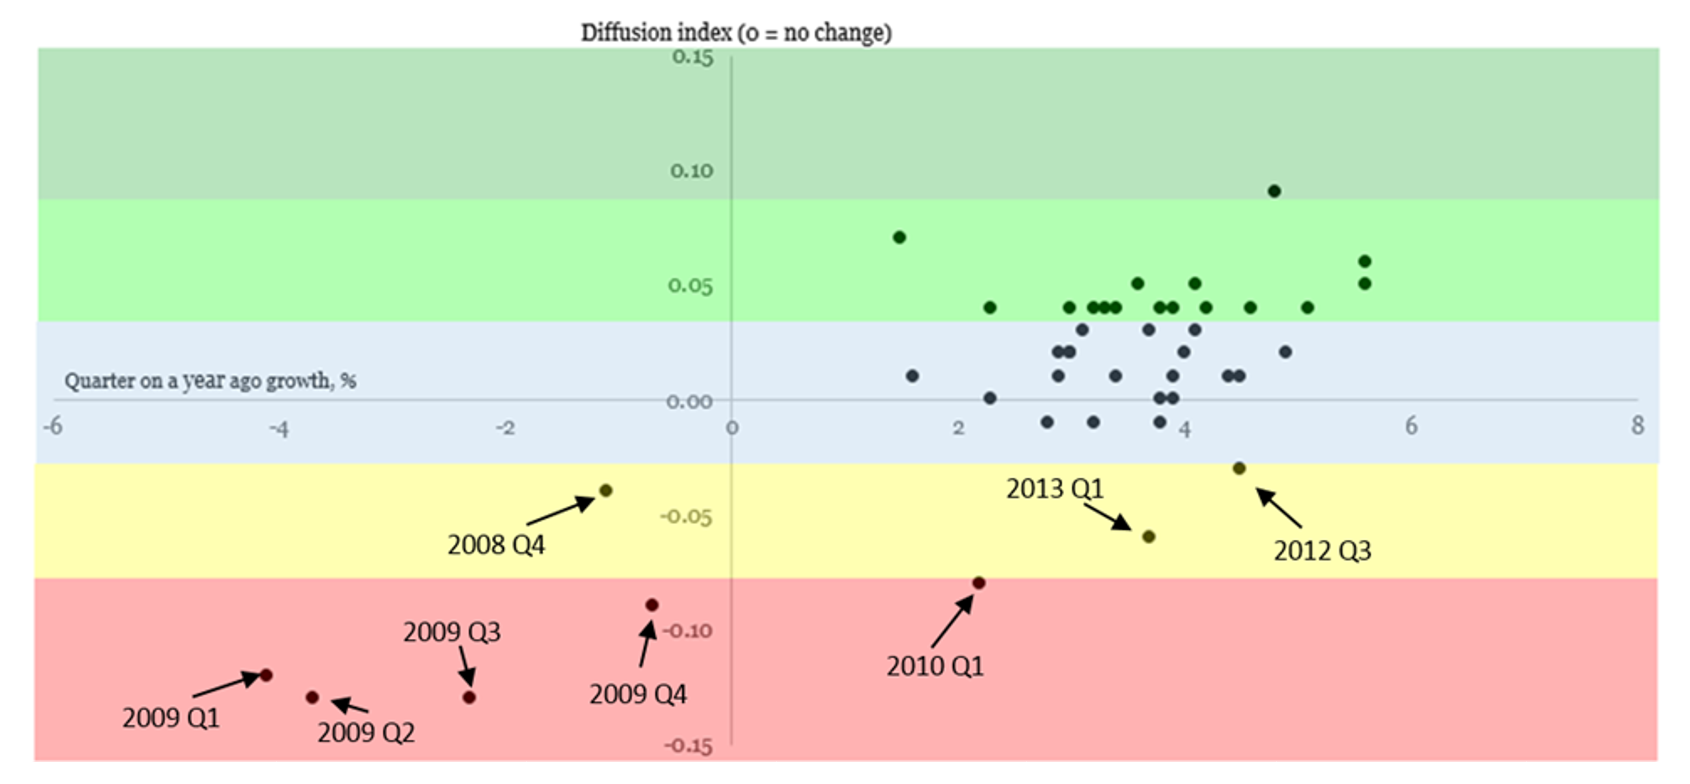
Coloured bands show different levels of the turnover diffusion index with the highest values in the dark green band and the lowest values in the red band. Values in the light blue band are close to the average level of the turnover diffusion index. The values chosen for the bands are based on a visual interpretation of historic performance during 2008 to 2018.
QonQ4 is likely to be less responsive than quarter-on-quarter (QonQ) or month-on-month (MonM) growth rates. We present additional analysis of QonQ indices and the month on a year ago indices in the Annex. Although the QonQ diffusion indices are more volatile, as might be expected, we see a similar relationship between it and GDP, with the lowest points of the QonQ turnover index during 2008 and 2009. The month on a year ago indices are less correlated with GDP as monthly reporters tend to be particular types of firms (see Section 2) but the trends for particular industrial components are interesting.
We have also conducted mean variance adjustment (MVA) on our indices. This process constrains the mean and sample standard deviation of the indices to match that of GDP growth, thereby allowing us to gain a clearer understanding of points in the time series where our indices differ from GDP growth. Note, in practice this requires some historical estimates over which to define the adjustment and cannot be used on a single data point. We use the mean and standard deviation of GDP over the whole period for which each index is currently available in our adjustment. From this, we can see that the turnover index is highly correlated with GDP growth during the recession, although less-so in the periods that follow (Figure 5). Correlations against GDP for both the QonQ4 and QonQ indices over different time periods are avaliable in the Annex.
Figure 5: Quarter on a year ago GDP CP SA vs mean variance adjusted (MVA) VAT turnover and expenditure diffusion indices NSA
Industry breakdowns and industry bias in the diffusion indexes
As discussed in section 2, monthly returns are dominated by agriculture, forestry and fishing (section A), followed by wholesale and retail (G) and construction (F). When publishing the M1 estimate of the monthly diffusion indices it is only these three sectors for which there are enough returns to publish the indices.
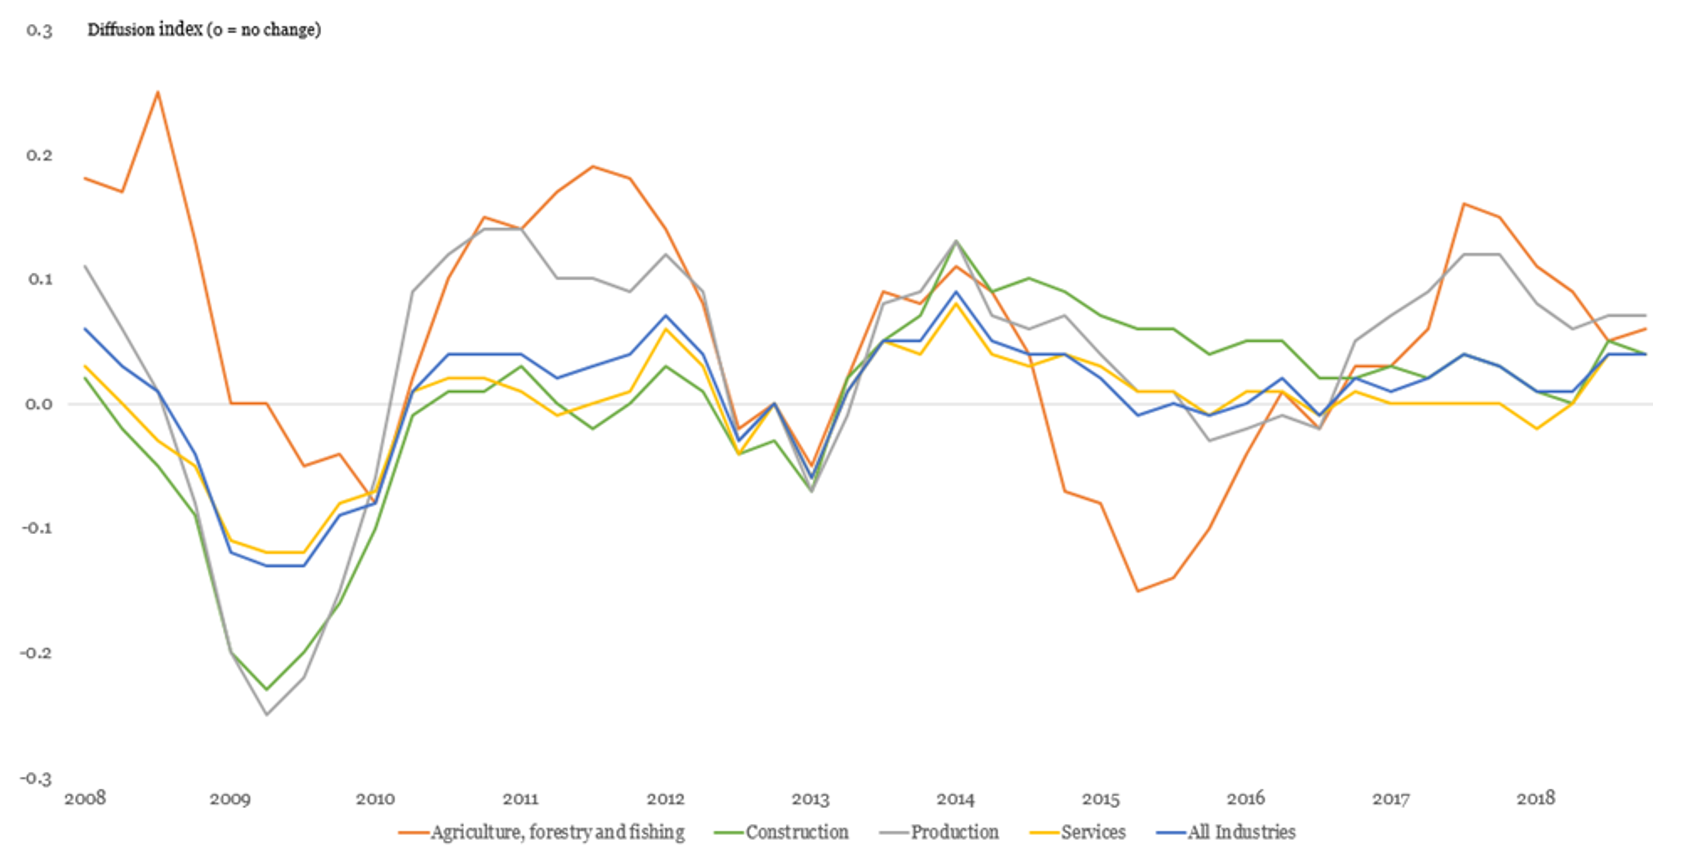
The industry breakdown can offer some explanation to movements in the total diffusion indices, for instance why the aggregate turnover index fell in 2015. The diffusion indices are not weighted by industry and so they are more exposed to nominal movements in agriculture than would be the case in the official estimates.
Figure 6 shows the diffusion index for agriculture, production, construction and services. In 2015, there was a marked fall in the price of agricultural produce, and this is reflected in a fall in the agriculture diffusion index, which is not seen in the other industry components to the same extent. This, coupled with the relatively high weighting of the agricultural industry in the index, explains why we see a fall in the all industries turnover index in 2015 which is not matched by a fall in GDP. This episode highlights the need to understand movements in industry-level VAT turnover to explain how the headline turnover index performs. Future work could include developing a weighted index.
Figure 6: Quarter on a year ago VAT turnover diffusion index by industry
Early estimates
One feature to consider is whether any signals in the VAT estimates might offer the scope for improving the quality of official estimates in real time. Recent analysis shows that revisions to GDP in the initial vintages of real GDP continue to be small and not statistically significant, but that revisions were larger around the time of the recession. This is not necessarily unexpected as estimates are more likely to be prone to revision at times of increased uncertainty, which will typically be the case around turning points. It may be that insights from VAT turnover may provide some additional timely information that will help inform the production of early estimates.
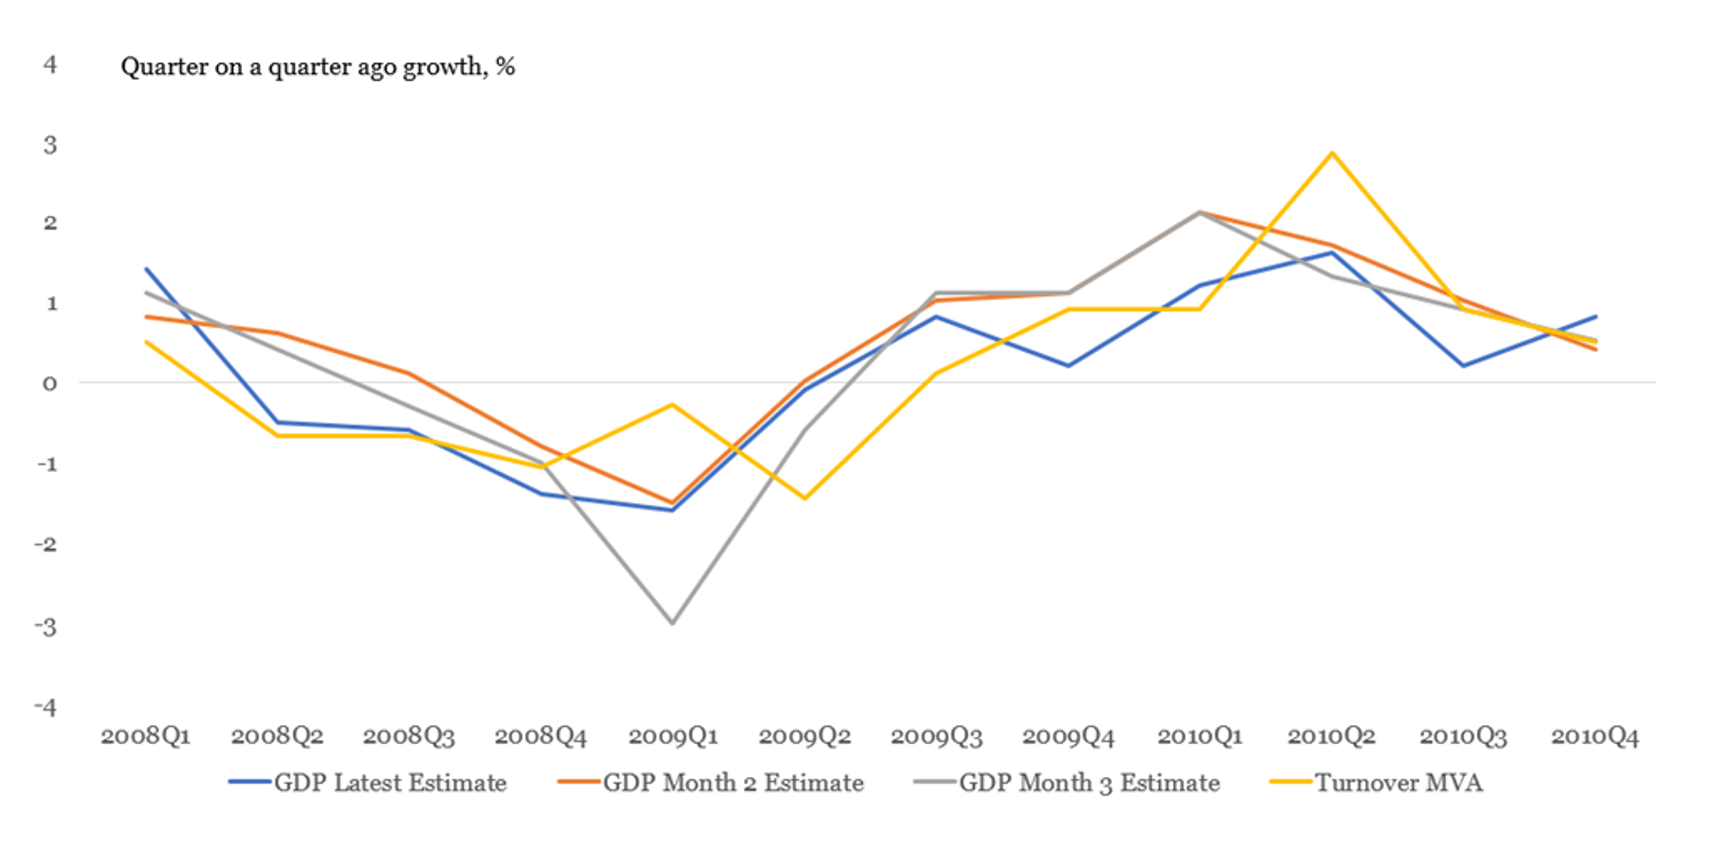
Figure 7 shows that the M1 QonQ turnover diffusion index showed a steep fall in Quarter 2 (Apr to June) 2008. The M1 turnover diffusion index estimate for Quarter 2 2008 would have been available in July, five months before the official GDP publication first recorded negative current price QonQ growth in Quarter 3 (Jul to Sept) 2008. We note, however, that since that time, both the publication schedule for GDP, and its methodology and data sources have changed. Also, a future economic shock might look quite different, and we cannot be sure that the diffusion index (or official estimates of GDP) would respond in the same way again. However, our primary goal of early identification of large economic shocks has been met, for the only case we are able to analyse.
Figure 7: Vintages of GDP current prices SA quarter on a quarter ago growth vs mean-variance adjusted VAT turnover diffusion index SA
New reporters
Another measure that we have derived from the VAT returns is a measure of new VAT reporters, a potential proxy for firm births, as published in Business demography. The methodology used in constructing the business demography data is more advanced, considering both turnover and employment and taking into account data sources other than VAT. This new VAT indicator more simply measures the number of VAT reporters, based on their VAT references, which have not previously appeared in the VAT returns dataset. These are likely to exhibit some cyclical behaviours and so be an indicator of the state of the economy.
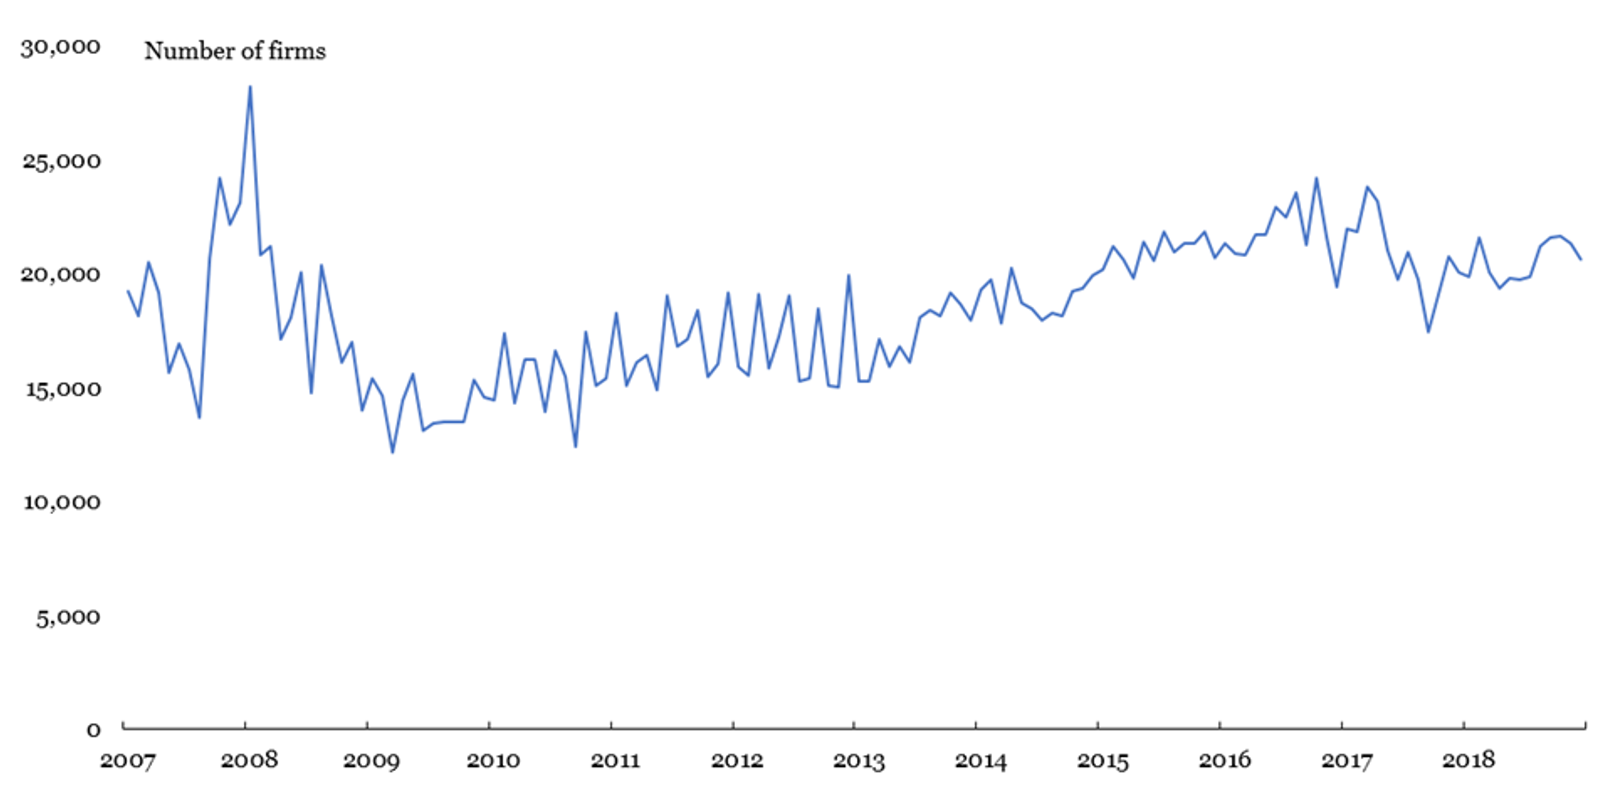
For instance, the recession was characterised by a tightening of financial conditions and an increase in economic uncertainty, and we would expect to see a fall in new reporters. We are able to provide a monthly measure of the number of new reporters, which could be published in the month after the reference month. Figure 8 shows that the number of new firms appearing in the data was at its lowest level during 2009. The trend in this new measure is similar to the annual trend in the firm births, as published in Business demography, despite the differences in methodology.
Figure 8: Monthly new reporters SA
VAT reporting types
We can also use the VAT data to observe firm-reporting behaviour, and its relationship to economic trends.
Firms that primarily produce zero-rated goods, such as food or children’s clothing, would generally be expected to make repayment claims. However, a large number of badly-performing firms could appear as a spike in the number of repayment claims.
Re-input returns are those that fail checks when the data are first submitted, before being re-input by HMRC, so could be a sign of unusual returns. Replacement returns are those that replace a previous acceptable return. If firms are more likely to make errors at times of economic stress then changes in the number of replacement returns, correcting these errors, could be an indicator of changes in economic conditions.
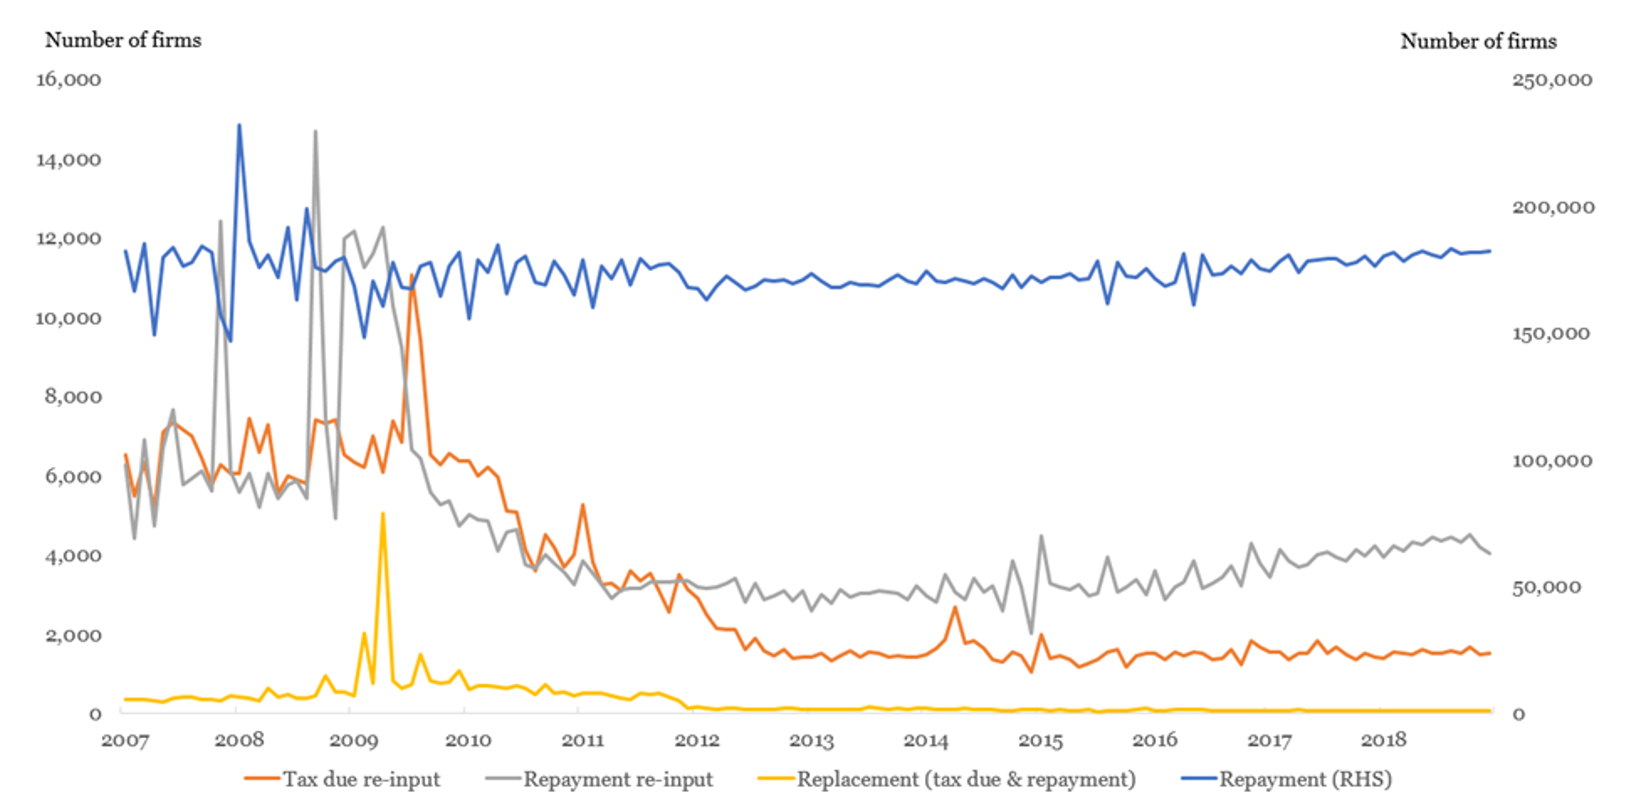
In Figure 9, we observe that re-input repayment returns spike upwards in late 2007 and repayment claims spike upwards in early 2008, prior to the economic downturn. Re-input repayment and replacement returns also spike upwards during the recession, as well as re-input tax due returns. Following the recession, the number of each type of return appears to stabilise, albeit to a new normal. This suggests that large changes to reporting behaviour are an indicator of economic stress.
Figure 9: Repayment, re-input and replacement returns SA
5. Conclusions
- The Faster indicators of UK economic activity project aims to identify close-to-real-time estimates of economic activity, creating a set of indicators that allow early identification of large economic changes.
- It is important to note that we are not attempting to forecast or anticipate official gross domestic product (GDP) estimates or other headline economic statistics here, and the indicators should not be interpreted in this way. Rather, we provide an early picture of specific economic activity – in this case, derived from VAT returns – which may be of interest to policy-makers. It may be that these indicators have the power to improve the performance of nowcasting or forecasting models, as components of these models, but we have not as yet tested this.
- The indicators show promise for indicating large changes in the economy quickly, so there may be potential in being able to identify signals around turning points in closer to real time. There are some false steers and they are less good at identifying smaller changes so care is needed with interpretation.
- The turnover diffusion indices show similar trends to the latest version of current price GDP growth in 2008 to 2009. Furthermore, the quarter-on-quarter diffusion index would have indicated a potential downturn in the economy five months before the official GDP publication first recorded negative current price quarter on quarter growth (although we note that, since 2008, both the publication of GDP and its compilation have been improved).
- The industry-level indicators are informative in understanding the behaviour of individual sectors and how this affects the overall indices. For instance, the 2015 dip in the overall turnover diffusion index is heavily influenced by agriculture. Every firm in the data currently has the same weight in the diffusion indices so certain sectors that have a large number of firms are particularly important in the overall indices.
- Measures of reporting behaviour available on a monthly basis show some relationship with economic stress. The number of new reporters of Value Added Tax (VAT) data was relatively low at the start of 2009. There were also occasionally an increased number of firms reporting repayment claims, re-input or replacement returns during 2008 and 2009.
- Potential future work includes:
-
- linking the VAT data to the ONS’ Inter-Departmental Business Register, to allow breakdowns by firm size, and more robust industry classification
- interrogating the industry breakdown further and investigating the potential to weight the indices so each firm no longer has the same weight.
- investigating the data prior to 2007 and developing a method for converting the pre-2008 data from SIC 2003 to SIC 2007 so that the industry breakdowns could be extended prior to 2008
- reviewing and refining the seasonal adjustment methodology
- exploring anomaly detection further as a method of identifying turning points
- developing other indicators such as an indicator of firms’ reporting lateness, whether firms are reporting more or fewer days after the end of the reporting period, as another potential measure of economic conditions.
6. Annex
Correlations of VAT turnover and expenditure diffusion indices with GDP
The turnover diffusion indices correlate more closely with GDP during 2008 to 2010 than during subsequent periods (Table A1 & A2).
Table A1: Quarter on a year ago GDP current prices seasonally adjusted vs VAT turnover and expenditure diffusion indices not seasonally adjusted
| Turnover | |||||
| 2008 – 2010 | 2011 – 2012 | 2013 – 2018 | 2008 – 2018 | ||
| Pearson correlation coefficient | 0.91 | -0.60 | 0.40 | 0.78 | |
| Expenditure | |||||
| 2008 – 2010 | 2011 – 2012 | 2013 – 2018 | |||
| Pearson correlation coefficient | – | – | 0.15 | ||
Table A2: Quarter on a quarter ago GDP current prices seasonally adjusted vs VAT turnover and expenditure diffusion indices not seasonally adjusted
| Turnover | |||||
| 2008 – 2010 | 2011 – 2012 | 2013 – 2018 | 2008 – 2018 | ||
| Pearson correlation coefficient | 0.72 | -0.54 | 0.05 | 0.37 | |
| Expenditure | |||||
| 2008 – 2010 | 2011 – 2012 | 2013 – 2018 | |||
| Pearson correlation coefficient | – | – | 0.14 | ||
Comparison of QonQ turnover and expenditure diffusion indices with GDP
The quarter-on-quarter (QonQ) indices are more volatile, and less well correlated with QonQ GDP growth than the equivalent quarter-on-year ago indices. However, despite this volatility, the lowest points of the QonQ turnover index are during the economic downturn of 2008 and 2009 (Figures A1 & A2).
Figure A1: Quarter-on-quarter GDP current prices seasonally adjusted & VAT turnover and expenditure diffusion indices seasonally adjusted
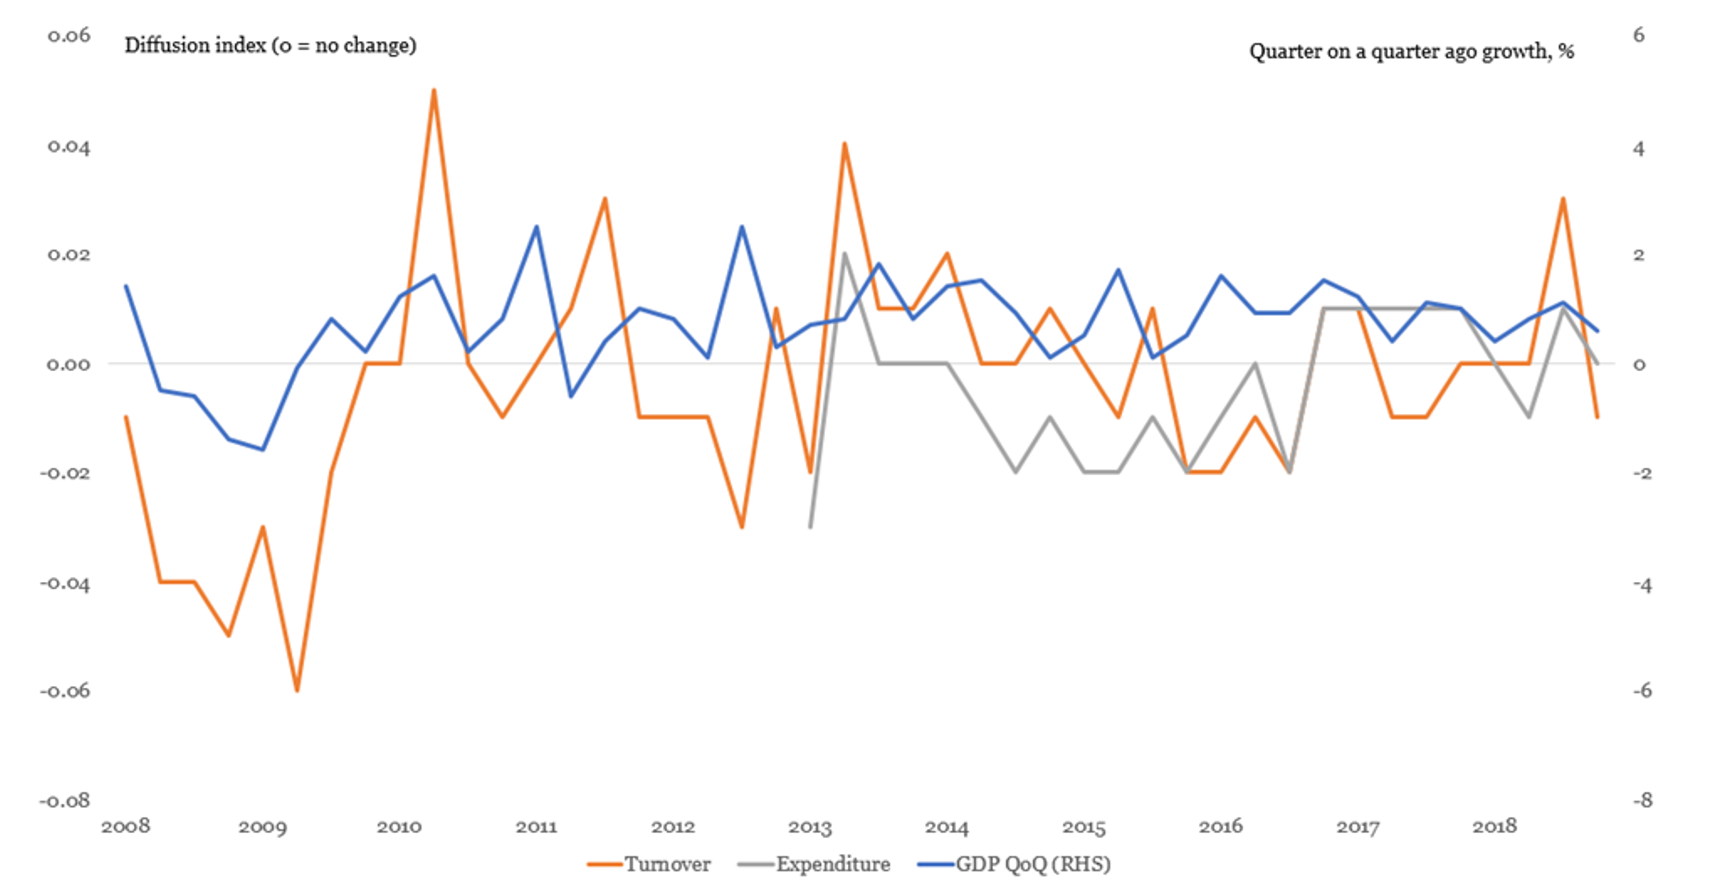
Figure A2: Quarter-on-quarter GDP current prices seasonally adjusted vs VAT turnover diffusion index seasonally adjusted
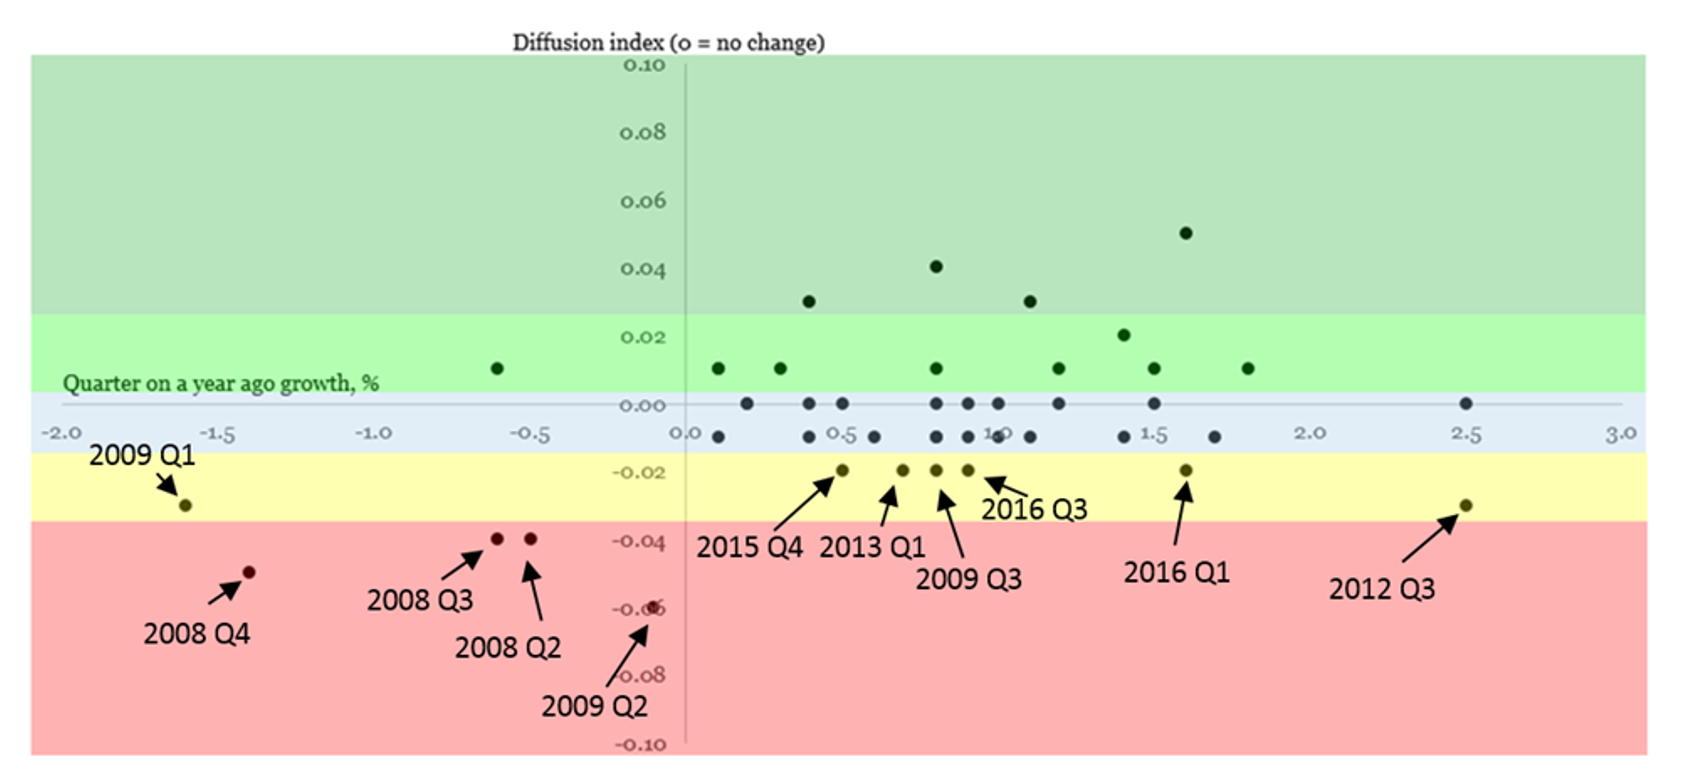
Coloured bands show different levels of the turnover diffusion index with the highest values in the dark green band and the lowest values in the red band. Values in the light blue band are close to the average level of the turnover diffusion index. The values chosen for the bands are based on a visual interpretation of historic performance during 2008 to 2018.
Month on a year ago turnover diffusion indices
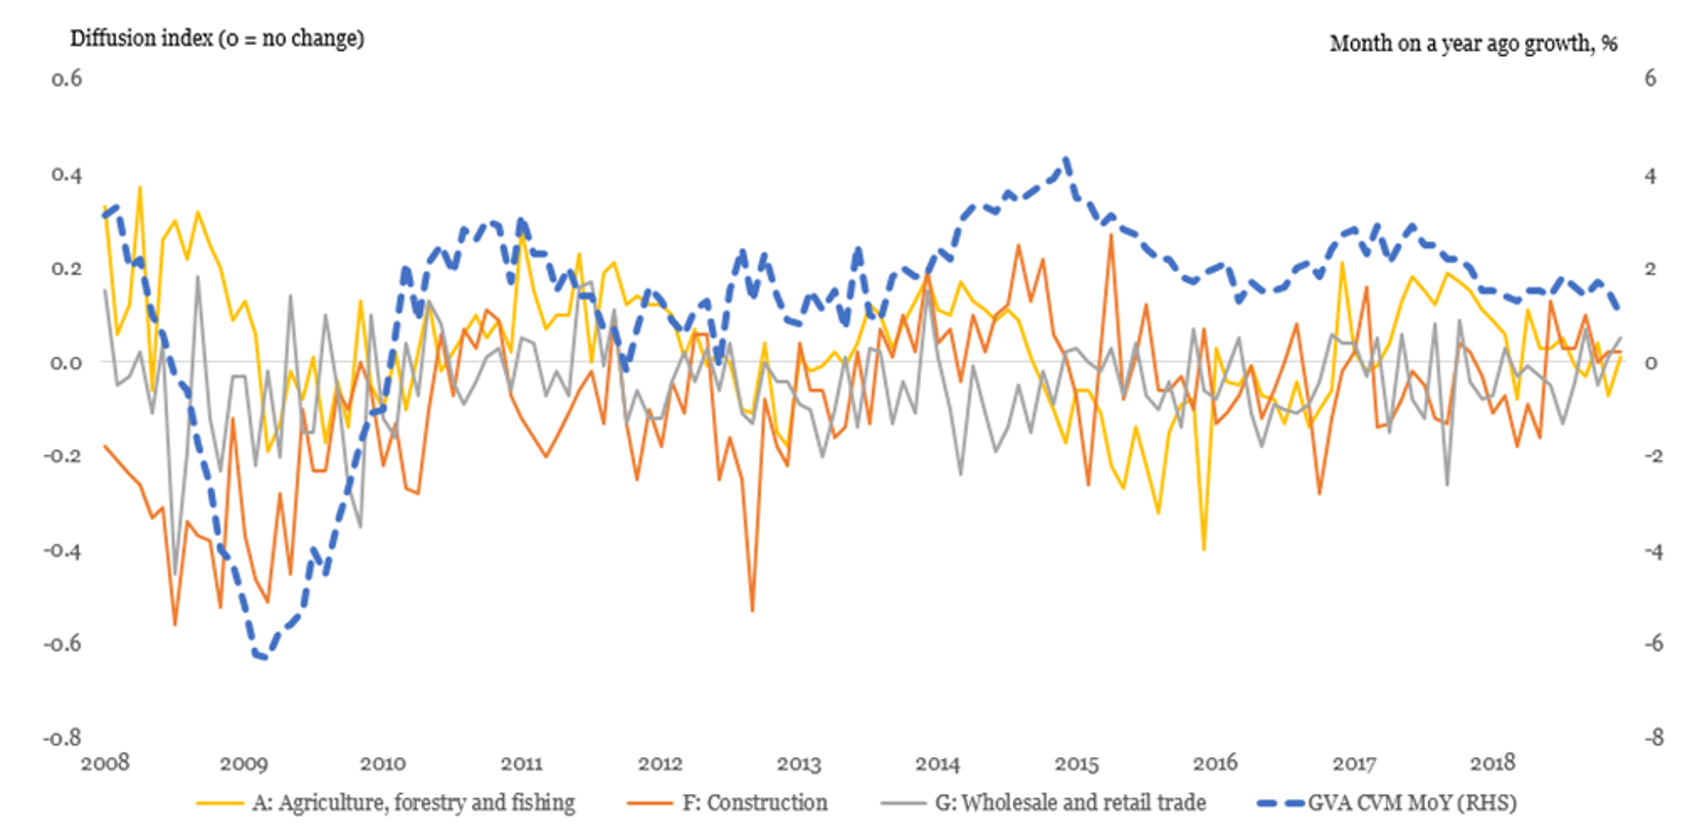
The majority of monthly reporters are firms reporting repayments and so generally firms from certain industries (see Figure 2). Therefore the total monthly diffusion index is less correlated with GDP but the trends for particular components can be useful by themselves (Figure A3). Within a month of the reporting period the monthly data can only be published for certain sectors (Figure A4).
Figure A3: Month on a year ago gross value added chained volume measure seasonally adjusted vs Month 2 estimate of month on a year ago VAT turnover diffusion indices non-seasonally adjusted (total and by component)
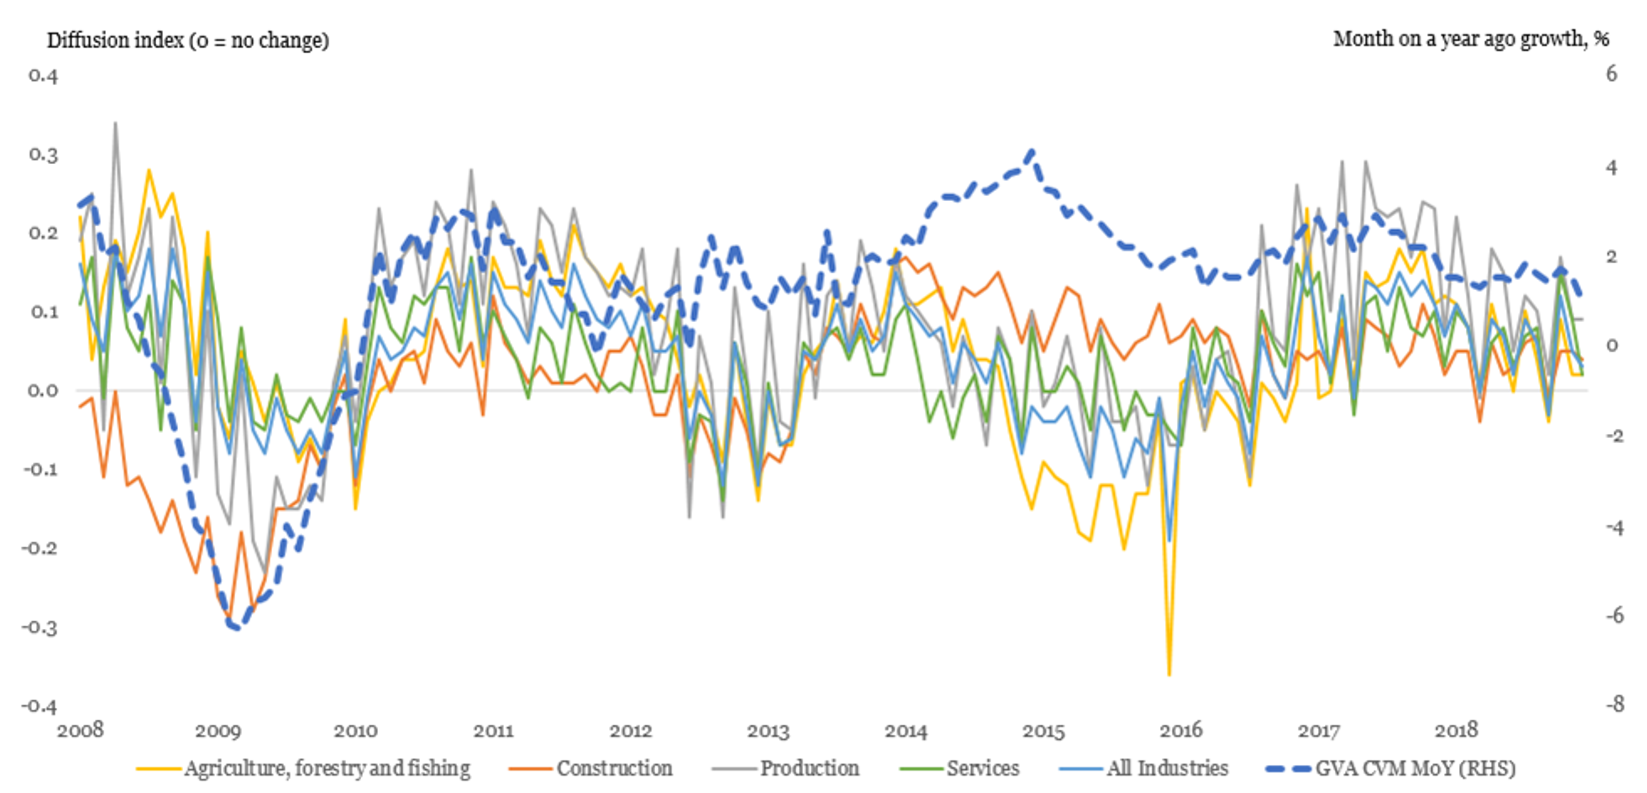
Figure A4: Month on a year gross value added chain volume measure seasonally adjusted vs Month 1 estimate of month on a year ago VAT turnover diffusion indices non-seasonally adjusted for non-disclosive industries
7. Authors
Jeremy Rowe, Daniel Ollerenshaw, Luke Shaw, Jonathan Bonville-Ginn, Shane O’Connor, Andrew Sutton, Ioannis Kaloskampis, Gareth Clews, Louisa Nolan, Sumit Dey-Chowdhury