Using Mobile Phone Data for Enhancing International Passenger Survey Traveller Statistics

Over the last 18 months, we have been working with new data sources, such as aggregated and anonymised crowd movement data from O2 Motion. These data look at mobile device connections to O2 masts to gain a picture of crowd movement trends around the UK1. These sources have given us vital and timely insights into population mobility, helping to inform the country’s response to the coronavirus (COVID-19) pandemic.
Building on the success of this work, we realise there may be potential for such data sources to enhance our statistics in the future.
In this guest blog, Robyn Hunt from the Office for National Statistics’ (ONS’) travel and tourism review team looks at the use of O2 Motion crowd movement data to model estimates from the International Passenger Survey (IPS) as part of a wider review of the ONS’ travel and tourism statistics.
A review of the ONS’ travel and tourism statistics was started in response to recommendations from the Office for Statistics Regulation (OSR) made in October 2019, highlighting that our statistics did not sufficiently meet users’ needs. Key issues reported included timeliness, accuracy and level of disaggregation as well as poor levels of user engagement.
In early 2020, the coronavirus (COVID-19) pandemic and associated travel restrictions led to the suspension of most surveys used to estimate different components of travel and tourism industries. As a result, alternative sources of data that could be used to produce those estimates were sought, and travel and tourism statistics were published based solely on administrative data and modelling (as seen in Overseas travel and tourism, provisional: April to June 2020). This approach builds on a transformation mindset across the ONS to improve our statistics by:
- using new sources of data, including administrative data
- closer integration with the work from other statistics producers
- making best use of new methodological advances in the fields of statistics and data science
What data are we using?
In this article, we present and analyse aggregated and anonymised mobile phone data from a single network provider, for both inbound (foreign residents visiting the UK) and outbound (UK residents travelling abroad) tourism. The mobile phone data for inbound tourism consists of anonymised aggregated counts of foreign sim cards which are connected to the given network in the UK in a specified time period and is provided to us in an aggregated format across three variables:
- country – the country where the sim card’s phone network is (assumed to be country of residence)
- regions visited – a list of the regions of the UK where the device connected to the network for longer periods whilst in the UK, and
- departure week – the week in which the device last connected to the network
The aggregate count for outbound tourism is given as an expanded count, where the number of mobile phones detected has been weighted such that it represents the UK population. This weighting has been done by the provider before aggregating the data. The expansion process is not applicable to inbound tourism since the necessary weighting breakdowns, such as population and demographic information, associated with foreign residents is not presently available. The outbound tourism data has a similar structure to the data for inbound tourism, namely:
- Main destination – the main country and/or continent that the user visited
- UK Home Local Area District (LAD) – derived from the location of the anonymised device prior to travel
- week of UK arrival – grouped into the seven day period in which the device first connects to the home (UK) network after it’s been detected abroad
Any combination of these three variables with fewer than 10 people are removed because of disclosure control, in order to ensure that no individual can be identified.
As part of the travel and tourism review, we have access to weighted record-level data from the Office for National Statistics’ (ONS) International Passenger Survey (IPS) which we have aggregated by month of UK departure and country of residence (for inbound tourism), or by month of UK arrival and travel destination (for outbound tourism). These weights are derived from a sample that is representative of the population of passengers. Since the sampling design for the IPS is optimised for quarterly estimates, monthly is the smallest time period we can aggregate at to maintain sufficiently narrow confidence intervals. To conduct equivalent comparisons between the IPS estimates and the mobile data, we have further aggregated the mobile data which was provided from weekly to monthly departures.
Aggregation was additionally applied by country of residence (assumed to be the same as the country in which the sim card is registered) for inbound tourism comparison, and by destination country for outbound tourism estimates.
We have access to aggregated mobility data from October 2019. Our analysis is therefore limited to a time-window of five months before the IPS was suspended because of the coronavirus (COVID-19) pandemic in mid-March 2020, for which we have both mobile and IPS data for comparisons.
Inbound tourism findings
To examine the number of foreign visitors to the UK, we compared an absolute count of visits from the mobile phone data, which has partial population coverage, to the weighted estimate from the International Passenger Survey (IPS). A universal scaling factor of 2.97 which approximately corrects for this partial coverage was applied to the absolute mobile data counts based on a least-mean-squares best fit between the mobile data and IPS estimates for visitors from individual countries per month, so that trends can be compared more easily. The month of travel was based on the data collected for departures (at the end of the trip) for both datasets. We compared overall trends in the data as well as relationships for smaller groups of countries (based on geographical proximity). Errors have been estimated based on the sample design for IPS data, but unfortunately, since the mobile counts are summed directly, no estimate of variance can be calculated.
Figure 1: The total number of foreign residents visiting the UK, as estimated by the IPS from month to month between October 2019 and February 2020, compared with an estimate derived from traveller counts from mobile phone activity
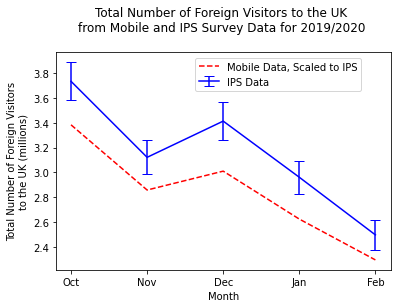
Figure 2: The percentage change in the number of foreign residents (relative to the mean number of travellers over the same time period) from smaller country groups visiting the UK, as estimated by the IPS from month to month between October 2019 and February 2020, compared with traveller counts from mobile phone activity
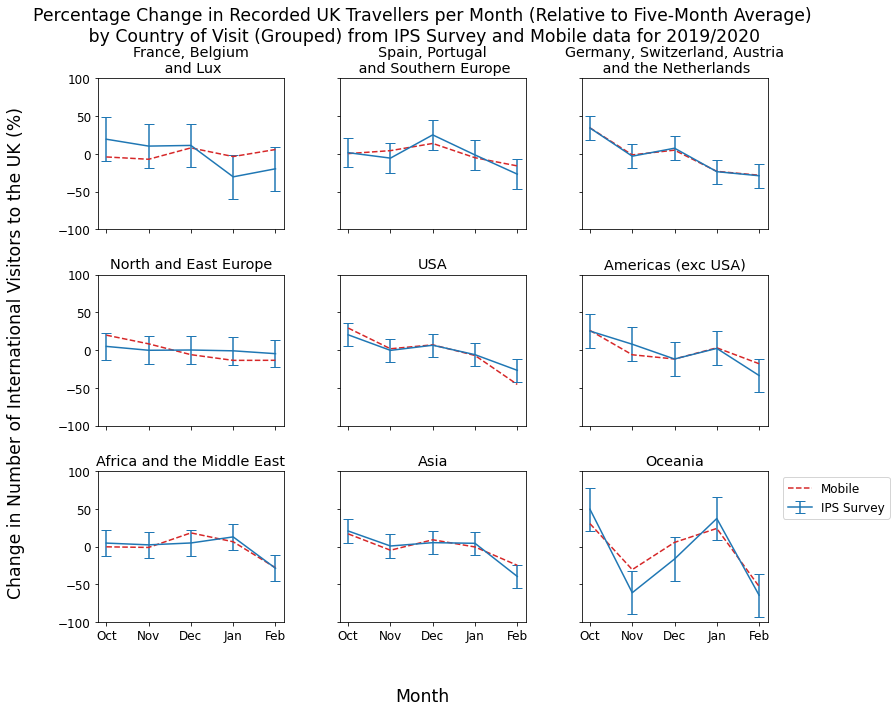
The relative changes in number of visits from month to month estimated from the mobile and IPS data, seen in Figures 1 and 2, are very similar at the overall level and when looking at groups of countries. There are some exceptions to this, for example, the group consisting of France, Belgium, and Luxembourg. The coverage of travellers from this group appears to be very small and different trends are seen in IPS and mobile data.
Figure 3: The total number of foreign residents visiting the UK from smaller country groups, as estimated by the IPS between October 2019 and February 2020, compared with an estimate derived from traveller counts from mobile phone activity
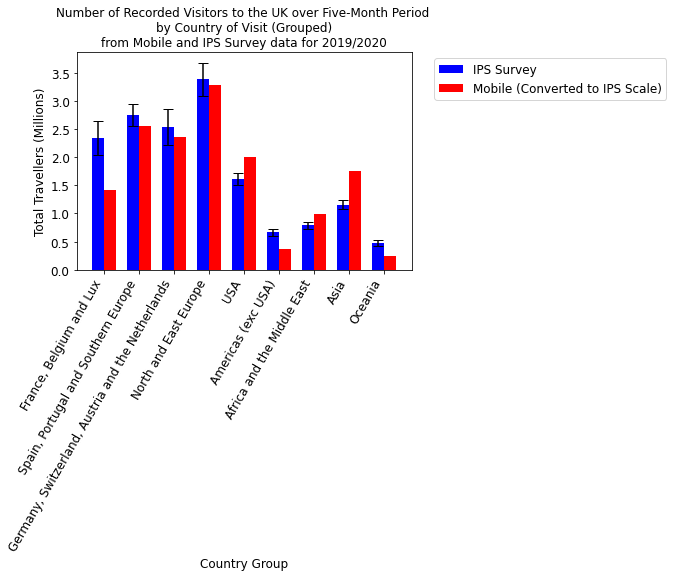
In Figure 3, we can see that the difference between the total number of travellers derived from the IPS and the total number of travellers from the mobile data varies between country groups. Whilst estimates from the IPS and from the mobile data are similar across most areas of Europe, the mobile data indicates that more travellers are coming from Asia, Africa and the Middle East, and the USA compared with estimates derived from the IPS, whilst the opposite is true for travellers from France, Belgium and Luxembourg, South/Central America and Canada, and from Oceania (Australia, New Zealand and South Pacific islands). These discrepancies could likely be corrected by constructing specific weighting factors rather than applying a universal scaling factor, by researching and correcting for sources of bias in the coverage of travellers from individual countries within these groups and more detailed demographic information for travellers with mobile phones. However, this process is complex and the information necessary to calculate these weights is not readily available.
Outbound tourism findings
For analysis of travel patterns for UK residents travelling abroad, a similar approach was taken to that for inbound tourism. This time, we compared a weighted estimate from mobile data (mobile contract holders weighted to UK population) to a weighted estimate from the International Passenger Survey (IPS) rather than a raw count of phones detected. For reasons similar to those described for inbound tourism, a universal scaling factor of 1.53 was applied to the mobile data using a similar fitting procedure. The month of travel was based on the data collected for arrivals (at the end of the trip) for both datasets.
The results from this analysis were similar to those seen in the comparisons for inbound tourism. Again, relative trends of the number of visits abroad from month to month are consistent between the two data sources both overall and in country groups.
Generally, the difference between the IPS and mobile estimates per group is much smaller than those seen for inbound tourism. This is likely because of weighting being applied to the mobile data which corrects for some of the variability because of demographics and coverage bias. The most obvious gap in mobile coverage is for Oceania, where we have almost no data and the estimate of travellers to Oceania from the IPS is very small. Some hypothesised reasons for this include the considerable travel distance and high mobile roaming charges; travellers to this area of the world are likely to stay for extended periods of time and may purchase a local sim card rather than using their home-registered SIM for the duration of their stay. However, it is not currently feasible to determine for certain the exact reasons for the differences between estimates. The most noticeable differences between mobile data and IPS are observed for January and February 2020, where IPS is higher in January and mobile data is higher in February.
Key limitations and takeaways
- Our analysis is restricted to groups of countries where sufficient sample was achieved by the International Passenger Survey (IPS) to allow reasonable comparisons. As such, individual countries within a group may not show as good a relationship as wider groups.
- During aggregation, where a week overlaps two calendar months, we have assumed that the number of travellers is evenly distributed across the week and split the number of travellers between months accordingly. This assumption does not take into account surges in travel at particular times of the week or because of seasonal events, such as national holidays.
- Population coverage of the mobile data is variable; some travellers have two mobile phones, for example, for business use, and others may not carry a mobile phone or may only use one device across multiple people in the group. Differing market shares of the network in question and its partners also make it difficult to weight counts of mobile phones to represent the general population of travellers, although the data for outbound tourism has been adjusted by the supplier to account for this variation as far as possible.
What’s coming next
This work forms a small part of alternative data investigations for the travel and tourism review in the Office for National Statistics (ONS). We hope to further develop this work by combining the mobile data with other types of mobility or administrative data. We aim to use small area estimation techniques to break down International Passenger Survey (IPS) estimates for passenger counts for visits to UK regions with greater accuracy.
Additional information on the review can be found in our travel and tourism review article, methods paper and consultation. Our consultation into the proposed future approach to measure travel and tourism opens on 5 October and closes on 21 December 2021.