The Longitudinal Business Database: Capturing the UK economy with new business microdata

Introduction
A novel dataset that will enable you to better understand changes to UK business demography over the last 20 years is now available. Further to insights that can be drawn directly from the dataset at a quarterly frequency, it also serves as a conduit to link business microdata from a variety of sources. This dual function makes this dataset a core source for research looking into the impact of economic events on businesses as well as a tool to evaluate policy decisions.
This new dataset is called the Longitudinal Business Database (LBD) and is available in the Secure Research Service (SRS) at the Office for National Statistics (ONS). The LBD is an experimental data spine built from the Inter-Departmental Business Register (IDBR), a comprehensive list of UK businesses. The LBD will provide longitudinal business microdata at a quarterly frequency from 1999 to 2022.
The LBD differs from existing business databases constructed using information from the UK business register in the way it is created. While existing IDBR-derived databases use individual snapshot data taken at a point in time to assume continuity of business activities, the LBD uses consecutive snapshots to derive continuity of business activities.
This new use of snapshot data enables the LBD to better capture longitudinality, and it also allows for better data utilisation by potentially resolving the problem of unmatched cases during a data linking process. The LBD also differs from existing linked UK business datasets as it offers reusability.
The LBD data spine only reflects business dynamics that are not readily observed from the IDBR, no assumptions or restrictions are imposed during its creation that could affect one’s interpretation of dynamism. This is different from existing linked business datasets as their creations usually involve application of assumptions to make the resulting product suit their custom purposes.
This blog provides a brief introduction to the LBD data product. It explains what the LBD is, outlines its key benefits, and its uses of the IDBR as input data. It also outlines some crucial steps that are taken in its computation to ensure it is an informative product. A technical paper that provides detailed discussions of the purpose of the LBD, its construction methodology, its input data, its advantages, and further descriptive results can be found in the LBD user guide.
What is the LBD?
The LBD is at its core a re-usable longitudinal data spine with each of its components providing the longitudinal link between business references.
Data spine is a new concept. A data spine is a collection of reusable longitudinal identity links. It contains key identification variables that enable linkages across different datasets, and it can be used for different research or analytical purposes. The LBD spine captures quarterly changes to businesses structure by tracking the movement of units, identifying when new units appear and removing inactive units. It is done by using consecutive snapshot data from the IDBR to deduce changes and continuity of business activities.
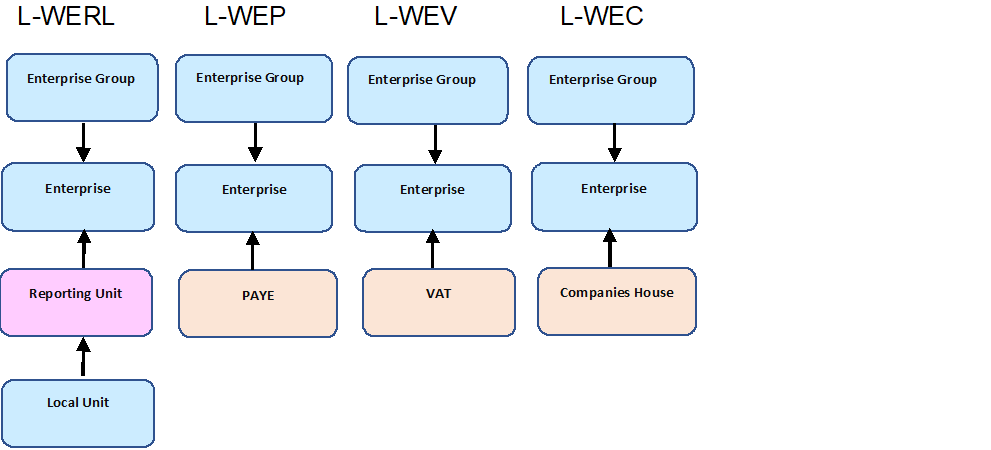
The first component of the data spine being released is the L-WERL (short for Longitudinal Who-Owns-Who (Enterprise Group), Enterprise, Reporting-Unit and Local-Unit) and is currently available on the SRS. The L-WERL part of the data spine links all statistical and observational units from the IDBR which can be joined to business survey results.
A group of legal units under common ownership is called an Enterprise Group. An Enterprise is the smallest combination of legal units (generally based on VAT and/or PAYE records), which has a certain degree of autonomy within an Enterprise Group; an individual site (for example, a factory or shop) in an Enterprise is called a Local Unit.
Enterprise Groups, Enterprises and Local Units are all statistical units. Observation Units (Reporting Units) hold the mailing address to which the survey questionnaires are sent; the questionnaire can cover the enterprise, or parts of the enterprise identified by lists of local units.
Future components of the data spine would provide the links for administrative units. Figure 1 shows the components of the LBD data spine and information from which IDBR business units are used to create them.
Figure 1: Set of LBD Spines
Benefits of the LBD
The LBD provides a linked longitudinal data spine that tracks a unit’s movements through time and is readily available for authorised researchers. Through the application of unit-specific activity criteria, the LBD provides researchers with information on firm dynamics that are economically meaningful, which in turn allows them to tailor variables and definitions to answer policy relevant questions at business cycle frequency.
Furthermore, we only establish rules that enable us to derive business activity status, such as new birth, activity, inactivity, reactivation, based on what is observed from two consecutive IDBR quarterly snapshots. Such criteria are modifications of those used by the ONS business demography.
We apply no further assumption to cleaning or tailoring the LBD spine to limit what datasets it can be used to produce for further downstream analysis. We use the term “death” to refer to inactivity. But users have the flexibility to apply their own definition of firm death that suits their research questions.
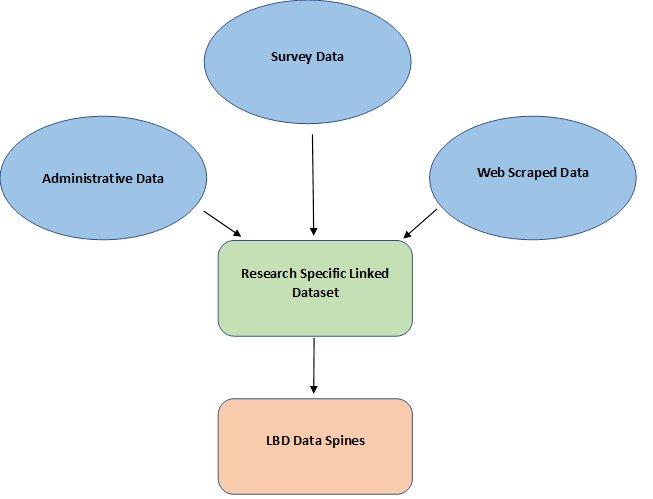
Therefore, the prototype (L-WERL) or any resulting linked dataset, can be tailored to answer questions as per researcher’s specifications, hence allowing the LBD spine to be a reusable data product. While for now the LBD only contains information from the business register, in the future our aim is to make it a vehicle for bringing administrative, survey and web-scraped firm-level microdata together in a consistent way.
Figure 2: Linking data from different sources with the LBD
Even before linking additional data, the LBD offers new possibilities for microdata research. The data spine can be used independently to analyse UK businesses with values from the IDBR for turnover, employment, industry, region and more.
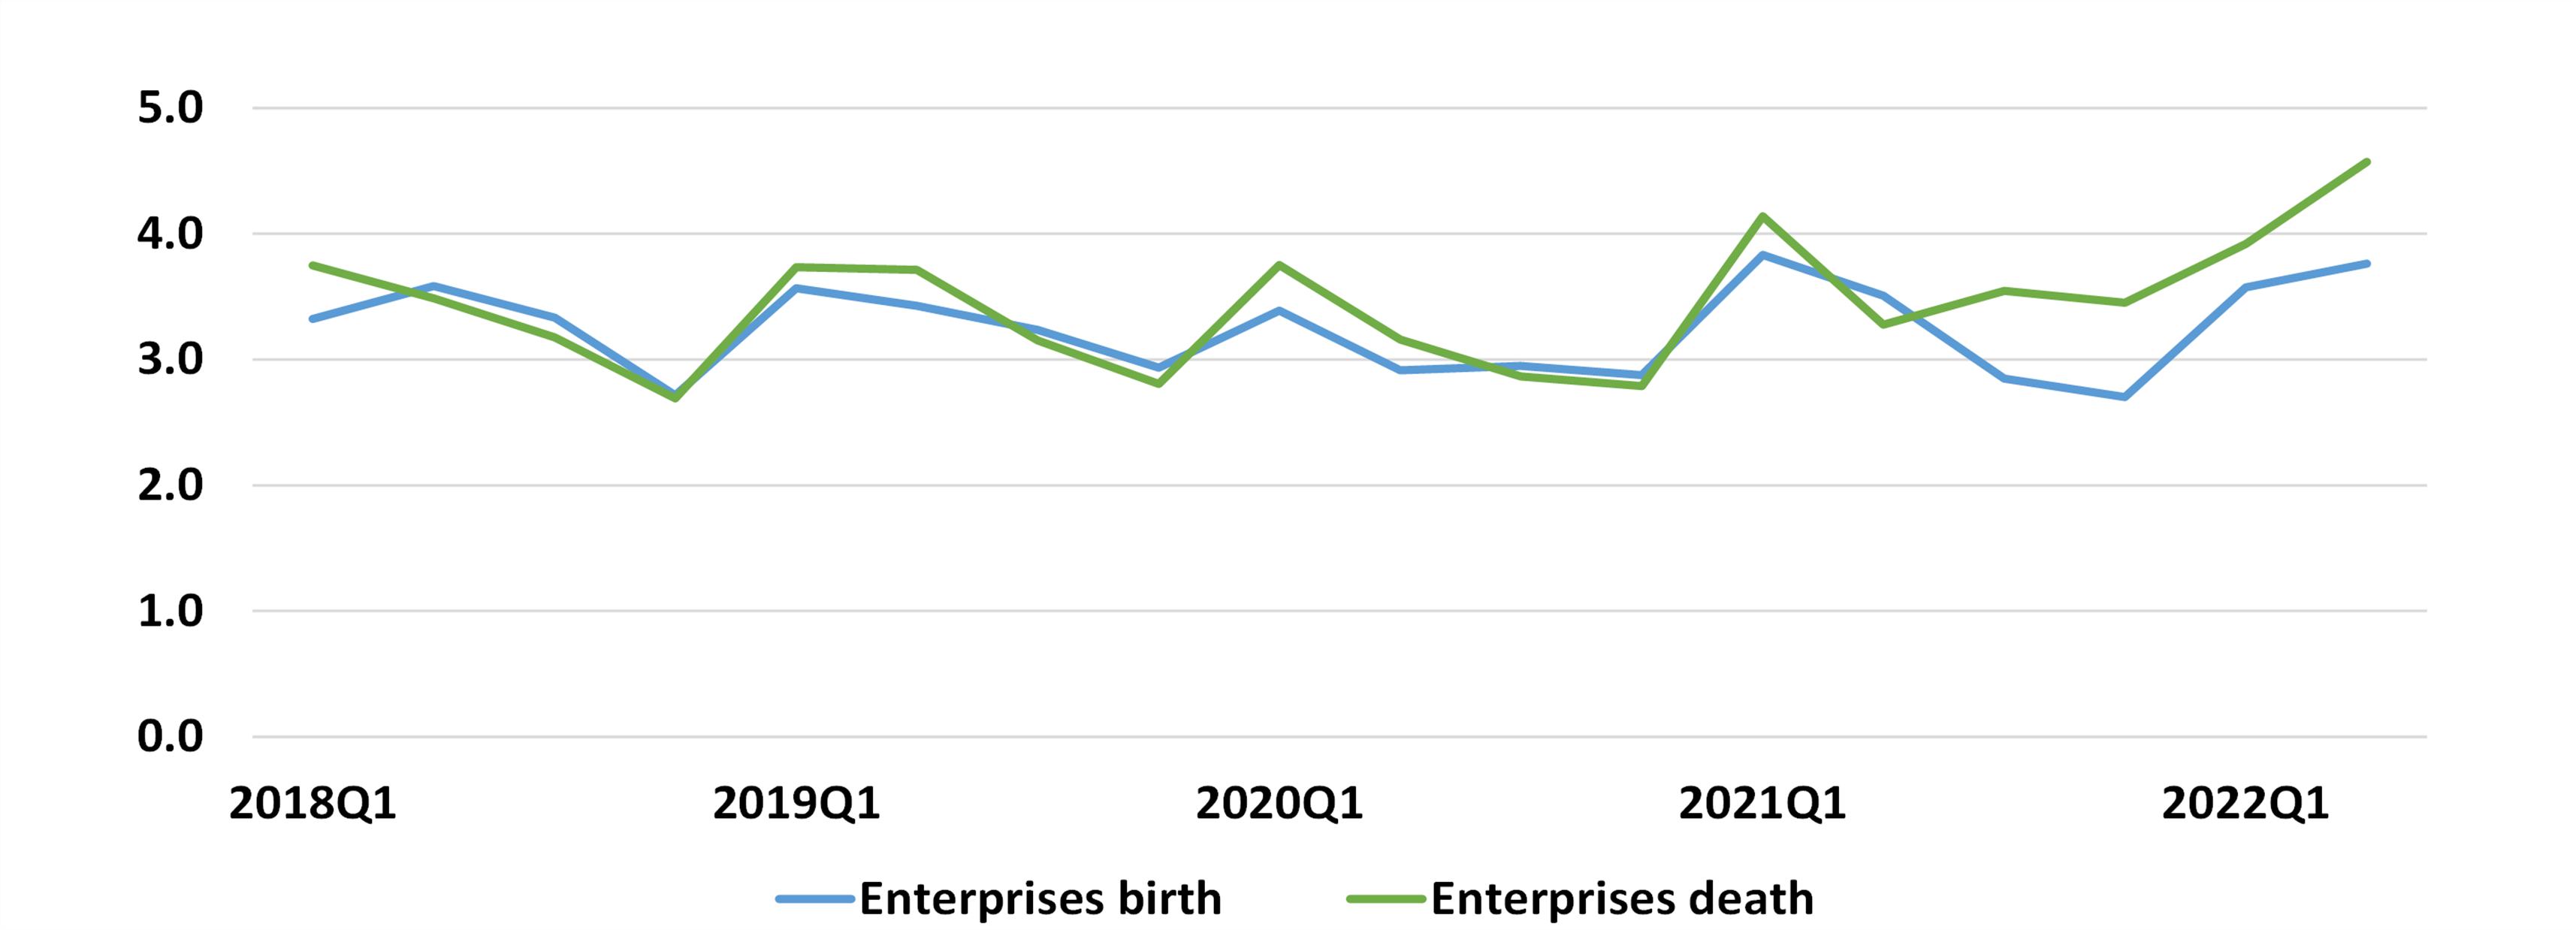
An example is Lui et al. (2020) which used an early prototype of the LBD to investigate the rate of job creation and destruction caused by the entry and exit of businesses. It is also ideally set up to look at business demography, as business births and reactivations (activity criteria as defined in the user guide, see pages 19 to 22) are identified in the LBD data.
Figure 3 shows the percentage of enterprise births and deaths for each quarter between 2018 and 2022. Figure 3 shows that the trend for both proportions remained fairly stable, with the gap beginning to widen from the second quarter of 2021. These trends, especially in the latter quarters can also be observed from the quarterly business demography publication. Further analysis is planned to understand recent trends in business demography from the LBD.
Figure 3: Births and deaths, % of total active UK enterprises, 2018 to 2022 Quarter 2.
LBD Input Data: Inter-Departmental Business Register
The most complete source of UK business microdata, and the primary data input for the LBD, is the Inter-Departmental Business Register (IDBR). The IDBR contains record-level information for 2.7 million businesses. Firms captured on the register represent 97% of UK turnover and 88% of employment.
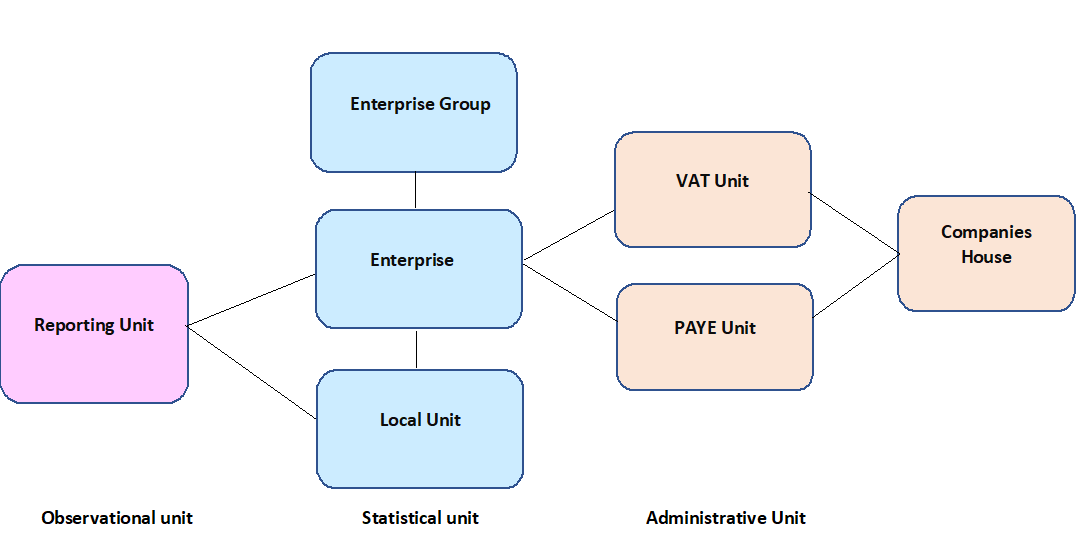
Despite containing a wealth of information on the UK businesses, it is challenging to use the raw IDBR data for analysis because of how businesses are structured on the register. Each firm on the IDBR is represented by a combination of IDBR business units.
These units are presented in figure 4. It is important to note that the identity links between these different units are not readily observed in the IDBR. Information of each business unit is stored as separate data tables (snapshots) in the IDBR. As a result, each of these data tables contain only partial information about the same firm.
Figure 4: IDBR business structure
The LBD is constructed such that the unobserved identity links of different business units of the same firm is re-established and made visible, making it easier for users to link different types of business data together.
Businesses follow a lifecycle and may change structure over time. As the firm changes, the business structure on the IDBR will also change with new units being created, units deactivating or moving between enterprises. Although these movements are implicitly captured, they are not clearly recorded on the IDBR. Longitudinal analysis requires linking historical records to reconstruct these changes to the business structure.
We take careful steps in designing methods to construct the LBD data spine to ensure the resulting product is informative, fit for research and analytical purposes and has improved usability.
Constructing the LBD
The IDBR data currently available for analytical use and statistical production are extracted from the IDBR at regular intervals: annually or quarterly. These data are in the form of snapshot data. A snapshot reflects what has happened at a point in time when the picture is taken, but a single snapshot does not capture changes over time.
Each LBD quarterly cross-section is constructed using two consecutive snapshots extracted from the IDBR, one taken at the start and one taken at the end of each quarter. We then use them to deduce changes in business activities and structure during the quarter. Hence the LBD can better capture changes in business structure and business dynamics over time.
We must also identify currently active units in each quarter, as inactive units are not removed from the IDBR. We apply unit-specific filters, which are designed according to the functionality of the business units of the IDBR, to identify active units from inactive units on the IDBR. It ensures these filters are fit for purpose as different IDBR business units have different functionalities on the IDBR.
Lastly, we assign an activity status marker to units for each quarter. This gives end users a more detailed understanding of a unit’s status. We label the quarter when the unit first appeared on the register and the last quarter a unit is considered active. We also capture movements of units to highlight where units have been relinked during the quarter.
These steps make the LBD easier to use for research and analysis than the IDBR snapshot data.
What’s next for the LBD?
For the first time, the LBD data is available to authorised accredited researchers outside of the ONS via the Secure Research Service. The LBD will provide researchers new comprehensive business microdata to analyse UK economic events. Information on how to apply for access is available here.
Efforts are ongoing to complete the spines relating to the administrative units, (L-WEP, L-WEV and L-WEC), which will allow researchers and analysts to link data from survey and administrative sources such as VAT, PAYE and Companies House using the LBD as a linking framework.
For more information on the project please contact a member of the Macroeconomic and Environment Statistics and Analysis team by email.