Exploring trends in local government spending through transparency declarations
Main points
- Public expenditure data published, under transparency obligations, by local and central government organisations has the potential to offer timely and detailed insight into how public money is spent.
- Transparency declarations could provide early indicators of local government spending within about three months, compared to the current publication lag of around nine months for final whole year estimates.
- Transparency data are widely available, in a timely manner, for central government organisations and English local authorities.
- Data collection is a challenge with transparency declarations published across hundreds of local authority websites.
- Promising data linkage results show that a simple allocation of a large proportion of spend to geography is possible.
- Differences in reporting formats make combining transparency expenditure data into a single, consistent, dataset challenging.
- Standardising local government transparency reporting practices and data formats would greatly increase accessibility and usefulness of the data.
Overview
Public expenditure data are used by government, the public, businesses and third sector organisations to monitor spending of public money. Data published under transparency guidelines are not currently used directly in Office for National Statistics (ONS) public sector finance statistics.
In this report we summarise the potential offered by this data to supplement existing public sector finance data sources. Throughout this report we refer to data on public expenditure published under transparency guidelines as “transparency declarations”, or simply “transparency data”.
We have been exploring the potential usefulness of transparency declarations and the challenge of collecting and processing them in an automated way. This is in line with the recommendations of a 2022 review of local government finance statistics to explore the feasibility of using administrative data sources to supplement survey collection and to explore methods of automated data collection.
Concluding a feasibility assessment, we find that transparency declarations do have the potential to improve the timeliness and granularity of information on public sector spending. However, the data are currently published across many different websites and with inconsistent formats.
This has implications for the cost to develop and maintain a single consistent dataset. There are private providers that collect, standardise and aggregate open procurement data for central and local government. These providers offer various data access options, including data feeds and interactive dashboards.
What are transparency declarations?
Transparency declarations refer to reports that document spending by government. In line with Local government transparency code 2015, English local authorities must declare details of most expenditure above £500 on a quarterly basis within a month. Similar data are published for central government bodies with different thresholds and timeliness requirements.
Transparency declarations have a potential to capture a sizeable amount of public sector spending. For context, in the financial year 2021 to 2022 for English local authorities total service expenditure totalled £107 billion and capital expenditure £26 billion, which to a large extent should be reflected in expenditure data.
Transparency expenditure data are a rich source of insight into public sector spending. It offers transaction level data with information about the value of the transaction, payment date and beneficiary. Information on expense type can also be included. Staff costs are not reflected in transparency declarations.
A separate stream of work in the ONS Public Sector Division sought to identify staff costs at a lower geographical level on a more timely basis using Pay As You Earn Real Time Information (PAYE RTI) data.
While the transparency data does not include staff costs, non-staff costs are a large proportion of local authority total expenditure. In the financial year 2021 to 2022 local authority running expenses made up 60% of total expenditure excluding procurement receipts (see Revenue outturn service expenditure summary, RSX).
The other strengths of the transparency declarations are that data are already in the public domain and are published with good availability and frequency. Some of the drawbacks to highlight are that data come from a range of sources and in a variety of formats, which poses challenges for scaling up automated data collection and standardising data (see summary of strengths and limitations below).
Strengths
- Open data: data are published under open government license; collection involves no additional burden on reporting organisations.
- Coverage: all English local authorities are required to publish their data.
- Frequency and timeliness: most local authorities publish data monthly soon after the date of expenditure.
- Correspondence with official statistics: while datasets have different definitions and coverage, there is high level of correspondence with official data.
Limitations
- Lack of a centralised data repository: data are scattered across hundreds of different websites.
- Disparity: data formats/ schemas and reporting practices are inconsistent across authorities.
- Reduced machine readability: data are often published in formats that are not machine readable.
- Challenges for data linkage: insufficient use of common identifiers for suppliers.
While expenditure data are currently published for transparency purposes, we have been investigating whether it can be used for statistical purposes. This is a collaboration between ONS Data Science Campus and Public Sector division and is part of the Public Sector Finance Transformation programme.
How can transparency declarations help improve existing insights on public sector spending?
As part of our feasibility assessment, we built a prototype system for automatically collecting transparency reports, which we ran on a sample of 18 authorities. We have also evaluated timeliness and availability of data for 333 English authorities, as well as comparing it to currently published official sources of public sector spending information.
We have also established that the data can be linked to ONS business registers with a reasonable match rate. This is essential for allocating spend to industries or regions. We identified several key areas where transparency declarations could potentially improve public sector finance statistics:
- Higher frequency, more timely data.
- More granular breakdowns of spend.
- More informative geographic breakdowns.
It is important to note that in addition to producing new insights, transparency data can directly support quality assurance of existing statistics and provide additional context to help producers interpret input data.
Let’s look more closely at each potential area for improvement.
1. Higher frequency, more timely data
There is potential to use transparency data to prepare timely estimates of quarterly or even monthly spending by local authorities.
We have manually and programmatically reviewed sources of transparency data to assess availability, as well as frequency and lag of reporting. We found that overall English local authorities publish data with good availability and frequency.
Data availability for devolved administrations is much lower as they aren’t covered by the same transparency guidance. This is why we focus primarily on English local authorities in the rest of the analysis.
To assess reporting lag, in early September 2022 we conducted an exercise to manually check the date coverage of transparency declarations published by 333 local authorities. While authorities are only required to report on a quarterly basis, around three quarters of authorities choose to report monthly.
From investigating the latest available reports for the fiscal quarter (April to June 2022) preceding our September survey, 75% of authorities (251) had already published information on the entirety of the quarter, and even more had submitted data for April and May (Table 1). Due to this monthly reporting, there was already data for the current financial quarter, with nearly 44% of authorities already providing transparency declarations for July.
Table 1: Number of local authorities who had published transparency declarations covering each month of Q1 Financial Year Ending (FYE) 2023 (April to June 2022). As at review in September 2022.
| Data relating to | Number of authorities |
| April 2022 | 287 |
| May 2022 | 278 |
| June 2022 | 251 |
In comparison, the earliest estimates from quarterly revenue update (QRU), previously quarterly revenue outturn (QRO), come around 60 days after the end of the quarter. Currently QRU reports cover the first three quarters of the financial year.
There isn’t a fourth quarter (Q4) lag to compare to as QRU is not produced for Q4 of the financial year. The Department for Levelling Up, Housing and Communities (DLUHC) intends to partly address this by introducing a fourth-quarter estimate in QRU return for the third quarter of the financial year.
As things stand the lag for transparency data is much shorter than the reporting lag for the final whole year estimates, which are not available until on average 9 months after the end of the period. Final data on revenue outturn are typically published in December following the end of the financial year in April.
Our study suggests transparency declarations could be used to provide early estimates within around 3 months, considerably quicker than the existing reporting lag for Q4 financial year estimates and final whole year estimates.
Figure 1 further illustrates the timeliness of transparency data for local government. The figure shows data for a random sample of 10 English authorities comparing spend as declared in transparency reports and available official data.
At the time of writing, late September 2023, we already had data until March 2023 for all authorities and for most authorities we had data for April to July 2023, whereas data for April to June 2023 was just recently published in QRU and final estimates for 2022 to 23 financial year were not available yet.
Figure 1: Comparison of transparency data with available official statistics for a combined sample of 10 local authorities.
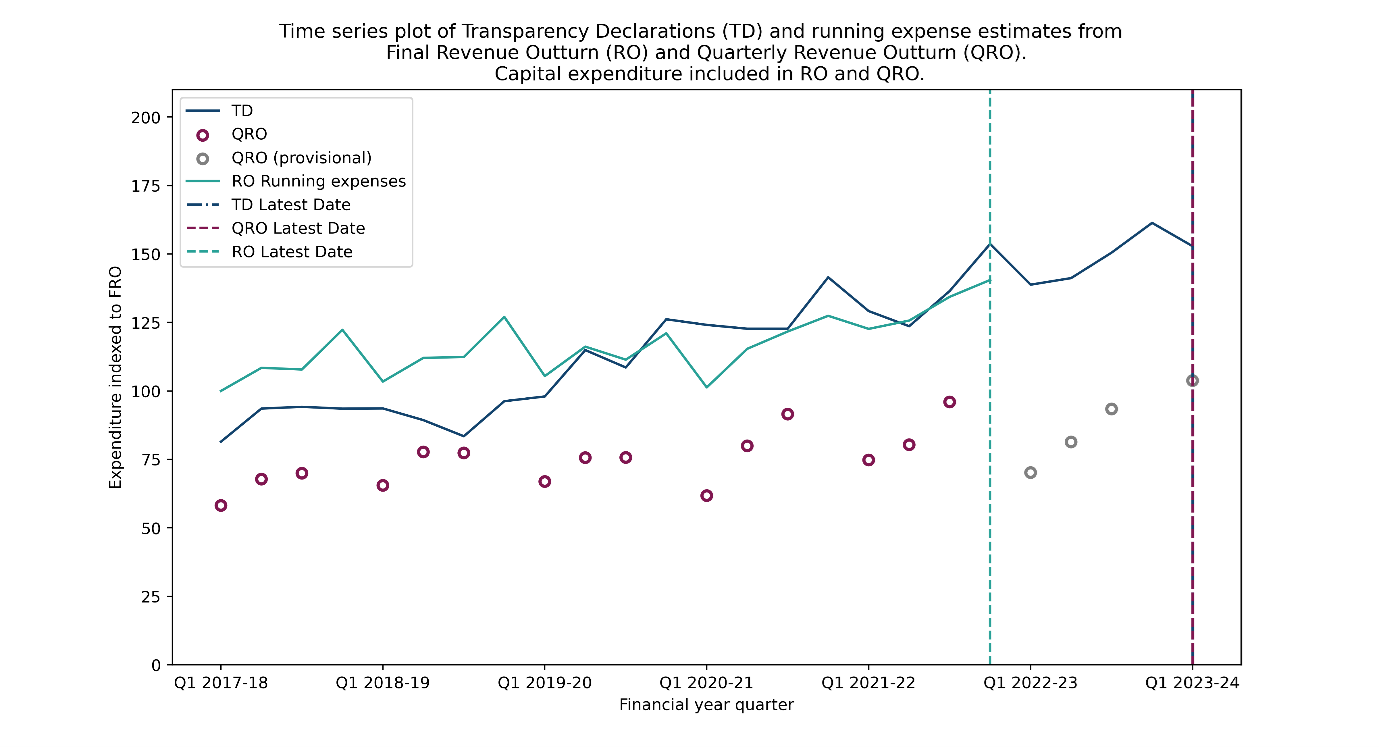
Figure 1 notes:
- Several local authorities from the sample were dropped due to lack of data over the course of the whole time series or where it was particularly challenging to separate the types of transactions not reported in DLUHC submissions.
- Final Revenue Outturn (RO) provides an estimate of annual total of expenditure, which was evenly divided into four quarters for the purposes of this figure.
- Staff costs estimates were removed from Quarterly Revenue Outturn (QRO) figures.
- Transparency declarations will contain capital expenditure figures, which is why quarterly capital expenditure was added to RO and QRO.
- QRO data points appear to be lower than RO because QRO contains receipts and other income, which is not separately reported.
- For FYE 2023 and FYE 2024 we don’t yet have estimates for staff costs. We provide provisional estimates for Q1 to Q3 2022 to 23 using staff costs from the last year for which this data are available.
In addition to timeliness, we have also evaluated the correspondence between transparency data and official publications. It is worth noting that these data sources have different coverage and definitions, so we would not expect them to be completely synchronised.
However, we still find that the datasets have a reasonable level of correspondence. Broadly speaking the annual expenditure from the unadjusted transparency data are somewhat similar to the total running expense data published by DLUHC for the large local authorities in our sample (Figure 2).
Figure 2: Correspondence between transparency declarations total expenditure and total service running expenses combined with capital expenditure (final outturn) from DLUHC.
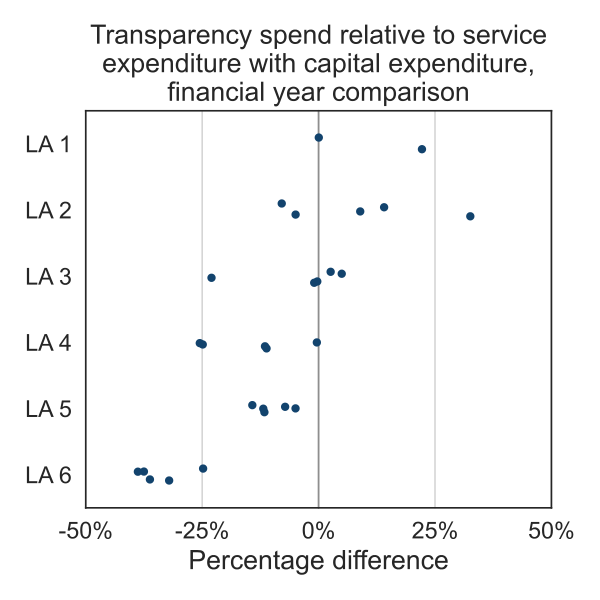
Figure 2 notes:
- This comparison does not include any adjustment to take account of the different reporting coverage of transparency declarations and outturn data.
- Each point represents a financial year for one of the larger local authorities in the sample.
- Local authorities from the sample were dropped where it was particularly challenging to separate the types of transactions not reported in DLUHC submissions.
- Covers five financial years (FYE 2018 to 2022).
- Data availability issues with one authority, missing three financial years.
Detailed categorisations of spend, and an understanding of types of transactions in the record level data are needed to make direct comparisons to other data sources. The differences observed could be caused by a number of factors including capital spending, Housing Revenue Account expenditure, Covid-19 support payments, grant payments and intra-government transfers of funds that are not expenditure.
Assuming these were adjusted for we still wouldn’t expect perfect correspondence due to differences in accounting basis, typically official sources use accrual rather cash basis. Overall, we find that transparency declarations offer potential for generating early estimates of quarterly spend by local authorities.
2. More granular breakdowns of spend
For analysis of salient issues and quality assurance for existing publications it is useful to see the breakdown of spend by category. For instance, this can help to understand trends in spending on key services like Social Care and Education. This is particularly relevant for understanding how authorities respond to changes to their forecast budget.
Allocating expenditure to a category, such as the Classification of the Functions of Government (COFOG), can essentially be done in three ways:
- using explicitly labelled data from the local authority
- manually inferring the category from other fields
- automatically inferring the category from other fields
While some local authorities label transactions by their category many do not. To be able to allocate a high proportion of expenditure for the remaining authorities a mixture of automated, model based, allocation and manual checking are likely to be necessary.
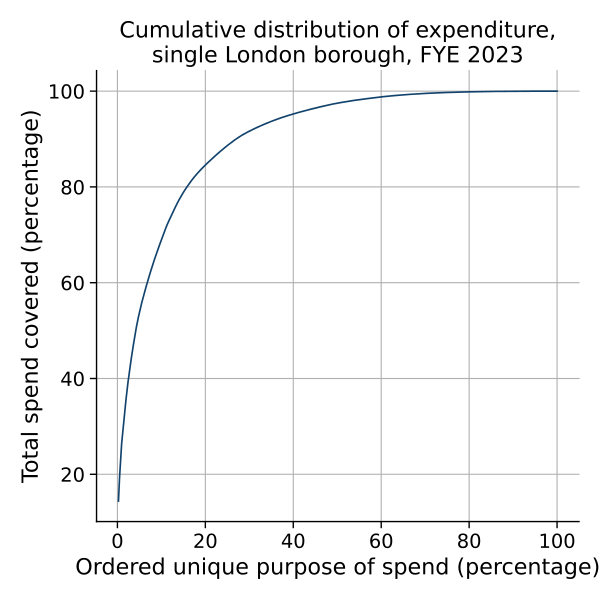
A large proportion of spend is accounted for by a small proportion of transactions. This is true for various groupings of transactions, say by purpose or beneficiary, and makes the problem of allocating and checking a high proportion of spend possible without exhaustively checking every record in the dataset. Focusing efforts on correctly allocating the largest contributors to overall expenditure will go a long way.
See Figure 3 for a visualisation of the concentration of expenditure; in this instance manually checking the top 200 organisation unit/purpose combinations would be sufficient to cover around 90% of expenditure for a London borough.
Figure 3: Concentration of expenditure by purpose for a London borough.
Relatively simple automated methods of categorising expenditure are likely to perform well. While there isn’t a standard set of information provided by local authorities there is overlap in the language used and the way transactions are described.
This comes from similarities in the organisational structure of local authorities, and ways of recording expenditure. For example local authorities may use standard classifications such as the Service Reporting Code of Practice or ProClass. Rules based methods, or models based on keywords are likely to work well in this context.
As an example, consider the case of capital expenditure. Four of the local authorities in our sample explicitly label capital transactions. This allows us to look at keywords from a range of text fields that are often associated with capital expenditure.
Simple terms appearing anywhere in a text field are often enough to correctly label a capital transaction. For example, terms such as capital, balance sheet, and grants are much more likely to appear in descriptions of capital transactions.
3. More informative geographic breakdowns
Transparency data might also give us an opportunity to better understand geographical distribution of expenditure. The idea here is to link suppliers in transparency data to a business register and use address information to allocate each transaction to a geographic region.
We would then be able to estimate for the first time where local authorities spend their money. There is a broader question about whether registered addresses are sufficient for appropriately allocating expenditure to a geography, but this could be a good step towards the goal of better understanding the full regional impacts of public sector spending.
As an exercise we linked transaction data from a sample of local authorities to the ONS Business Index, which is built from data including Companies House and two main other administrative sources: Value Added Tax returns (VAT) and PAYE.
The Reference Data Management Framework (RDMF) team within ONS conducted the linkage exercise for over 90,000 unique suppliers in our sample. In most cases the only field to match on is the supplier name, which makes matching and checking harder than cases where other fields are available.
The achieved match rate of 60% is equivalent to 70% of expenditure covered. There is a big difference in performance between assumed corporate entities (i.e. those with a Companies House registration) and assumed non-corporate with match rates of 90% and 37%, respectively. It is likely that linkage rates could be improved from this through adding in data sources on non-corporate entities and relaxing constraints around non-exact matching.
Initial data linkage results are promising and indicate that geolocating large proportions of expenditure is possible. There are limitations to this approach, such as head office effects and issues with linkage for non-corporate entities, both of which have the potential to introduce bias. These would need to be assessed and mitigated against in any future work.
Non-statistical applications
Transparency data can also be used to improve intelligence on public spending. For example, it would be possible to analyse local authorities with shared suppliers and build an understanding of the underlying supply chain network.
Some specific applications of this analysis could include assessing resilience of supplier networks, creating up to date insight into key providers of public services, and providing another way of looking at government procurement.
Summary
Overall, transparency data are a promising data source offering opportunities to improve official statistics and intelligence on public sector spending. At the same time there are significant challenges to collecting, standardising, and processing these data at scale.
We are currently supporting stakeholders, such as ONS Public Sector division, in assessing whether and how to use this data source going forward. If you work in the public sector and can see ways that access to these data could be useful to you then please get in touch.