Big fish, little fish – understanding local economies using interactive visualisations
The Office for National Statistics (ONS) publishes economic information at both a national and regional level on a regular basis. Steven Hopkins, one of our data scientists at the Data Science Campus explains how there is a growing appetite for more localised information to support policy-makers in their strategy and decisions.
Understanding local economies using interactive maps and Sankey diagrams.
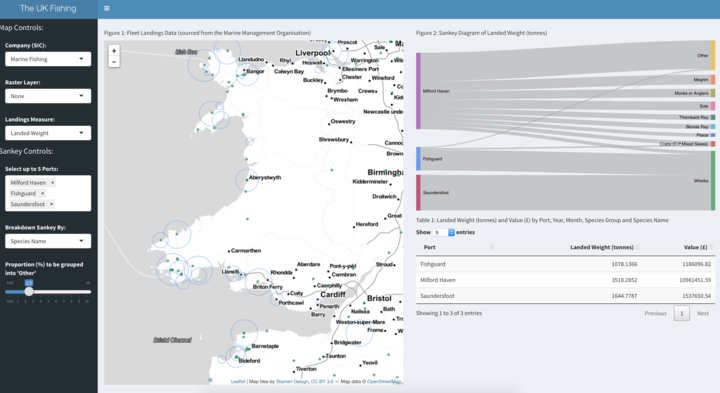
To meet the thirst for more local data, we have developed a visualisation tool, (Fig. 1) which combines information collected by ONS with open data to explore the fishing industry in the UK interactively, without identifying individuals or businesses. The project has explored how visualisation can be used to paint a more detailed picture of different geographical data without disclosing sensitive information.
The prototype uses information on the UK fishing industry to explore its impact on small coastal regions. We chose the fishing industry as a case study to support a wider project by the Department for Environment, Food and Rural Affairs (Defra) that aims to assess the economic and social impacts of the UK fishing industry on coastal communities. The approach and code can also be adapted for application to other industries.
What do we know about the UK fishing industry?
We needed data sources with excellent coverage in order to reach the desired level of granularity. ONS’s Inter-Departmental Business Register (IDBR) is a comprehensive list of businesses used by the government for statistical purposes. It covers 2.6 million businesses in all sectors of the UK economy, although it does not include very small businesses that are not registered for VAT or PAYE, and some non-profit-making organisations. For each of the 2.6 million businesses, the IDBR holds information on:
- turnover
- employment
- Standard Industrial Classification 2007: SIC 2007
- lower-layer super output area (LSOA) – data zones (DZs) in Scotland – these define statistical geography with approximately 1,500 residents in each area
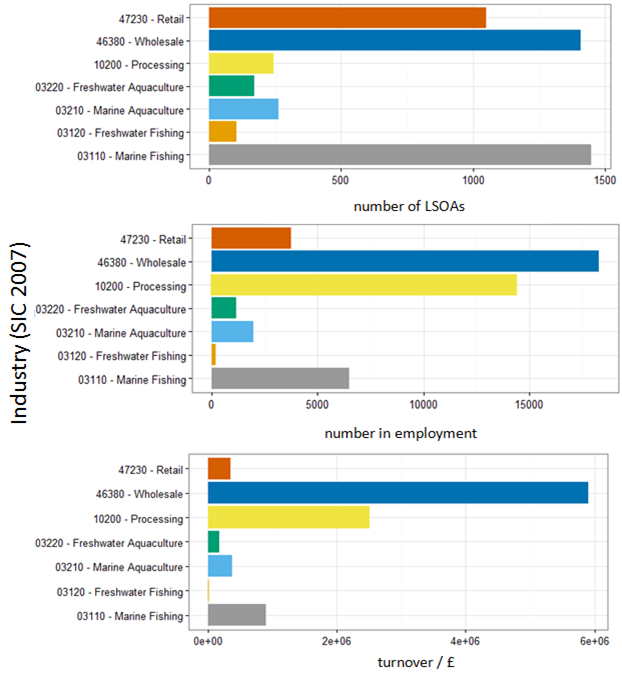
Figure 2 shows some summary statistics for the UK fishing industry, derived from the IDBR information. It’s clear that the wholesale trade dominates the fishing industry in terms of employment, turnover and number of businesses. Marine fishing activity, however, is present in a slightly larger number of LSOAs than wholesale of fish, but has a much lower total turnover and lower total employment – although it should be remembered that the IDBR does not includes very small businesses, so it i’s possible that this is an underestimate if marine fishing is carried out by those not registered for VAT or PAYE. The same could apply to any of the fishing sub-sectors.
The second very detailed dataset we’ve used was the UK fleet landings and foreign fleet landings into the UK by port, 2015, Marine Management Organisation.This includes details on the volume and value of fish and marine species landed at UK ports by species, port and vessel nationality. This allows us access to the relationship between the IDBR variables and the fish being landed at a local level.
Companies House
Companies House publishes open data on registered companies. Because it is open data, we have been able to use the addresses of companies that are classified to the fish production industry to show the location of company headquarters at postcode level.
Creating economic indicators
We prepared the data for non-disclosive visualisation, by:
- constructing two composite indicators from the IDBR variables, for each LSOA and fishing sub-sector
- employment proportion – the proportion of total employment that is employed in the fishing industry
- turnover per employment – a crude indicator of productivity
- ranking (rank = 1 is the lowest rank) the LSOAs (or data zones in Scotland)
- grouping the LSOAs into deciles
- creating 2D weighted kernel density plots – these show the concentration and spread of the relevant indicator
The UK fishing industry dashboard prototype
We created a prototype of the visualisation in Shiny. This is a package for the R language, which provides a framework for developing web-based “apps”. Shiny has the ability to embed widgets from other web-based components such as Leaflet, an open-source JavaScript library for interactive maps, and GoogleVis, a visualisation tool. This allowed us to create interactive mapping and the Sankey diagrams.
There are two main components of the visualisation app, the map widget and the Sankey diagrams.
Map widget
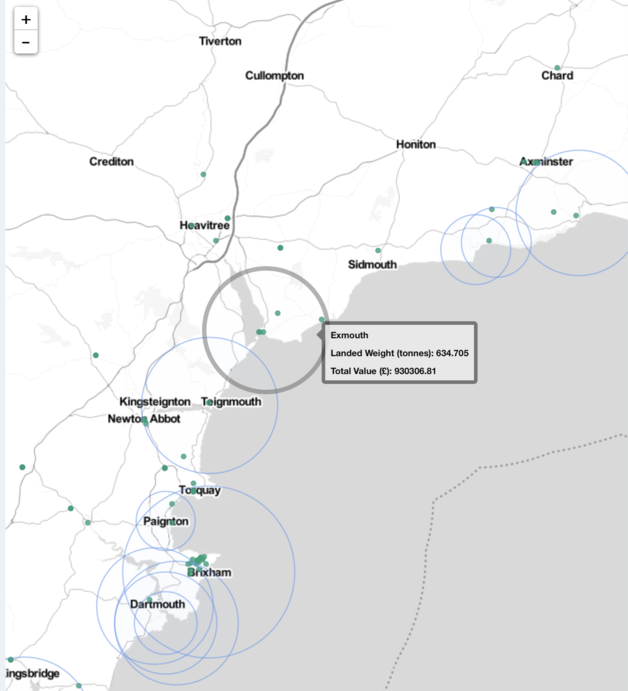
The map widget (figure 3) is from the leaflet package and embeds an interactive map into the dashboard. Users can scroll and zoom to different locations. The leaflet allows several layers of data to be included on top of the map. In this prototype two data layers have been included.
The first data layer shows a series of solid circles at locations across the UK representing one of the production industries’ headquarters. These circles can be changed to show marine fishing, freshwater fishing, marine aquaculture or freshwater aquaculture industries.
Data source: Marine Management Organisation, Companies House and Office for National Statistics
The second data layer is presented as blue rings. These label UK ports, where the radius of the ring is proportional to the measure chosen using the control panel. The default measure is landed weight of fish and this can be changed to represent the monetary value of landed fish. These measures are totals for 2015.
The map widget allows data layers to be reactive so that users can click on data items to perform some action. For this prototype, clicking a port will add that port to the Sankey diagram.
Several kernel density profiles have also been included as raster layers on the map widget. By selecting an industry from the “Raster Layer” drop-down menu, the kernel density profile is overlaid on the map.
Sankey diagram
The Sankey diagram (figure 4) allows users to compare port-level activity by constructing a chart by either clicking ports on the map or using the look-up box in the controls. A port is added to the left hand side of the chart. By default, the right-hand column shows species of fish that are landed at the ports and the width of the band joining a port to a species of fish is proportional to the chosen measure (either landed weight or monetary value).
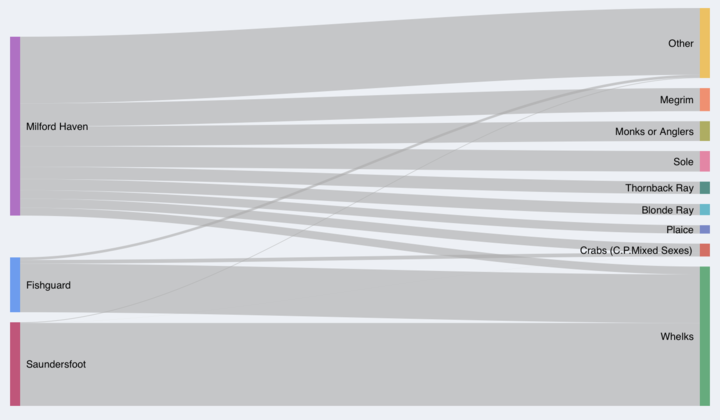
Data source: Marine Management Organisation
The variable on the right-hand side of the Sankey diagram can be changed to another available variable by selecting it from the “Breakdown Sankey By” drop-down menu that appears once a port has been selected. For example, you could use this to see the value of fish landed split by the vessel nationality.
In some instances, especially when looking at species of fish, there are too many categories and the Sankey diagram becomes difficult to interpret. Therefore, a slider has been included in the controls to group together items that fall below the prescribed threshold, thereby restoring the aesthetics of the Sankey diagram.
What have we learned?
The main findings are:
• visualisation can help to communicate useful information at a granular level, without being disclosive
• but there is a hard limit to the resolution, which is dictated by privacy requirements
• Shiny is a good tool for visualisation and we encourage users to hack the code to produce your own local analyses!
The tool, the code, the data
All the code and instructions for the app can be found on the Data Science Campus Kamino Github repository. The accompanying non-disclosive dataset can be found in the repository and a hosted version of the app is also available.
If you are interested in learning more about this project or would like to get involved then you can get in touch via email or twitter.
One comment on “Big fish, little fish – understanding local economies using interactive visualisations”
Comments are closed.
I’m a Computer Scientist working on emerging technologies, so it’s refreshing and great to see the day to day use of data science, stats, R and AI to help inform and provide insight into everyday issues. The detailed methodology you provided in “big fish, little fish…” is very useful for experts/non-experts to develop thier own skills. In closing, thank you for the blog and your enthusiasm in explaining practical data science, please keep it up.