Bus reliability – analysing the morning travel peak across England

Introduction
Following publication of hyperlocal transport data in 2023, the Data Science Campus (DSC) have explored the feasibility of using open data to analyse local transport performance. In this publication we demonstrate how to produce hyperlocal bus service coverage and punctuality metrics. A related project will be published soon on using open data to compare urban centre transport network performance internationally. Both projects complement each other and demonstrate our commitment to innovative, accessible insights through applying modern tools to open data.
The Bus Open Data Service (BODS) provides real-time location data for public service buses across England (Equivalent real-time bus location data services are planned for Wales and Scotland over the next few years.) By combining this with the timetable data, also published daily by BODS, we can begin to build a picture around morning peak service coverage and punctuality.
For those involved in infrastructure and strategy, this can be highly useful where investment and/or operational decisions are to be made. For users who rely on the bus network to get from A to B, this can also shine a light on how the service in their area compares with another.
We have produced some experimental metrics at Lower Super Output Area (LSOA) level (between 400 and 1,200 households). These granular metrics are presented here by month, but they are processed daily, providing opportunities for high frequency updates on local transport performance over time. Additionally, raw stop-level metrics (not provided here) can be aggregated readily to any geography for which boundary files exist, also presenting the possibility for bespoke analysis.
Users should be aware that these metrics have a number of limitations and results may be sensitive to specific decisions taken around methods. Please note that regular statistics on bus services (currently to 2023) including reliability at Local Authority level (average 75,845 households, 2021) are published by the Department for Transport (DfT). Local authorities and bus operators can also access similar data via dashboards in the free Analyse Bus Open Data Service.
In order to facilitate the development of these metrics, and to be clear on the strengths and limitations of both the data and methods, an open code repository is available to illustrate our data ingest and processing workflows.
Although we chose to focus on LSOA-level metrics, perhaps the most meaningful geography for local decision-makers and bus users in our communities, the code builds from stop-level which allows for the reaggregation of metrics to any geography level for which boundary data is available. Updates to the codebase are ongoing but we would welcome feedback, suggestions and collaboration to further develop this offer.
Collecting the data
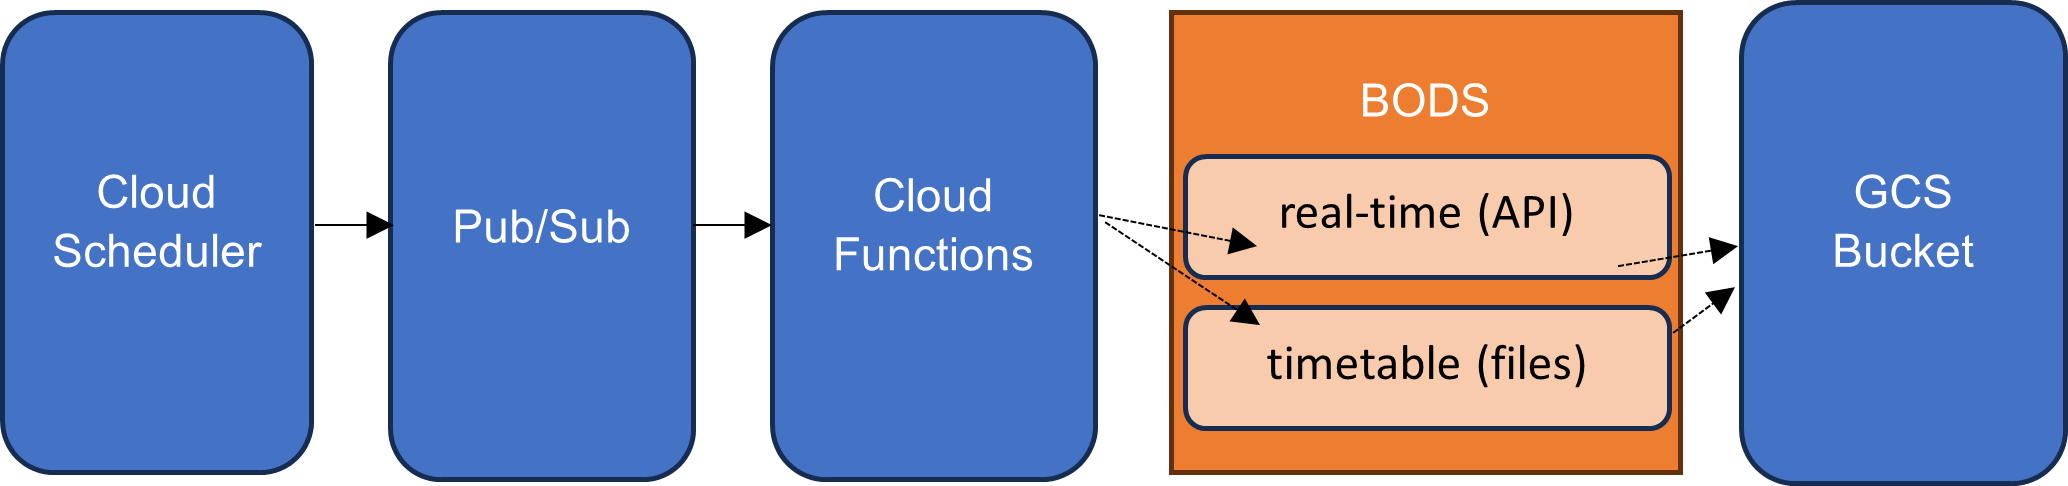
From September 2023 onwards, we have used Google Cloud Platform (GCP) to automate the ingest of both real-time and timetable data. This process included London data from early 2024. Typically, we have ingested 5 gigabytes of real-time data and 650 megabytes of timetable data daily (both based on weekday volumes). The process of scheduling and executing data ingest, plus the persistent storage of ever greater data, currently costs around £2 per day (at the time of writing).
A flow diagram of our data collection workflow is shown in Figure 1.
Real-time
Updated bus location data were collected every 10 seconds for the whole of England. We limited data ingest 7am to 10am only (7 days per week), defining events in Cloud Scheduler at 5-minute intervals between 7am and 9:55am. (Note: cloud functions are currently limited to a total running time of 9 minutes 59 seconds (including all post-processing, data export etc).
At each event, Pub/Sub is used to trigger a function in Cloud Functions. Each function contains a Python script which executes a call to the BODS API every 10 seconds, with ingested data concatenated and pushed to a Google Cloud Storage (GCS) Bucket as comma-separated values (.csv) files. Given the size limits on each call to the BODS API, we divided England into 3 region groups, ensuring full coverage across simultaneous calls.
Timetable
Daily updates to the known scheduled services are available across all regions in England. We ingested updated timetables for all regions, at 7am each morning, routinely.
Figure 1: Data collection workflow using GCP tools.
Aligning real-time and timetable data
In order to align real-time activities with timetabled ones, we require a number of common features relating to the unique journey, time and next stop.
Figure 2: Illustration of fields available in real-time and timetable data.
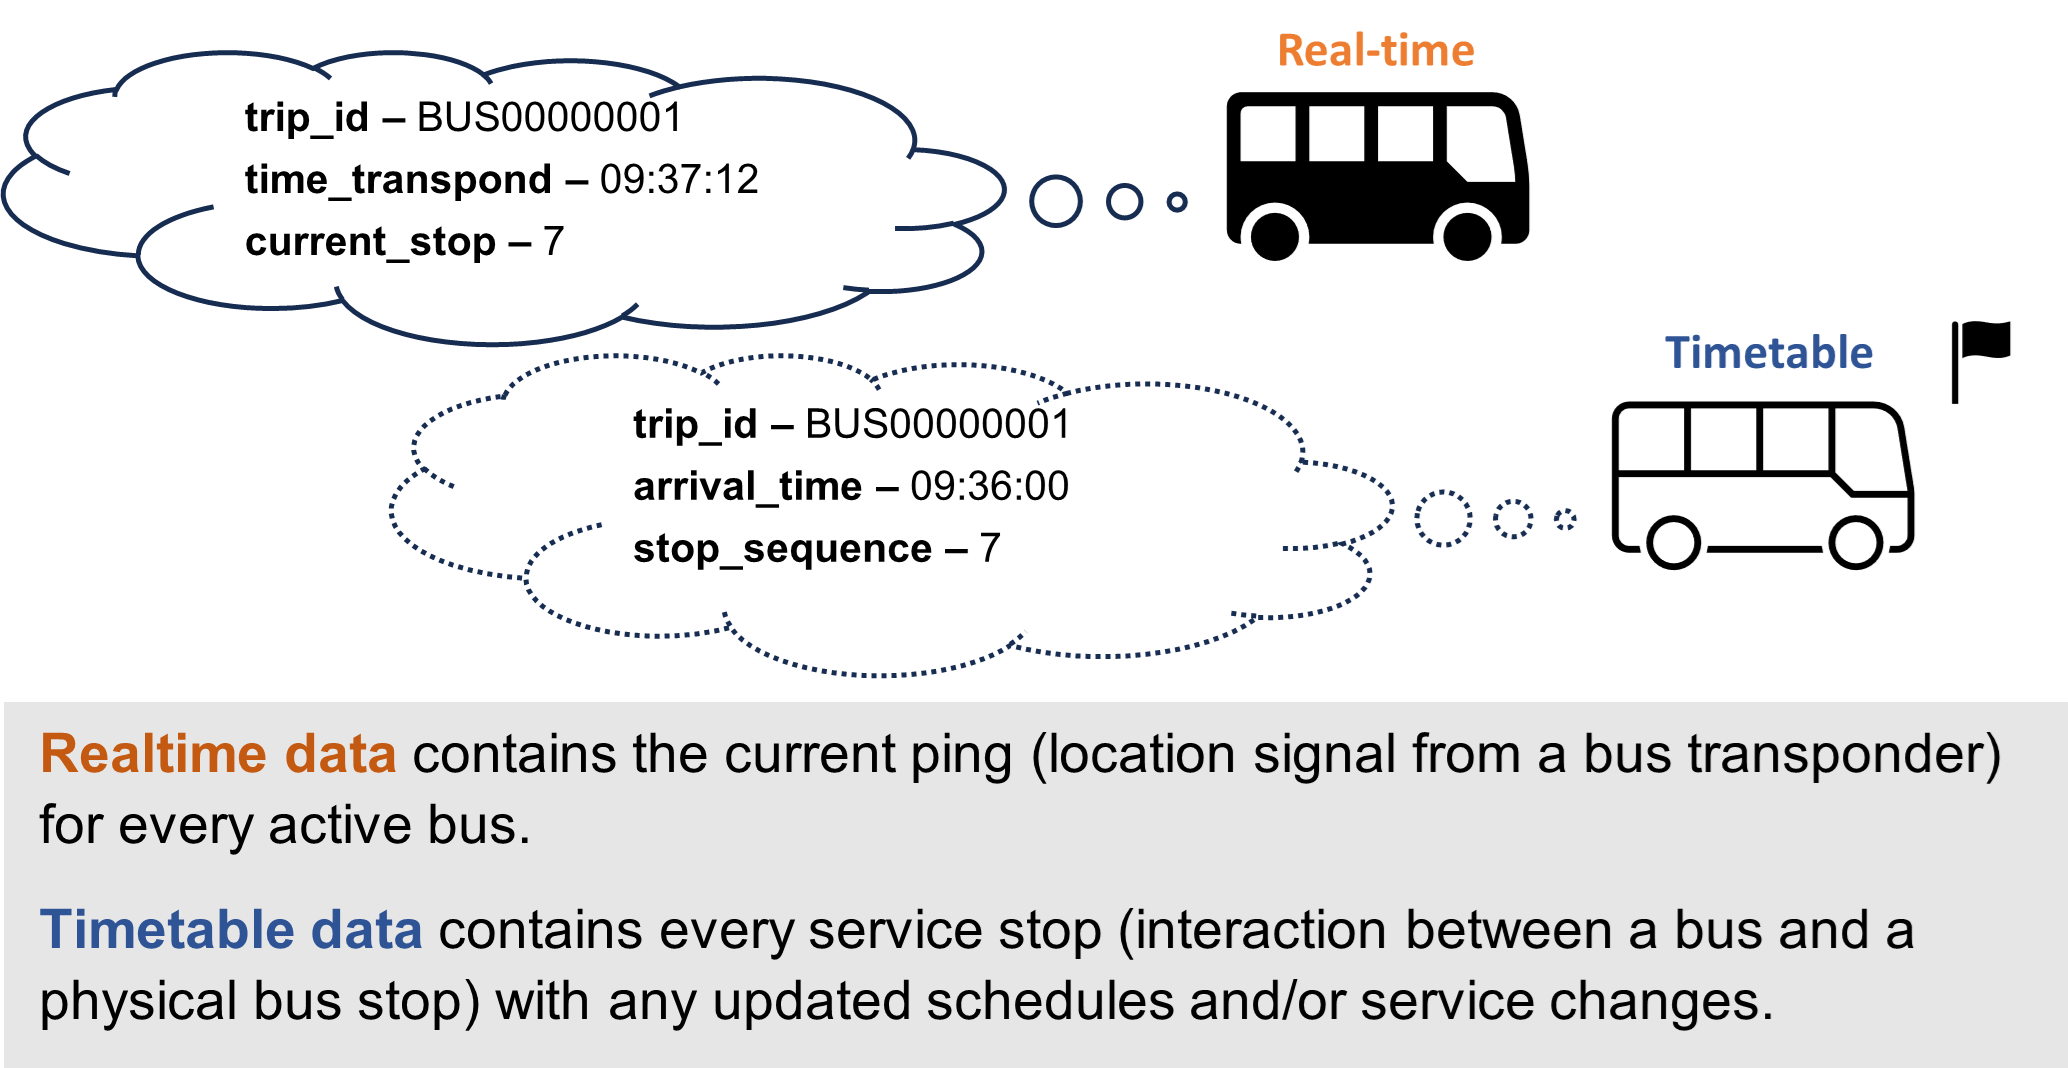
The ‘trip_id’ , common to both real-time and timetable data, allows us to identify a unique bus journey. A later journey involving the same bus, and operating the same route, would be assigned a different ‘trip_id’.
The ‘stop_sequence’ (timetable) indicates a stop number. The ‘currentstop’ (real-time) references the same stop number that a bus is travelling towards.
The ‘arrival_time’ (timetable) is the time a bus is scheduled to arrive at a stop. The ‘time_transpond’ (real-time) is the time attributed to the location signal transmitted from a bus transponder. In this project, we accept the last ping attributed to a stop to be the ‘best-fit’ real arrival time.
Although we are able to align much of the real-time and timetable data in this way, it is worth noting that not all real-time data is fully labelled thus preventing a straightforward match. There are also examples of ‘trip_id’ in the timetable data that are not identifiable in the real-time data.
It is known that, despite legislation mandating it, BODS does not include all timetabled services at this time, nor does every timetabled service have working equipment that would allow a real-time location to be transmitted. This, in addition to the existence of imperfect matching, means that any analysis completed will only represent a sample of services. This sample is likely to be skewed geographically in a non-random way.
‘route_id’, ‘service_id’ and ‘agency_id’ are also useful attributes of bus events, allowing for other flexible analyses.
Methods and approach
Due to the complexity of the data, and coverage gaps, we needed to make a range of decisions around the use of the real-time data. These are set out in Table 1 below:
Table 1: Record of key decisions made by the development team.
| Decision | Rationale |
| Reject all rows of data where no ‘route_id’ or ‘service_id’ is provided. | It is unsafe to associate real-time events with timetabled events without sufficient information. Although ‘trip_id’ is useful as a primary key, at least one additional field is required to make confident and robust matches. |
| Only accept real-time events that can be readily associated with timetabled events. | While a future body of work might allow for some matching where data is incomplete, we recognise that there are inconsistencies and caveats that would need to be addressed to engineer these additional matches. |
| Include only bus activity at stops in England. | Inevitably, services to and from England will cross borders with Wales and Scotland. We only have real-time data for services operated from England. We acknowledge that there are likely to be services operated from outside England which service LSOAs near its borders especially. |
| Consider punctual (on-time) services to be running between 1 minute early and 5 minutes 59 seconds late (relative to the day’s timetable). | This is the current convention for determining services running ‘on-time’ as prescribed by DfT. |
| Reject rows associated with active services approaching their next stop immediately prior to 10am. | As we only collect data from 7 to 10am, a service indicated as moving towards its next stop at 10am is not necessarily as close to the stop as it might be at 10:01am, for example. Consequently, we refrain from using these in our statistics. |
We employed dask to process our large datasets, transforming real-time data (as described above), combining it with timetable data and compressing to parquet format ready for final re-aggregation by selected geography and date range.
Using boundary and lookup data from the ONS Open Geography Portal, we assigned an LSOA label to each physical bus stop based on its coordinates in the timetable data and removed stops in Wales and London. Consequently, every service stop can be captured and reaggregated to any geography (LSOA in our case).
Results and limitations
We have published monthly and combined metrics for each LSOA over the period 1st October 2023 to 30th April 2024 for all bus activity in England (outside London) and 1st February to 30th April 2024 for England (including London). These experimental metrics are available here. Punctuality rate captures the average punctual flag (binary) for all stop-level activity in the morning peak within a given geography.
In this instance, significant caution must be exercised given the heterogeneity of LSOAs, such as the differences in landscape, density of population, other transport links and population demographics, contributing to coverage and reliability to different degrees. Further, other limitations should also be borne in mind, some of which are listed below:
- Metrics are generated solely on daily bus activity (actual and scheduled) between 7am and 10am.
- Variation in the coverage and labelling of real-time activity across regions and bus operators.
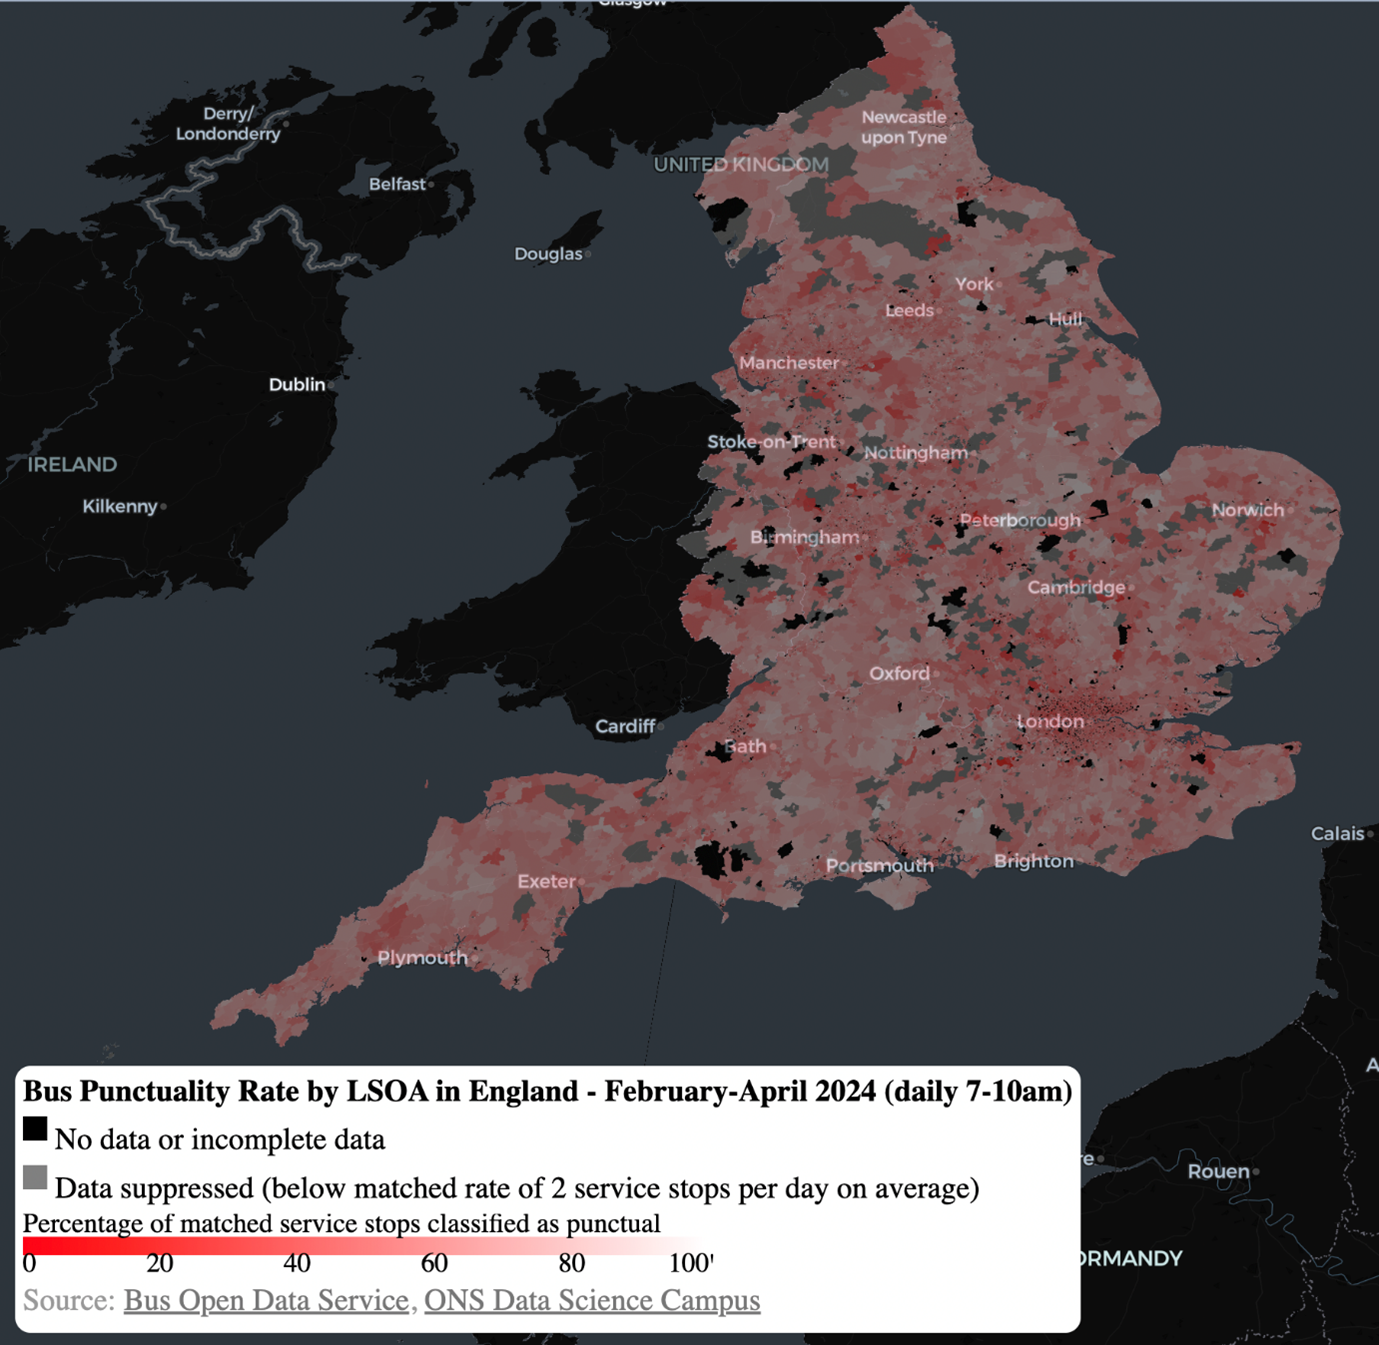
Figure 3 illustrates the average morning peak punctuality rate across all stops within LSOAs in Northern England. (Some LSOAs are shaded black, indicating that no real-time data is available. LSOAs shaded in grey have average matched activity of less than one service stop per day; this data has been suppressed. While rurality is undoubtedly a factor in some cases, incomplete real-time data does seem to be a greater issue in some locations.)
Figure 3: Choropleth map showing morning peak bus punctuality rate by LSOA. (Interactive version here)
Comparisons with existing DfT Official Statistics on punctuality are not easily achievable for these new data. This is largely because of differences in the geography used (local authority level) and the need to calculate averages across multiple LSOAs to generate similar results. Further, caution should be exercised when interpreting estimates for areas where a low proportion of services have been matched.
Both the number of timetabled service stops and matched service stops (timetabled activity evident in real-time) are provided for additional context. Furthermore, we have suppressed data for all LSOAs with an average activity of less than two service stops per day. These points should be considered when interpreting the estimates provided.
Further applications
We hope that the codebase in the open repository will be useful to other developers looking to produce metrics on bus service reliability to aid policy making or operational decision making. We would very much like to hear ideas for both future development and collaboration. We plan to make further improvements to the codebase over the coming months.
While there are examples of aggregating across a range of geographies in the repo, analysis of stop-level punctuality itself may also allow for better insights around friction in the network. Does one location have a higher propensity for delays than another, for example?
Additional fields in the raw data also present opportunities for multiple other analyses and insights:
- performance comparison of bus operators along shared routes
- seasonality
- excess wait time, for example how a user’s typical wait at a stop compares to the timetabled wait (over time)
- evaluation of service performance before and after an event (for example, a change of bus operator).
Please contact datasciencecampus@ons.gov.uk for more information on this project or any of our other projects.