How green is your street – visualising the urban forest
Over the last year, we have developed an experimental method for estimating the density of trees and vegetation present at 10 metre intervals for all 112 major towns and cities in England and Wales. In September 2018, we published the full report in to our work.
Our approach used images sampled from Google Street View as the input to an image segmentation algorithm, allowing us to give a percentage value of vegetation for each side of a 10 metre section of road.
One of the outcomes of this work was a high-resolution dataset describing vegetation across the entire city of Cardiff, covering 220,000 sample points. Subsequently, data for the neighbouring city of Newport has also been generated.
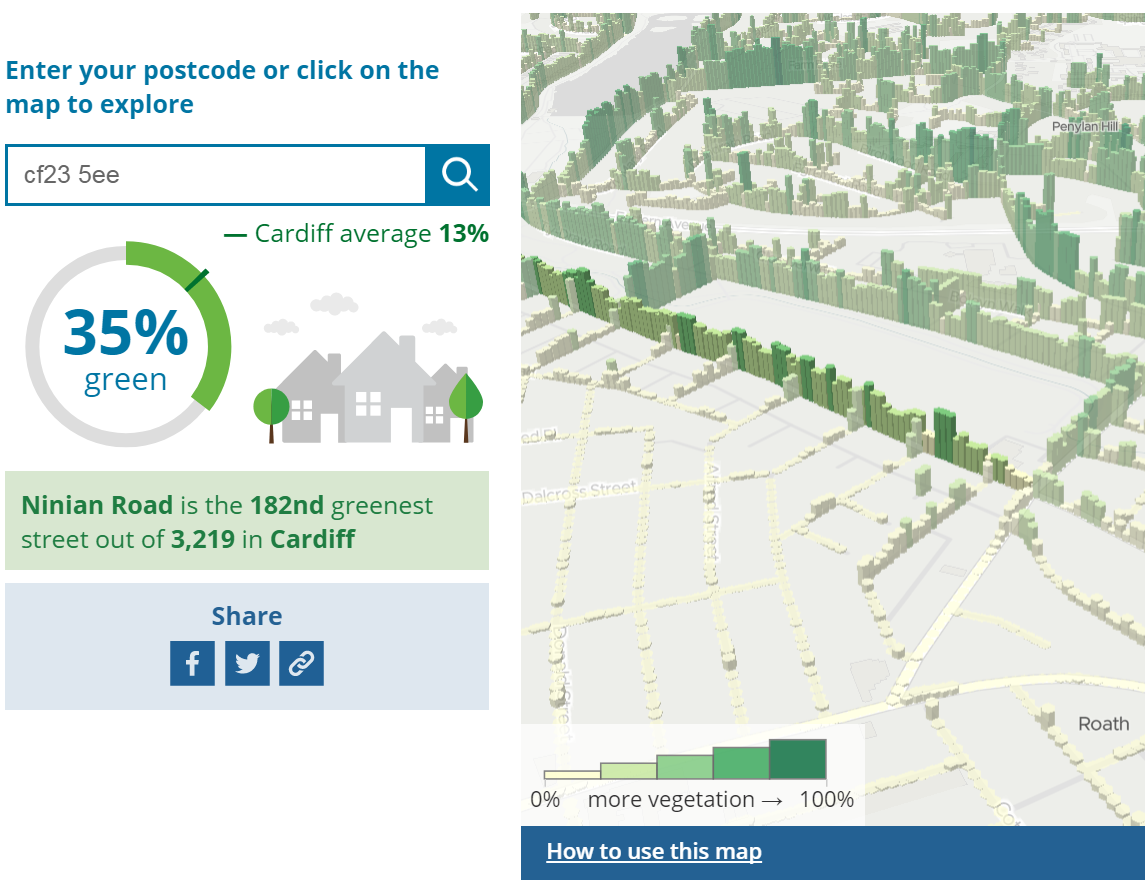
Today, Office for National Statistics (ONS) have published an interactive article using this data, enabling Newport and Cardiff residents to answer the question “How Green Is Your Street?”.
Users can enter their postcode to see how their street compares with the city average, or click the map to roam between areas.
The article also summarises the main trends across the two cities, and looks to answer the question “which areas of Cardiff and Newport are the greenest?”
This has been published on the ONS website today. Head over to explore the data, or find out more about the trends across each city.
For more information about the project and future plans, please contact the Data Science Campus.