Using machine learning to predict energy efficiency

The link between greenhouse emissions and the climate crisis is well documented. 2018 Greenhouse Gas Emissions, provisional figures collated by the Department for Business, Energy and Industrial Strategy (BEIS) report that 18% of greenhouse gases are released by the UK residential sector, and come predominantly from heating homes.
Welsh Government has set decarbonisation targets to bring benefits for people and the environment. Amongst these targets is an ambition to reach net-zero carbon emissions by 2050. As stated in Prosperity for All: A Low Carbon Wales, for this initiative to succeed, buildings will need to operate at close to zero emissions by 2050. Evidence is needed to evaluate the main policies that contribute to this target, energy efficiency being one.
Current rules require homes to have their energy efficiency measured at the point of construction, sale or letting. Not all homes have gone through one of these processes since the rules were introduced, therefore information about energy efficiency is not available for around 53% 1 of domestic properties. This report outlines work carried out by the Office for National Statistics (ONS) Data Science Campus (the Campus) to predict the energy efficiency of all domestic properties in Wales. A measure of energy efficiency in this project has been taken from Energy Performance Certificates (EPC) in the form of the Energy Efficiency Rating (EER).
EPCs are created through a survey. Data collected from them contain a number of free text fields that are subject to some inconsistencies and biases. Steps taken to clean and prepare the EPC data are described alongside decisions taken to reduce the complexity within the data. Three different feature sets, denoted as data driven, domain driven and exhaustive, are created from the EPC data. In combination with the feature sets, a number of machine learning algorithms are compared. It is found the most accurate results are achieved through using the exhaustive feature set in combination with a XGBoost model. Here the model can explain 82% of the variance in the EER tested on a randomly selected set.
Analysis of the most predictive variables within the EPC dataset reveal the most predictive variables all relate to:
- the size of the property
- total floor area
- floor height
- number of habitable rooms
- extension count
However, it is suggested that the predictive power of the model does not come from any particular variable rather that each feature adds small incremental levels of information.
To predict EER scores for properties not covered by the EPC dataset, alternative datasets are sourced and explored. The list of EPC drivers identified during the model build is used to focus the list of replacement sources. A new feature set is derived from these datasets. Although many of the original features are replaced, it wasn’t possible to find sufficient alternatives for all fields. The predictive power of the XGBoost model with proportion of variance explained in the test set then drops to 40%, significantly lower than the model using the original features.
These results emphasise the importance of obtaining relevant data when applying machine learning techniques for imputing missing values. The report concludes with a discussion on how this work can be extended to derive further features.
1. Introduction
Welsh strategies and policies relating to housing, such as fuel poverty, aim to improve the living conditions by making homes warmer, higher quality and cost-effective. Closely linked to these factors and therefore an area of interest to the Welsh Government is energy efficiency. Lower ratings of energy efficiency in Welsh homes, leads to higher fuel bills and higher incidences of fuel poverty.
A recent independent review on the decarbonisation of Welsh homes gives seven recommendations for achieving the target of net-zero carbon emissions by 2050. Decarbonisation is the process of reducing the amount of gaseous carbon compounds released in, or as a result of, an environment or process. The actions underpinning these recommendations include all housing stock achieving an Energy Performance Certificate (EPC) band of A (the most efficient). This is a huge challenge; in Wales the average energy efficiency rating is D and less than 1% of properties have a certificate with a rating of A 2.
In the Better Homes, Better Wales, Better World report, the Advisory Group notes concerns with using EPC data but nevertheless considers they “have a role in understanding and assessing the energy performance of the stock as a whole”. As EPCs are only required when a property is constructed, rented or sold, a bias exists in the data. Most certificates have been created since 2008 and it’s estimated that 53% of properties in Wales do not have an EPC 1. The demographics of residents living in owner-occupied properties, which have not been constructed or sold recently and not covered by the certificates, is also unknown.
This report discusses the work carried out by the Office for National Statistics (ONS) Data Science Campus (the Campus) to address this gap in the evidence base and attempt to create a complete picture of the energy efficiency profile for all homes in Wales.
Policies often rely on evidence from surveys or admin sources based on a subset of the population. As surveys are traditionally expensive and limited in size, the subset who respond can be subject to bias or incomplete records. Attempting to make these datasets representative of the whole population is not a new problem and has been historically tackled in many ways.
Small area estimations (PDF, 1.47MB) combine survey results with data for the total population to derive variables of interest at a lower geographical area. ONS has a wealth of experience in this field. Working jointly together, ONS and the Department for Business, Energy and Industrial Strategy (BEIS) are exploring the use of small area estimations to derive figures on fuel poverty at Lower Super Output Area (LSOA) level in England. A summary of their early research provides analysis at the local authority level using a model based approach combining the English Housing Survey with multiple larger datasets from government departments such as HM Revenue and Customs (HMRC) and the Valuation Office Agency (VOA).
An early report from the Centre for Sustainable Energy highlighted the value of gaining energy efficiency data at representative, or lower level and recommended using Experian household level data to model ratings for homes without EPCs. Kolter and Ferreira used building features to predict total energy usage (electricity and gas) and found the models could explain 75% of the variance.
The method discussed here treats the problem as imputation of Energy Efficiency Rating (EER). Imputation is a challenge common to all data science projects and many solutions are available. This useful chapter on missing-data imputation emphasises the importance of first understanding the reasons behind missing values. In particular, whether the data is missing at random, which is not the case for EPC as properties not constructed, rented or sold recently will be absent. Within this chapter methods for performing imputation are described starting with the simplest. The use of machine learning to impute missing values is increasing, this summary of usage of machine learning in official statistics captures many applications. The Campus follows this approach where EPCs are imputed using machine learning algorithms to predict the missing values.
Footnotes
- This is calculated by taking the number of unique properties in Wales with an EPC (666,137), and the total dwelling stock estimate for Wales (1.43 million).
- This figure is calculated the number of unique properties with a band A EPC (1,142), divided by the total dwelling stock estimate for Wales (1.43 million).
2. Data
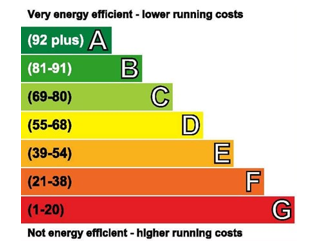
The Ministry of Housing, Communities and Local Government (MHCLG) is responsible for the EU’s Energy Performance of Buildings Directive (EPB Directive). The EPB Directive requires domestic properties to have an Energy Performance Certificate (EPC) when constructed, sold or let. Certificates may also be created as part of a green deal assessment. EPCs are used to measure the energy efficiency of a building with the overall efficiency captured through the Energy Efficiency Rating (EER). Figure 1 shows the breakdown of EER, which runs from 1 to 100. 100 represents the most efficient rating and therefore lower energy costs. EER is also commonly grouped into energy efficiency bands from A to G. A represents the most efficient scores. The calculation of EER is based upon the cost of heating the property, heating water and lighting. The calculation is adjusted for floor area and uses standardised assumptions for occupancy and behaviour, this allows prospective house buyers or tenants to compare across properties consistently. Upon completion, a survey is valid for 10 years.
Figure 1: Energy Efficiency Ratings
Data collected for the purpose of creating the energy efficiency certificates is the primary source of data for this project. The secondary sources are assembled from alternative datasets relating to domestic properties.
Energy Efficiency Certificates
At the start of this project, MHCLG allowed access to data from certificates up to 1 October 2016 to enable independent research into energy efficiency issues such as fuel poverty and climate change. The open dataset contained 15.6 million records with approximately 700,000 relating to Wales. This is the equivalent to 48% of the dwelling stock. MHCLG have since released an update which includes data up to the 31 May 2019. The EPC data contains 80 fields, a rich dataset with detailed information on property characteristics and energy usage including:
- EER and equivalent energy efficiency rating
- Unique building number
- Geographic information (region)
- Property characteristics (type, floor area, roof description)
- Utility descriptions (mains gas)
- Green energy provisions (solar panels)
- Energy costs
- Energy efficiencies
- CO2 emissions
- Unique Property Reference Number was also joined through address matching
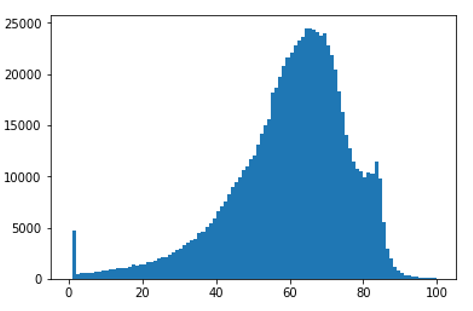
Figure 2 gives the breakdown of energy efficiency ratings for Wales. The distribution appears approximately Normal with most households falling into the middle energy efficiency rating (D) and very few properties with the most efficient rating (A).
Figure 2a: Energy Efficiency Profile for Wales Average
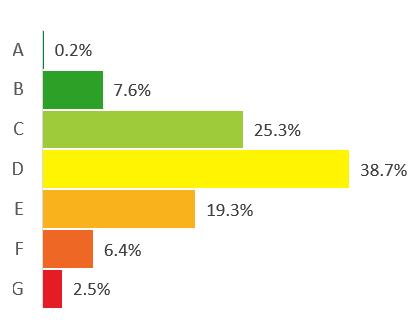
Figure 2b: EER in Wales is 60 which corresponds to band D
More information on the energy efficiency profile of England and Wales can be found in MHCLG’s experimental official statistics.
Due to the regulations regarding energy efficiency there is an inherent bias in the EPC data. As certificates are requested when a property is rented, sold or part of a green deal, any bias in such properties will exist in the data.
Data cleaning
EPC surveys are carried out by dedicated EPC assessors. Although there is strict guidance and software available for completing the calculations, in cases where the assessors cannot get access to the whole property, some measures would be estimated using experience. The robustness of the data also relies on the assessor correctly submitting the information. To promote consistency across assessments and improve the quality of the subsequent data, the following steps were taken to improve the quality of the data:
- variables with too many missing values were removed
- properties with invalid postcodes were removed
- values where the headings appeared as data values were replaced with “null”
- different variations of recording ‘missing data’ were standardised
- lighting and second heating descriptions which were muddled were moved to the correct field
- clipped values to be 0 or above
- clipped values to the 95th percentile or below
Despite these safeguards, several issues still remained with the data, including:
- missing values
- lack of consistency with surveys
- lack of standardisation of descriptions/responses
- nonsense responses
- certificates last for 10 years and could be out of date
- values estimated where an assessor could not enter part of the property
Variables which were dropped early in the modelling process were not processed further and so may be subject to other issues not covered in this report.
Feature reduction
Many of the 80 variables within the EPC data were removed as they are correlated (Pearson) to each other or contained a high number of missing values. Keeping correlated variables in the model could make it more difficult to estimate the relationship between the variables and the value being predicted. Missing values can reduce the statistical power of the model and confuse conclusions drawn from it. Removing these variables also reduces the dataset and leads to a shorted run time. To further refine the feature set:
- correlated variables were removed; keeping number of habitable rooms and removing number of heated rooms
- leading variables were removed; environmental and energy efficiency breakdowns (walls, floors, windows) and features derived from other features such as CO2_EMISS_CURR_PER_FLOOR_AREA and LIGHTING_ENERGY_EFF
- unique variables which were unlikely to have another source
- chi-squared test for independence used to find categorical features related to each other; keeping mains_gas_flag and removing main_fuel
Further details of the correlations and reasons for excluding each variable can be found in the appendix or in the GitHub repository.
The final variable set includes the following 20 fields:
- building dimensions
- total floor area
- floor height
- number of habitable rooms
- extension count
- floor level
- building composition
- walls description
- floor description
- property type
- built form
- windows description
- lighting description
- glazed type
- roof description
- utilities
- energy tariff
- mains gas flag
- mean heating controls
- heat loss corridor
- region
- transaction type
Within this final variable set, many of the categorical fields contain a large number of unique values. For example, “roof description” alone has over 500 unique values. In order to reduce this:
- Welsh descriptions were translated to English; for example, ‘To gwellt, gydag inswleiddio ychwanegol’ to ‘Thatched, with additional insulation’
- bilingual sentences were reduced to English only; for example, ‘High performance glazing|Ffenestri perfformiad uchel’ to ‘High performance glazing’
- the unit for average thermal transmittance was standardised to ‘W/m²K’
- the value of average thermal transmittance was reduced to 1 decimal place
- special characters and unnecessary spaces were removed
- spellings were corrected; for example, ‘eneregy’ to ‘energy’
- removed ‘assumed’; for example, ‘Solid no insulation (assumed)’ to ‘Solid no insulation’
In the case of roof description these steps reduced the unique number of values to around 250.
Duplicate records
When a renewable energy source such as solar panels is installed into a dwelling, it is common for a house to be given a certificate before and after installation. As certificates last for 10 years, it is also common for a house to have more than one active certificate. In such cases all certificates were retained as all records are valid. Other examples, where dwellings had multiple inspection dates issued on the same day, were deemed erroneous and only one of these records were retained
Missing Values
Several variables contain information which is unlikely to change over time. For instance, a terraced property is likely to remain a terraced building. It was found that some properties with multiple certificates have missing values for one record and not for another. When this occurs, the completed value is propagated to all future records with missing values. This approach was used to fill missing values in the following fields:
- Built form
- Mains gas flag
- Floor level
- Number of habitable rooms
- Floor description
- Roof description
- Heat loss corridor
- Walls description
- Floor height
Although it is possible for these values to change over time (some more than others), it is deemed more beneficial to fill the missing values from historical equivalents.In doing this there is a risk of filling a value that negatively affects the energy efficiency against a more efficient certificate.
Alternative Data Sources
Alternative data sources were used to act as proxies for the contributing variables in the EPC dataset. The rationale behind these selections are discussed in Section 4. This section contains a description of the source and variables of each dataset.
Ordnance survey (OS) data
Data was sourced from the Ordnance Survey under the Public Sector Mapping Agreement (PSMA).
AddressBase® Plus
AddressBase® Plus is an address dataset for Great Britain that brings together different address sources:
- Local Authority Gazetteers for England, Wales and Scotland
- Royal Mail® PAF® data
- References to Valuation Office Agency (VOA) data
- Additional addresses and coordinates from Ordnance Survey, including, and not limited to, cross-references (Topographic Identifier (TOID®) to the polygon of intersected within OS MasterMap Topography Layer® and the OS MasterMap Topography Layer® – Building Height Attribute.
OS MasterMap Topography Layer®
OS MasterMap is a consistent and maintained framework for the referencing of geographic information (GI) in Great Britain. It comprises four separate but complementary layers (points, lines, polygons and text) that provide detailed topographic, cartographic, administrative, photographic and network features positioned on the National Grid.
Each feature includes their own unique reference, called a TOID® that provides a mechanism for further linkage to the other sources mentioned in this section.
OS MasterMap Topography Layer® – Building Height Attribute
Is an enhancement to, and forms part of, OS MasterMap Topography Layer®. It provides a set of height attributes with a buildings theme within OS MasterMap Topography Layer.
The height-specific attributes available are:
- AbsHMin
- AbsH2
- AbsHMax
- RelH2
- RelHMax
Full definitions of each attribute are available in the Product Technical Specification.
The three OS products detailed above were linked together using the common identifier OS MasterMap Topography Layer® TOID®. The additional attribution outside of AddressBase® Plus were then linked to a properties’ Unique Property Reference Number (UPRN).
Table 1 shows the fields used within this project.
Table 1: Overview of the Ordnance Survey (OS) data used
| Variable | Description | Source |
| UPRN | Unique Property Reference Number (UPRN) | AddressBase® Plus |
| Latitude | Latitude of the UPRN in accordance with the ETRS89 coordinate reference system | AddressBase® Plus |
| Longitude | Longitude of the UPRN in accordance with the ETRS89 coordinate reference system | AddressBase® Plus |
| osTopoTOID | The OS MasterMap Topography Layer TOID that the addressable object refers to. Also used to link in the following attributes: | AddressBase® Plus |
| Building polygon | Series of longitude and latitudes defining the geometry of the building used to derive other features as described in Section 4 | OS MasterMap Topography Layer®
|
| reH2 | Distance in metres between the ground and the bottom of the roof | OS MasterMap Topography Layer® – Building Height Attribute
|
| AbsHMax | Distance in metres between the ground and the top of the roof | OS MasterMap Topography Layer® – Building Height Attribute
|
Land Registry Price Paid
The Land Registry Price Paid open source data details sales for all properties in England and Wales as registered on the transfer deed since 1/1/1995.
Table 2 shows the fields used within this project:
Table 2: Overview of the variables used from Price Paid
| Variable | Description |
| Transaction_id | A unique reference number for each sale, if a property has been sold more than once the number will be different |
| Price | Sale price stated on transfer deed |
| Date of Transfer | Date when the sale was completed, as stated on the transfer deed |
| Old/New | Indicates the age of the property, Y = the first record of a transaction taking place for the property, N = an established residential building |
| Duration | Relates to tenure, freehold or leasehold |
| PPD_category_type | Transaction type, standard or transfers under a power of sale/repossessions, buy-to-lets and transfers to non-private individuals |
Note: UPRN was joined to the Price Paid data through address matching.
Rent Smart Wales
Rent Smart Wales is hosted by Cardiff City Council and has two purposes. Firstly it provides an up to date register of all private landlords and rental properties in Wales. Secondly, it’s an authoritative source of advice and guidance for landlords. In accordance to the Housing (Wales) Act 2014 all private landlords in Wales must register with Rent Smart Wales (RSW)
Table 3: Overview of the variables used from Rent Smart Wales
| Variable | Description |
| UPRN | Unique Property Reference Number, used to link all datasets together |
| Number of bedrooms | Number of bedrooms |
| Registration Date | Date the property was registered with RSW as a privately rented property |
ONS postcode directory
The Office for National Statistics Postcode Directory is a freely available dataset covering the UK. It maps current postcodes to a range of current statutory, administrative, electoral, health and other statistical geographies via “best-fit” allocation from the 2011 Census output areas. It supports the production of area-based statistics from data using postcode as the unique key.
Table 4: Overview of the variables used from ONS postcode directory
| Variable | Description |
| postcode | All current (‘live’) postcodes within the United Kingdom, the Channel Islands and the Isle of Man, received monthly from Royal Mail |
| park | Code indicating which of the 13 national parks the postcode resides in |
| imd | Rank from the index of multiple deprivation for the output area |
| latitude | Decimal degrees latitude for the postcode to six decimal places |
| longitude | Decimal degrees longitude for the postcode to six decimal places |
Other data considered
During the project, other data sources where considered as possible proxies;
- Valuation Office Agency Council tax data provides a complete dataset for Wales, detailing some characteristics properties, crucially their age. Due to confidentiality and data protection, it wasn’t possible to obtain council tax data
- Deposit protection scheme data would have provided a more up to date record of private rented properties. Due to confidentiality and data protection it wasn’t possible to obtain this data
- The Welsh housing conditions survey is an extremely detailed rich survey, containing information on construction material, energy facilities and amenities. Due to a small number of records (2,500) the survey has not been used
3. Predicting Energy Efficiency using EPC data
The final objective was to predict the energy efficiency for domestic properties in Wales that did not already have an Energy Performance Certificate (EPC). The most predictive features and the most suitable technique were found by predicting energy efficiency using the EPC data. The selected features are then used to focus the search for similar data from other sources. In this section feature sets derived from the EPC data and modelling techniques used to predict the energy efficiency are defined.
The EPC data contains several categorical variables with a lot of values (see Section 2). In order to find suitable features which will retain the most information, three feature sets were explored;
- data driven
- domain driven
- exhaustive
Data Driven Features
The first approach, termed data driven, uses statistical methods to reduce the number of variables. As the variables containing textual descriptions of the property have been created free-hand, many contain a large number of unique values. In some cases, only recorded for one property. The data driven approach uses a single level Chi-square Automatic Interaction Detector (CHAID) to group the levels within each categorical variable into a smaller number of groups. CHAID groups values with a similar response rate or in this context Energy Efficiency Rating (EER). CHAID suggests grouping the lighting description variable into:
Table 5: Groups produced by CHAID for the field lighting_description
| Group | Values |
| 1 | ‘<missing>’, ‘low energy lighting 90% of fixed outlets’, ‘low energy lighting 100% of fixed outlets’, ‘low energy lighting 80% of fixed outlets’, ‘low energy lighting 50% of fixed outlets’, ‘low energy lighting 70% of fixed outlets’, ‘low energy lighting 40% of fixed outlets’, ‘low energy lighting 30% of fixed outlets’, ‘low energy lighting 60% of fixed outlets’] |
| 2 | ‘low energy lighting 0% of fixed outlets’, ‘low energy lighting 10% of fixed outlets’, ‘no low energy lighting’, ‘low energy lighting 20% of fixed outlets’ |
| 3 | ‘low energy lighting in all fixed outlets’ |
Intuitively these groups make sense as they appear to correspond to:
- group 1 – medium lighting efficiency
- group 2 – no or low lighting efficiency
- group 3 – high lighting efficiency
The dataset resulting from the data-driven approach contains 83 columns.
Domain Driven Features
Although correct from a mathematical perspective, the groups generated by the data-driven approach do not always make intuitive sense. To address this, the domain-driven approach groups categories together using expert domain-based knowledge. Examples of this are grouping the original fields such as rural, urban and suburban local authorities together, or pulling out the key features such as ‘pitched roof’ or ‘insulated floor’. This processing resulted in 68 columns. It should be noted that although the domain-driven features are easier to understand, this approach will not be as powerful as the data-driven approach, as performance has been traded for interpretation.
Exhaustive Features
The third feature set does nothing further to the data and feeds the model the maximum information possible. At 1,030 columns the exhaustive dataset is by far the largest. Not grouping any of the categorical values allows more advanced machine learning techniques to decide where to split data during training. Although this should be the most predictive approach, computational time to train the models will be considerably longer.
Modelling
The goal of this project is a desire by Welsh Government to improve the energy efficiency of all housing stock in Wales. Current targets relating to rented properties are measured using the energy efficiency bandings E or D. However, it was decided to predict the underlying EER score as this will allow bespoke aggregation of the predicted values at different levels, future proving for policy changes.
A 20% test dataset was randomly sampled on the target EER field maintaining the same distribution of EER within both training and test datasets. The test dataset was used to independently test the performance of each model. Training and test performance were compared to ensure overfitting was not present. Standard pre-processing of one hot encoding categorical variables and scaling numerical variables has been applied.
Table 6: Training and Test set sizes
| Dataset | Size |
| Training | 632,607 |
| Test | 158,152 |
Five different supervised learning classification models were assessed to understand how well they could predict EER. Linear regression was selected as the baseline and the variance score (R2) as the quality measure used to assess the models. The other four algorithms were random forest, ada boost, XGBoost and a neural network. Table 7 shows the results from testing different algorithms and feature set combinations. Both XGBoost and a neural network using the exhaustive feature set give the best results. XGBoost has been tuned to find the best learning rate, maximum tree depth and number of estimators of 0.4, 7 and 300 respectively. Similarly, the neural network has been tuned to find the best architecture of 120-60-10-4-1 and a 10% validation set was used to terminate search before overfitting. The similarity between train and test scores indicates overfitting did not occur and all models generalise well.
Table 7: Accuracy of different models and features for predicting EER
| Model (feature set) | Feature set | Train R2 | Test R2 |
| Linear regression | Data driven | 0.72 | 0.72 |
| Random forest | Data driven | 0.77 | 0.76 |
| Ada boost | Data driven | 0.58 | 0.58 |
| XGBoost | Data driven | 0.78 | 0.78 |
| XGBoost | Domain | 0.68 | 0.67 |
| XGBoost | Exhaustive | 0.85 | 0.82 |
| Neural network | Data driven | 0.78 | 0.78 |
| Neural network | Domain | 0.73 | 0.73 |
| Neural network | Exhaustive | 0.83 | 0.82 |
On initial inspection it is surprising that the neural network did not outperform XGBoost. The comparable results suggest the relationship between EER and the feature set is not a complicated one and the power of more advanced deep learning methods offers little incremental benefit.
Energy efficiency banding
Although predicting the energy efficiency score (EER) gives the most flexibility for evaluating the current policies, it’s necessary to classify EER to the energy efficiency banding for policy evaluation. The accuracy varies across different bands with band D, the most populated band, and also the most accurate with 76% accuracy Figure 3. The least populated bands, A and G, have the lowest accuracy, especially A with only 18% accuracy. The overall accuracy when considering the bands is 0.69.
Figure 3: XGBoost results by Band
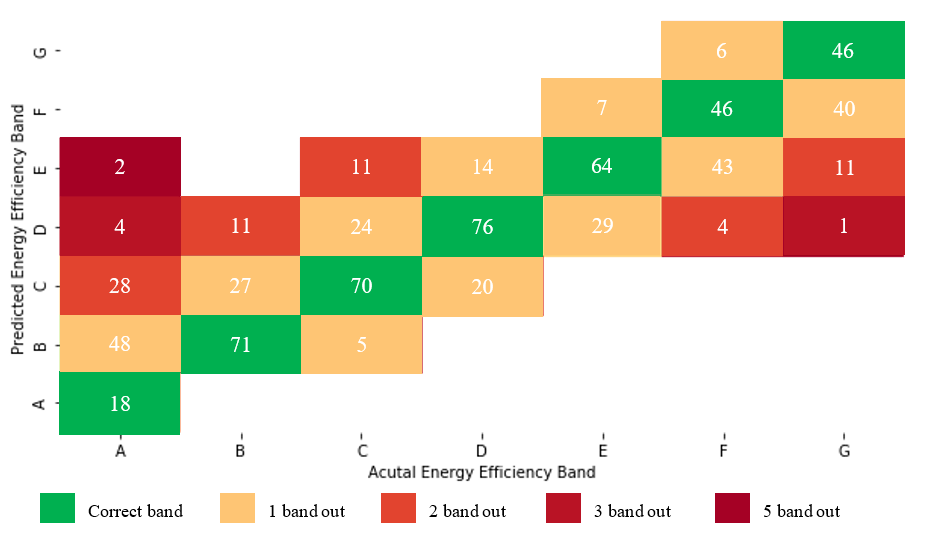
1 band out denotes the predicted score equates to an energy efficiency rating one band higher or lower than the actual energy efficiency rating, for example, an actual energy efficiency rating of B predicted as either A or C.
Upsampling
The previous result shows that performance within a given band is strongly linked to the number of records from that band in the training sample. Underpopulated bands such as A or G performed relatively poorly. To increase the accuracy of these bands, data from England was used to upsample each band to broadly similar volumes. Two ways of upsampling were investigated:
- Increasing the total band amount of each band to be the same as band D
- Stratifying the bands to smaller groups covering five EER points and increasing within each group
Unfortunately, although the gap in accuracy across energy efficiency bands A to G was closed and the accuracy of the extreme bands improved, this was to the detriment of the more populated bands. It was decided that upsampling was not an advantageous step.
Feature Importance
The importance, represented by the standardised contribution, of the top 10 features in the XGBoost model is shown in Table 8. The most predictive feature in the model was “total floor area” with an importance of 0.14, whilst many features had an importance of 0. Interestingly the top four features are all related to the size of the property.
Table 8: Feature importance for XGBoost and the exhaustive feature set
| Feature | XGBoost importance |
| TOTAL_FLOOR_AREA | 0.14 |
| FLOOR_HEIGHT | 0.09 |
| NUMBER_HABITABLE_ROOMS | 0.03 |
| EXTENSION_COUNT | 0.03 |
| MAINS_GAS_FLAG_N | 0.02 |
| NUMBER_OPEN_FIREPLACES | 0.02 |
| HOTWATER_DESCRIPTION_From main system | 0.01 |
| BUILT_FORM_Mid-Terrace | 0.01 |
| BUILT_FORM_Detached | 0.01 |
| MAIN_HEATING_CONTROLS_programmer, room thermos… | 0.01 |
As the categorical features have been one hot encoded, it is difficult to determine the contribution of each original variable to the final model from Table 8. As an alternative, Table 9 shows a weighted view of variables taken as the sum of each encoded feature divided by its rank from the XGBoost importance. Only encoded features with an importance higher than 0 have been included.
Table 9: weighted rank of EPC feature importance (features with rank 19 to 21 have extremely low importance)
| 1 | Total floor area | 12 | Glazed type |
| 2 | Floor height | 13 | Windows description |
| 3 | Hot water description | 14 | Region |
| 4 | Mains gas flag | 15 | Extension count |
| 5 | Walls description | 16 | Lighting description |
| 6 | Built form | 17 | Energy tariff |
| 7 | Mains heating controls | 18 | Number of open fireplaces |
| 8 | Roof description | 19 | Floor level |
| 9 | Property type | 20 | Number of habitable rooms |
| 10 | Transaction type | 21 | Heat loss corridor |
| 11 | Floor description |
This list of variables was used to find alternative sources of information about properties in Wales. XGBoost has also been selected as the best performing model with the exhaustive feature set. Although a neural network can perform to the same accuracy XGBoost’s feature importance will also indicate which alternative sources are worthwhile.
4. Proxy features
Section 3 demonstrated the feasibility of predicting missing values using features taken from the Energy Performance Certificate (EPC) data, highlighting the most significant variables. As previously discussed, EPC data is only available for 50% of domestic properties in Wales. In order to predict EER for the other properties in Wales it is necessary to find alternative data sources or proxies for the most predictive features. Crucially these sources must be available for a large proportion of the Welsh dwelling stock. This section describes the features derived from these sources. Section 2 provides details on the datasets.
Direct Proxies
Total floor area
With a feature importance of 0.13, total floor area was found to be the most predictive variable within the EPC dataset. To replace this variable with a suitable proxy, domestic building polygons for Wales were used. The polygons provided by Ordnance Survey define building boundaries for domestic properties in Wales. These shapes were used to derive the area, length (perimeter), and uniformity (area/length) of a given building using OpenCV. Uniformity could indicate whether a property has been extended and a less uniform building could have more area surrounded by external walls. By finding each property’s five nearest neighbours (KNN) features relating to built form, property type and how many properties are in a terrace have been derived later in this section.
Figure 4: polygon of a high (left) and low (right) uniformity
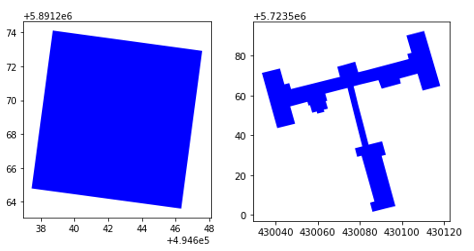
A building may contain multiple properties for instance a block of flats. The polygons capture the whole building outline and are recorded by topographic identifier (TOID) with a lookup for each Unique Property Reference Number (UPRN). A TOID represents an individual building. This means for houses, the data provides accurate information – shape, area, length and uniformity. However, for flats, the data represents the building itself and not individual flats. In these instances, area and length have been divided equally between the properties in the building.
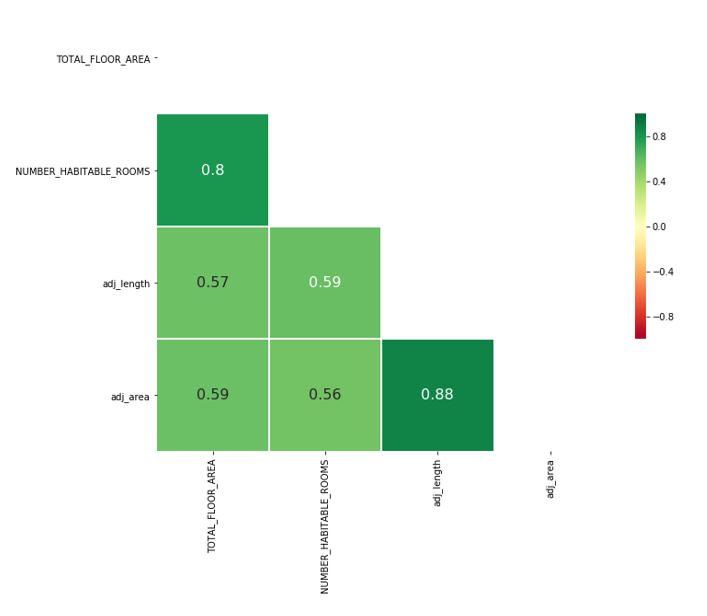
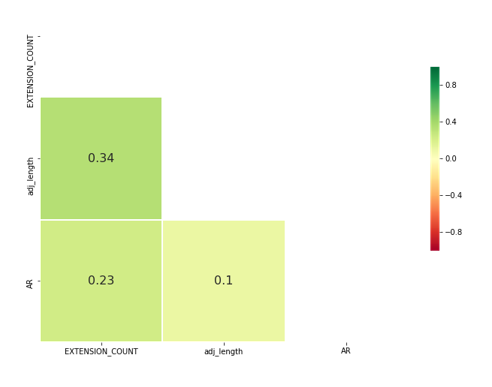
The correlation between the original feature, total floor area, and the proxies gives a measure of similarity for the variables and hence the suitability of the proxy. Figure 5 shows there is a correlation between total floor area and area and length derived from the polygons. As number of habitable rooms is related to total floor area, there is also a correlation with this EPC variable. Although the correlations are not strong the chart only shows the one to one relationship and not the combinatorial effect of features which would be captured by a model. It’s expected that the combination of area and height would have a stronger relationship to the total floor area than in isolation.
Figure 5: Correlations between total floor area and polygon shape features (adj indicates the variable has been divided by the number of UPRNs)
Floor height
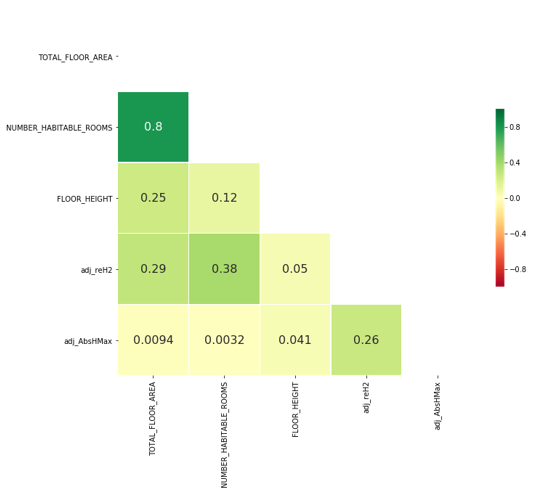
The results from the XGBoost model indicate that floor height is the second most predictive variable. It was expected a proxy for this would come from the Ordnance Survey (OS) data in the form of ReH2 and AbsHMax, height from the ground to the bottom and top of the roof respectively. A feature depicting roof height has been calculated by subtracting ReH2 from AbsHMax. Again, ReH2 and AbsHMax variables have been adjusted by dividing by the number of UPRNs in the building to distribute the height. It is acknowledged that this is not a perfect solution as a block of flats may have multiple flats on a single floor. Figure 6 shows there is no correlation between floor height and the building height data, suggesting these are not good proxies for floor height. Notably, there is a greater correlation between the number of habitable rooms and ReH2, for this reason it is retained as a feature.
Roof height is also retained as a feature as it may act as a weak proxy for type of roof, for example the height of roof should determine if the property has a flat roof.
Figure 6: Correlation between floor height and polygon building heights
Built form and property type
The final features derived from the OS data are built form (whether the building is detached or attached), and property type (whether the property is a house or flat). Flats have been determined by counting the number of UPRNs within a TOID. If the count is greater than one, then the properties within the building are all deemed to be flats. Checking the commonality between the EPC property type variable and derived flat feature implies that 93% of flats are correctly classified as flats. Table 10 shows for built form, 87% of detached properties are flagged as detached, with 99% of terraced properties classified as attached.
Figure 7: polygon of a detached and attached building
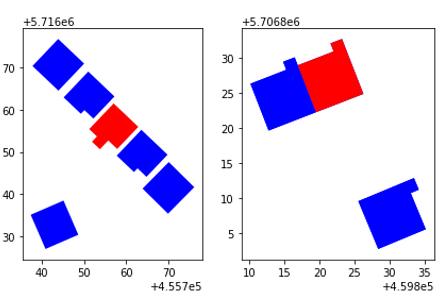
Table 10: Relationship between EPC built form and polygon built form
| EPC built form | Polygon built form | Percentage correctly classified |
| detached | detached | 87 |
| end-terrace | end-terrace | 74 |
| mid-terrace | mid-terrace | 87 |
| semi-detached | semi-detached | 84 |
To take this a step further, the five nearest neighbours have been used to group buildings into sets of attached properties representing streets or blocks of terraces. The number of properties in the terrace has been counted to form a feature called blockCount. blockCount combined with the number of neighbours has been used to distinguish between end and mid terrace properties.
Extension Count
The length calculated from the polygons is also weakly correlated to the extension length and aspect ratio (length/width).
Figure 8: correlation between extension count and length
Transaction type
Transaction type gives the reason why a certificate has been commissioned. This includes new builds, house sales, rental properties and as part of green deals. It was not possible to identify one data source to replace all this information, however new build from the Land Registry Price Paid and privately rented properties from Rent Smart Wales (RSW) offer two suitable proxies.
Table 11: Relationship between transaction type and proxies
| EPC transaction type | RSW rented | Price Paid new_build | Percentage correctly classified |
| rental (private) | 1 | 60 | |
| rental | 1 | 61 | |
| rental (social) | 0 | 98 | |
| new dwelling | Y | 70 | |
| other categories | N | 90+ |
A limitation of RSW is that landlords do not have to unregister when a property is no longer rented out or has been sold. However, it’s not expected this factor will affect the usefulness of the feature; if a landlord has previously made a property more energy efficient those modifications are unlikely to be removed.
Indirect proxies
Age
Ideally a proxy relating to property age would have been sourced as this would determine many of the features within the EPC data (Section 2). This includes building material for the walls, roof and floors, window size and number of chimneys. For example, an older property is more likely to have solid floors, walls and a thatched roof. It is also more likely to have an open fireplace in every room and less likely to be insulted, whereas new builds will be insulated as standard. Three variables from different sources were used to estimate this information:
- Price paid new build
- Price paid days since first transaction
- AddressBase® Plus earliest start date
Price Paid new build is taken directly from the source, whereas the AddressBase® Plus earliest start date was converted to year. Days since first transaction is derived from subtracting the earliest transaction date from the EPC inspection date. There are limitations to features taken from the Price Paid data as sales records are only available since 1995 leading to many properties having no record. Correlations with EER demonstrate this. Earliest start year and EER have a correlation of 0.25, whereas EER and days_since_first_sale show no correlation. In this case a missing value is in itself useful as it indicates a property pre-dates 1995.
Price
Several other features from the Price Paid dataset were considered, for example sale price. It was thought that properties sold for a higher price than the neighbouring houses may be in a better condition and more energy efficient. Only the price from the sale closest to the certificate completion date is considered. The prediction of house prices is a huge topic and complicated to do with accuracy. There are many factors to be considered, such as location, condition, size and neighbourhood of the property. It’s therefore not surprising that no correlation between price and EER (0.06) was observed. It is possible that derivation of more complex features would have a higher correlation. For example, time between sales, where a short period may indicate a property which was renovated in order to sell on, or perhaps a longer period indicates a property the owner has invested more in. However, the varying transaction dates of sales is likely to prevent the model learning which properties sold for a higher price.
Geographical based proxies
Latitude and Longitude
Intuitively, houses on the same street are more likely to have similar energy efficiency, due to the use of the same building design, materials and size. Using latitude and longitude as features allow the model to learn the spatial dependence between properties in the same street and neighbouring streets.
Neighbour scores
Developing the concept of spatial dependence further, the energy efficiency scores of neighbouring properties are also used as model inputs. Features cee_neighbour1 to cee_neighbour5 give the EER for the five nearest neighbours and oa_cee denotes the average EER for the output area. Output area was found to be large enough to contain enough properties with an ERR value to ensure the feature did not inadvertently equal the target EER. On average there is a correlation of 0.35 between the five nearest neighbour scores and the target EER. Whereas the output area EER and the target EER have a correlation of 0.51.
Local area features
Turning to the wider neighbourhood, several features can be taken either directly or derived from the ONS postcode directory dataset. The local area is defined using Output Areas (OA). For each output area the park variable records whether a property is in a national park and the imd variable specifies the rank from the Index of Multiple Deprivation (IMD). The Park variable indicates whether a property is situated within a national park and as such is more likely to be subject to stricter planning rules and may not be able to install renewable energy technologies. IMD is included as areas of higher deprivation are less likely to be able to afford the sizeable investment needed to install renewable energy technologies. However, it’s also possible deprived areas were eligible for green deal schemes.
In a similar way to the property latitude and longitude features above, the latitude and longitude of the postcode area can also inform the model about the spatial dependence of the local area. The local area features are all joined to the other features by postcode.
Final feature set
The final feature set includes:
Table 12: Final feature set from alternative sources
| Name | Variable name in code |
| Target variable from EPC data | CURRENT_ENERGY_EFFICIENCY |
| Property latitude | Latitude |
| Property longitude | Longitude |
| Year associated the property joining AddressBase | earliest_start_year |
| Number of bedrooms from RSW | RSWNumberOfBedrooms |
| Postcode latitude | lat |
| Postcode longitude | long |
| National park code | park |
| Index of multiple deprivation rank | imd |
| Price property sold for from the closest sale to EPC inspection date | price |
| Adjusted polygon area | adj_area |
| Adjusted polygon length | adj_length |
| Adjusted uniformity | adj_uniformity1 |
| Flat | flat |
| Adjusted height from ground to bottom of roof | adj_reH2_final |
| Difference between height from ground to bottom and top of roof | roof_height_final |
| Building form | built_form |
| Number of buildings in a terrace | blockCount |
| New build status from the closest sale to EPC inspection date | new_build |
| Number of days since the first time the property was sold | days_since_first_sale |
| Energy efficiency score for nearest neighbour | cee_neighbour1 |
| Energy efficiency score for nearest neighbour | cee_neighbour2 |
| Energy efficiency score for nearest neighbour | cee_neighbour3 |
| Energy efficiency score for nearest neighbour | cee_neighbour4 |
| Energy efficiency score for nearest neighbour | cee_neighbour5 |
| Energy efficiency score for output area | oa_cee |
Unfortunately, most alternative features are numeric and do not provide direct proxies for the descriptive characteristics of the buildings such as wall description or roof description. It is hoped the geographic proxies will allow the model to learn about the descriptive features of the properties from their neighbouring buildings.
Not all these variables are available for every property in Wales, Figure 9 shows the cross over between the different data sources. Only 9% of properties have data for all records, however, this is to be expected as RSW only contains privately rented properties – about 13% in Wales in 2017.
Filling missing values
Figure 9 shows some of the variables are not available for all records. Although XGBoost can handle missing values, a more bespoke approach was required for the variables listed in Table 13.
Figure 9: Coverage of all proxy features (Note volumes after merging with EPC data will be affected by the quality of the UPRN match)
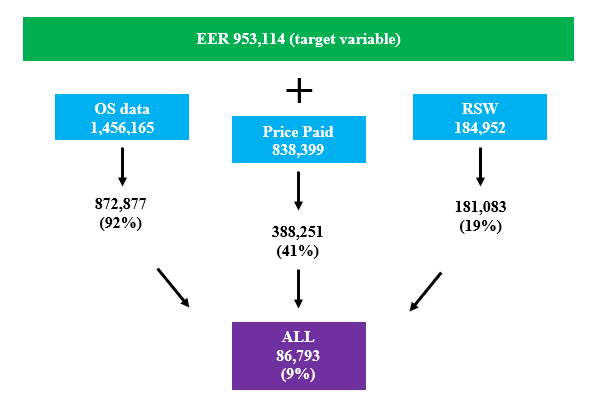
Table 13: Processing of missing values
| Feature | Processing |
| flat | Addresses containing the word flat were flagged 1 (a flat) all others 0 (not a flat) |
| new build | If one UPRN in a building is flagged as a new build then all UPRNs in the building are considered to be new build, otherwise not a new build |
| latitude, longitude | Filled with the postcode latitude or longitude |
| lat, long | Filled with the average local authority lat or long |
| adj_reH2, roof_height | Filled with the average of the closest 5 properties (not applied to detached properties) |
| adj_area, adj_length, adj_reH2, roof_height, blockCount | 1) Filled with the median value for all postcodes that match the property’s postcode by 5 characters and stratified by built_form and flat
2) Filled with the median value for all postcodes that match the property’s postcode by 5 characters and stratified by flat 3) Filled with the median value for all postcodes that match the property’s postcode by 4 characters and stratified by flat 4) Filled with the median value for all postcodes that match the property’s postcode by 3 characters and stratified by flat |
| adj_uniformity | Calculated using the filled adj_area and adj_length described above |
5. Predicting Energy Efficiency using Proxy Features
Taking the best performing model and feature set found in Section 3, XGBoost was run with an exhaustive feature set using the above alternative variables. As before a 20% test dataset was randomly sampled on the target EER field maintaining the same distribution of EER within both training and test datasets. The test dataset was used to independently test the performance of each model. Training and test performance were compared to ensure overfitting was not present. Standard pre-processing of one hot encoding categorical variables and scaling numerical variables has been applied.
Unfortunately, the proxy variables do not perform well, only achieving a R2 of 0.44 for the training dataset and 0.40 for the test dataset. The top 10 features by importance from the XGBoost model with hyperparameters max_depth, n_estimators and learning_rate of 4, 300 and 0.4 respectively are show in Table 14:
Table 14: feature importance for proxy variables
| Feature | XGBoost importance |
| oa_cee | 0.09 |
| latitude | 0.07 |
| longitude | 0.07 |
| cee_neighbour1 | 0.06 |
| adj_length | 0.05 |
| adj_reH2 | 0.05 |
| adj_uniformity | 0.05 |
| lat | 0.04 |
| adj_area | 0.04 |
| imd | 0.04 |
Given the huge difference in the variance scores between the original model and the proxy model it is clear the proxy model is missing information embedded in fields such as building descriptions. This is further supported by the original feature importance scores and the winning feature set where none of the features had a standout importance, rather each feature added small incremental levels of information.
Information that is missing from the new feature set and its importance would need be identified before searching for more data sources.
Firstly, it is beneficial to establish whether the new feature set is adequately compensating the numeric EPC variables. This has been checked in two ways, firstly running the original tuned model with only the variables that have direct proxies namely TOTAL_FLOOR_AREA, PROPERTY_TYPE, BUILT_FORM, NUMBER_HABITABLE_ROOMS, TRANSACTION_TYPE, FLOOR_HEIGHT.
Secondly by individually replacing each variable within the new feature set with their original equivalent EPC feature, for example flat with PROPERTY_TYPE. Neither version outperformed the proxy model, suggesting the assembled proxies are sufficient substitutes.
To determine which of the original EPC features are not sufficiently substituted by the proxy variables, the proxy model was run and each of the original EPC features was added in turn, isolating the effect of the original variable. Table 15 shows the improvement in accuracy (R2) from individually adding the original categorical features not captured by the proxies one by one. It shows only a minor improvement from adding each variable with walls description making the most difference. This indicates finding a direct alternative source for a single feature wouldn’t provide the missing information.
A fundamental assumption of the proxy model is that the geographic proxies will allow the model to learn the spatial dependence between properties in the same street and neighbouring streets. Even to learn about the descriptive features of the properties, such as walls description, from their neighbouring buildings. Although these geographic variables top the list of important features, the performance of the proxy model suggests they are not enough to compensate for information from the categorical variables. Given the in-depth information and large number of unique values making up these features this is perhaps not surprising.
Table 15: Improvement in R2 from adding original variables individually
| Feature | Improvement in accuracy (R2) |
| mains gas flag | 0.07 |
| Number of open fireplaces | 0.06 |
| Heat loss corridor | 0.03 |
| Energy tariff | 0 |
| Glazed type | 0.04 |
| Lighting description | 0 |
| Window description | 0 |
| Main heating controls | 0 |
| Floor description | 0 |
| Hotwater description | 0.01 |
| Walls description | 0.14 |
| Roof description | 0.12 |
To verify this conclusion and to ensure XGBoost has not affected these findings, a neural network was also run with the proxy variables. The neural network had a similar performance with an R2 of 0.40 for the training dataset and 0.40 for the test dataset supporting the findings of the XGBoost model.
The use of machine learning to predict the energy efficiency scores relies on sufficient volumes of relevant data. The work has shown the approach is valid, but it relies on finding appropriate alternative data sources for the descriptive fields held within the EPC dataset, a particular challenge given the depth of levels and information contained within them. Below is a list of suggested areas to either extend the existing proxies or source new ones:
- Extensions – the building polygons were used to calculate a measure of uniformity, based on a theory that the extension will have changed the shape of the property to something less regular. A more complex derivation could compare the shape of neighbouring properties and conclude that an extension exists where a property is larger and different to its neighbours. Clearly this would be most appropriate for terraced houses.
- Roof type and material – explore using aerial imagery to classify the shape and material of roofs. Attempts to classify roof type have been made before, however roof material would go some way to replacing some of the information contained in the contextual descriptions of the properties.
- Infra-red – if a suitable resolution became available, then thermal infrared signals captured in satellite images could be used as a measure of heat escaping from the roof.
- Wall description – with access to a good source of street level imagery it could be possible to identify the material of the walls and perhaps even properties with a higher proportion of windows (a source of heat loss)
- Solar panels – similar aerial imagery could be used to classify properties with solar panels, and therefore an alternative green energy source
- Computer vision – it would be interesting to feed both aerial images and street level images of properties to a Convolution Neural Network (CNN), trained using the EPC data, and test whether it’s possible to learn the energy efficiency scores directly from the images.
- Social rented data – in addition to the Rent Smart Wales data it would be advantageous to obtain a source of data relating to socially rented properties
- Natural Language Processing (NLP) – so far three methods for pre-processing the data and creating feature sets have been tested. However, an interesting comparison would be using NLP techniques on the categorical fields to compare a fourth feature set
- Future datasets – if a dataset becomes available in the future, especially one containing information on property age, energy usage or insulation, it could make a big difference to the model’s ability to predict the energy efficiency
6. Summary
Several data sources relating to energy efficiency, property characteristics and geography have been investigated to predict energy efficiency of domestic properties in Wales. The intended outcome was to fill the gaps in evidence used to evaluate housing and energy related policies by the Welsh Government.
The measure of energy efficiency was provided by Energy Performance Certificates (EPC) in the form of the Energy Efficiency Rating (EER). The EPC data has been explored, cleaned and developed into three separate feature sets, denoted as data driven, domain driven and exhaustive. Each feature set focused on a different approach: data driven deployed traditional statistical techniques, domain driven prioritised interpretability over predictive power and the exhaustive set allowed the model free rein.
Other data sources intended to substitute the information recorded by the EPCs and available for all properties in Wales have also been explored and cleaned. New variables relating to property characteristics, geography and spatial dependency were derived to form a feature set obtainable for all of Wales.
Initially, alongside the three EPC feature sets several machine learning algorithms were compared. It was found the most accurate results were achieved through using the exhaustive feature set in combination with a XGBoost model. In this case 82% of the variance in EER was explained in the test set. Analysis of the most predictive variables within the EPC dataset identified by the XGBoost model, revealed the top four (total floor area, floor height, number of habitable rooms and extension count) all relate to the size of the property. However, it was also shown the predictive power of the model does not come from any single variable but rather that each feature adds small incremental levels of information.
Applying the findings from the initial modelling to the alternative feature set yielded disappointing results with a test set R2 of only 40%, significantly lower than the results achieved with the original EPC features. Although many of the original features were replaced it wasn’t possible to find enough alternatives for the categorical fields, which provided free-text descriptions of the buildings such as the construction materials.
An investigation into the lower performance revealed the new set to be adequately covering the information it was intended to replace. Further testing suggested finding alternative sources for the missing information would be challenging as multiple sources are likely required. The depth and levels of information contained within many of the categorical EPC descriptions would make this particularly difficult. The assumption that spatial dependencies between properties in the same street and neighbourhood would compensate for these categorical variables was not valid.
Given relevant data, machine learning techniques could be used to predict the missing energy performance scores for domestic properties in Wales. The approach used by the Campus highlights the fundamental importance of having access to the right data. Section 5 concludes with a discussion on some options for boosting the data used in this project.
The original aim of the project was to improve the energy efficiency data underpinning the evidence for Welsh strategies and policies relating to housing and in turn create a complete picture of the energy efficiency profile for all homes in Wales. The Campus attempted to predict energy efficiency at the most granular level. Individual property results allow policy makers to review the data by any feature and therefore identify which types of properties need attention, in order to improve against targets. However, for evaluation purposes a technique which considers an aggregated level such as Lower Super Output Area (LSOA) could be enough.
Future work
There are many areas where the work discussed in this report may be developed or improved.
Additional variables
A list of suggestions for extending the feature set is available in Section 5.
Imputation Series
How to impute missing values is often an area of interest for Campus stakeholders and mentor programme participants. The Campus is interested in extending this project into an imputation series. A library of approaches encompassing different methods of imputation, that would identify the optimal solution for a particular scenario and provide the completed field.
Other approaches
In the case of energy efficiency, a rudimentary approach was sufficient for the task. However, other more in-depth approaches exist which could be more appropriate for a different target variable or feature set. These methods include auto-encoders, Restricted Boltzmann Machines or latent matrix factorisation.
7. Acknowledgements
We would like to thank Welsh Government for their support and assistance through this project. We would also like to thank Cardiff City Council, the Ministry of Housing, Communities and Local Government (MHCLG) and Ordnance Survey (OS) for providing datasets, in particular, MHCLG for providing an early sight of the latest EPC data. Further thanks go to the Office for National Statistics (ONS) digital team for providing access to, and assistance with the Address Index.
8. Appendix
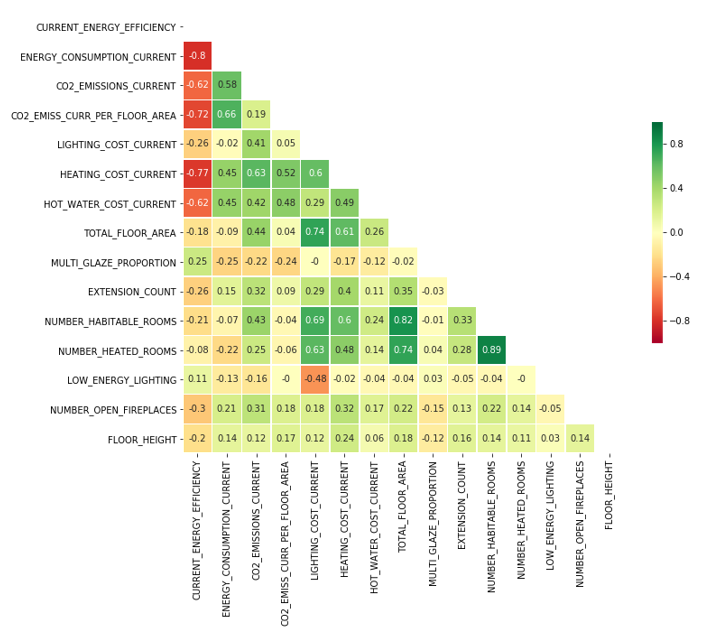
Correlated features in EPC data
Figure 10: Correlated cost features
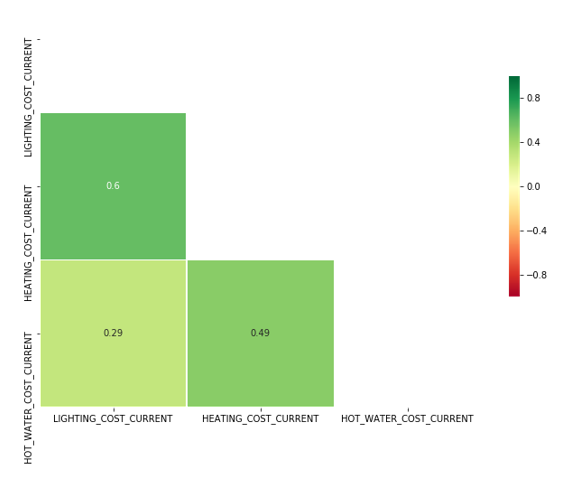
Figure 11: Correlated house descriptions
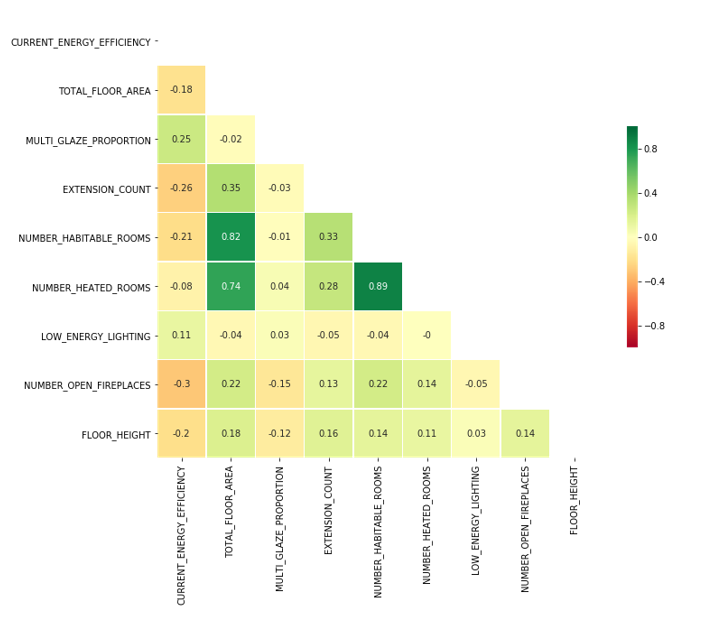
Figure 12: Correlated numeric fields in EPC data
| Original field name | Data type | Description | Excluded | Exclusion Reason |
| LMK_KEY | String | Individual lodgement identifier | Yes | Unique certificate identifier, unrelated to target variable |
| ADDRESS1 | String | Address Line 1 | Yes | Unique property information, unrelated to target variable |
| ADDRESS2 | String | Address Line 2 | Yes | Unique property information, unrelated to target variable |
| ADDRESS3 | String | Address Line 3 | Yes | Unique property information, unrelated to target variable |
| POSTCODE | String | Postcode for the property address | Yes | Unique property information, unrelated to target variable |
| BUILDING_REFERENCE_NUMBER | String | Unique identifier for the property. Generated by the Energy Performance of Buildings Register. Not linked to ONS or NLPG UPRNs. | Yes | Unique building identifier, unrelated to target variable |
| CURRENT_ENERGY_RATING | String | Current energy rating converted into a linear ‘A to G’ rating (where A is the most energy efficient and G is the least energy efficient) | Yes | Derived from the target variable |
| POTENTIAL_ENERGY_RATING | String | Estimated potential energy rating converted into a linear ‘A to G’ rating (where A is the most energy efficient and G is the least energy efficient) | Yes | Theoretical energy efficiency based on target variable |
| CURRENT_ENERGY_EFFICIENCY | integer | Based on cost of energy, i.e. energy required for space heating, water heating and lighting [in kWh/year] multiplied by fuel costs. (£/m2/year where cost is derived from kWh). | No | |
| POTENTIAL_ENERGY_EFFICIENCY | integer | The potential energy efficiency rating of the property. | Yes | Theoretical energy efficiency based on target variable |
| PROPERTY_TYPE | String | Describes the type of property being inspected. One of house; flat; bungalow; maisonette; park home (from 2015 only) | No | |
| BUILT_FORM | String | Together with ‘property type’ provides structured description of the property. One of detached; semi-detached; mid-terrace; end-terrace; enclosed mid-terrace; enclosed end-terrace | No | |
| INSPECTION_DATE | date | The date that the inspection was actually carried out by the energy assessor. | Yes | Not possible to assign to properties without a certificate |
| LOCAL_AUTHORITY | String | ONS code. Local authority area in which the property is located | No | |
| LODGEMENT_DATE | date | Date lodged on the Energy Performance of Buildings Register | Yes | Not possible to assign to properties without a certificate |
| TRANSACTION_TYPE | String | Type of transaction that triggered EPC. For example, one of: marketed sale; non-marketed sale; rental; not sale or rental; assessment for Green Deal; following Green Deal; FIT application; none of the above; RHI application; ECO assessment. Where the reason for the assessment is unknown by the nervy assessor the transaction type will be recorded as ‘none of the above’. Transaction types may be changed over time. | No | |
| ENVIRONMENT_IMPACT_CURRENT | integer | The Environmental Impact Rating. A measure of the property’s current impact on the environment in terms of carbon dioxide (CO2) emissions. The higher the rating the lower the CO2 emissions. (CO2 emissions in tonnes / year) | Yes | Unique variable unlikely to be found in another source |
| ENVIRONMENT_IMPACT_POTENTIAL | integer | The potential Environmental Impact Rating. A measure of the property’s potential impact on the environment in terms of carbon dioxide (CO2) emissions after improvements have been carried out. The higher the rating the lower the CO2 emissions. (CO2 emissions in tonnes / year) | Yes | Unique variable unlikely to be found in another source. Theoretical environmental impact based on actual environmental impact |
| TOTAL_FLOOR_AREA | float | The total useful floor area is the total of all enclosed spaces measured to the internal face of the external walls, i.e. the gross floor area as measured in accordance with the guidance issued from time to time by the Royal Institute of Chartered Surveyors or by a body replacing that institution. (m2) | No | |
| ENERGY_TARIFF | string | Type of electricity tariff for the property, e.g. single. | No | |
| MAINS_GAS_FLAG | Y / N flag | Whether mains gas is available. Yes means that there is a gas meter or a gas-burning appliance in the dwelling. A closed-off gas pipe does not count. | No | |
| FLOOR_LEVEL | string | Flats and maisonettes only. Floor level relative to the lowest level of the property (0 for ground floor). If there is a basement, the basement is level 0 and the other floors are from 1 upwards | No | |
| FLAT_TOP_STOREY | Y / N flag | Whether the flat is on the top storey | Yes | Missing for 83% of records |
| FLAT_STOREY_COUNT | integer | The number of storeys in the apartment block. | Yes | Missing for 92% of records |
| MAIN_HEATING_CONTROLS | string | Type of main heating controls. Include for both main heating systems if there are two. | No | |
| MULTI_GLAZE_PROPORTION | integer | Percentage. Glazed areas. The multiple-glazed percentage is calculated on the basis of the area and type of each window or roof window | Yes | ??? |
| GLAZED_TYPE | integer | The type of glazing. From British Fenestration Rating Council or manufacturer declaration, give as one of; single; double; triple. | No | |
| GLAZED_AREA | String | Ranged estimate of the total glazed area of the habitable areas of the property. | Yes | ??? |
| EXTENSION_COUNT | integer | The number of extensions added to the property. Between 0 and 4. | No | |
| NUMBER_HABITABLE_ROOMS | integer | Habitable rooms include any living room, sitting room, dining room, bedroom, study and similar; and also a non-separated conservatory. A kitchen/diner having a discrete seating area (with space for a table and four chairs) also counts as a habitable room. A non-separated conservatory adds to the habitable room count if it has an internal quality door between it and the dwelling. Excluded from the room count are any room used solely as a kitchen, utility room, bathroom, cloakroom, en-suite accommodation and similar; any hallway, stairs or landing; and also any room not having a window. | No | |
| NUMBER_HEATED_ROOMS | integer | A heated room is one with a fixed heat emitter in the room. | Yes | 0.89 correlation with number of habitable rooms |
| LOW_ENERGY_LIGHTING | integer | Percentage of low energy lighting present in the property as a percentage of the total fixed lights in the property. ‘0’ indicates that no low-energy lighting is present in the building. | Yes | Same information as LIGHTING_DESCRITPION |
| NUMBER_OPEN_FIREPLACES | integer | The number of Open Fireplaces in the building. An open fireplace is a fireplace that still allows air to pass between the inside of the property and the outside. |
No | |
| HOTWATER_DESCRIPTION | String | HOT WATER. Overall description of property feature. | No | |
| FLOOR_DESCRIPTION | String | FLOOR. Overall description of property feature | No | |
| WINDOWS_DESCRIPTION | String | WINDOWS. Overall description of property feature | No | |
| WALLS_DESCRIPTION | String | WALLS. Overall description of property feature | No | |
| SECONDHEAT_DESCRIPTION | String | SECONDARY HEATING. Overall description of property feature. None if no secondary heating. | Yes | Chi squared shows relationship with MAIN_HEATING_CONTROLS and MAINS_GAS_FLAG |
| ROOF_DESCRIPTION | String | ROOF. Overall description of property feature | No | |
| MAINHEAT_DESCRIPTION | String | MAIN HEATING. Overall description of property feature | No | |
| MAINHEATCONT_DESCRIPTION | String | MAIN HEATING CONTROLS. Overall description of property feature | Yes | Same as MAIN_HEATING_CONTROL |
| LIGHTING_DESCRIPTION | String | LIGHTING. Overall description of property feature. Total number of fixed lighting outlets and total number of low-energy fixed lighting outlets | No | |
| MAIN_FUEL | String | The type of fuel used to power the central heating; Main Gas; LPG; Electricity; Oil; etc. | Yes | Chi squared shows relationship with MAIN_HEATING_CONTROLS and MAINS_GAS_FLAG.
Unique variable unlikely to be found in another source |
| WIND_TURBINE_COUNT | Integer | Number of wind turbines at the property. 0 if none. | Yes | Unique variable unlikely to be found in another source |
| HEAT_LOSS_CORRIDOOR | String | Flats and maisonettes only. Indicates that the flat contains a corridor through which heat is lost. Heat loss corridor, one of: no corridor; heated corridor; unheated corridor | No | |
| UNHEATED_CORRIDOR_LENGTH | Float | Only populated if flat or maisonette contains unheated corridor. If unheated corridor, length of sheltered wall (m2). | Yes | Missing for 92% of records |
| FLOOR_HEIGHT | Float | Storey height. Average height of the storey in metres. | No | |
| SOLAR_WATER_HEATING_FLAG | Y/N flag | Indicates whether the heating in the property is solar powered. | Yes | Missing for 51% of records. Unique variable unlikely to be found in another source |
| MECHANICAL_VENTILATION | String | Identifies the type of mechanical ventilation the property has. | Yes | Unique variable unlikely to be found in another source |
| WINDOWS_ENERGY_EFF,
MAINHEATC_ENERGY_EFF, WALLS_ENERGY_EFF, LIGHTING_ENERGY_EFF, HOT_WATER_ENERGY_EFF, MAINHEAT_ENERGY_EFF |
String | Yes | Derived from other variables in the EPC dataset | |
| WINDOWS_ENV_EFF, MAINHEATC_ENV_EFF, WALLS_ENV_EFF, LIGHTING_ENV_EFF, HOT_WATER_ENV_EFF,
MAINHEAT_ENV_EFF |
String | Yes | Derived from other variables in the EPC dataset | |
| LIGHTING_COST_CURRENT, HEATING_COST_CURRENT, HOT_WATER_COST_CURRENT | Float | Yes | Unique variables unlikely to be found in another source |
9. Code Repository
All relevant code relating to this project is available in the Github repository.