BBC micro:bit playground survey results
The BBC micro:bit playground survey was designed as an opportunity for primary school children aged 7 to 11, to learn about data and computer coding.
Using BBC micro:bit devices, pocket sized programmable computers, children collected data about their school and playground environment.
The survey was based around four distinct activities:
- measuring playground area
- investigating biodiversity – counting species of animals and plants
- comparing surface temperatures
- tracking physical activity
Playground survey data
781 classes from 518 schools registered for the Playground Survey, but many did not submit any data. Our analysis is based on submissions from 202 classes within 156 schools across the UK. As each class was free to participate and submit data in as many or as few of these activities as they liked, the number of submissions varies for each activity.

Children from across the length and breadth of the UK took part in the survey:
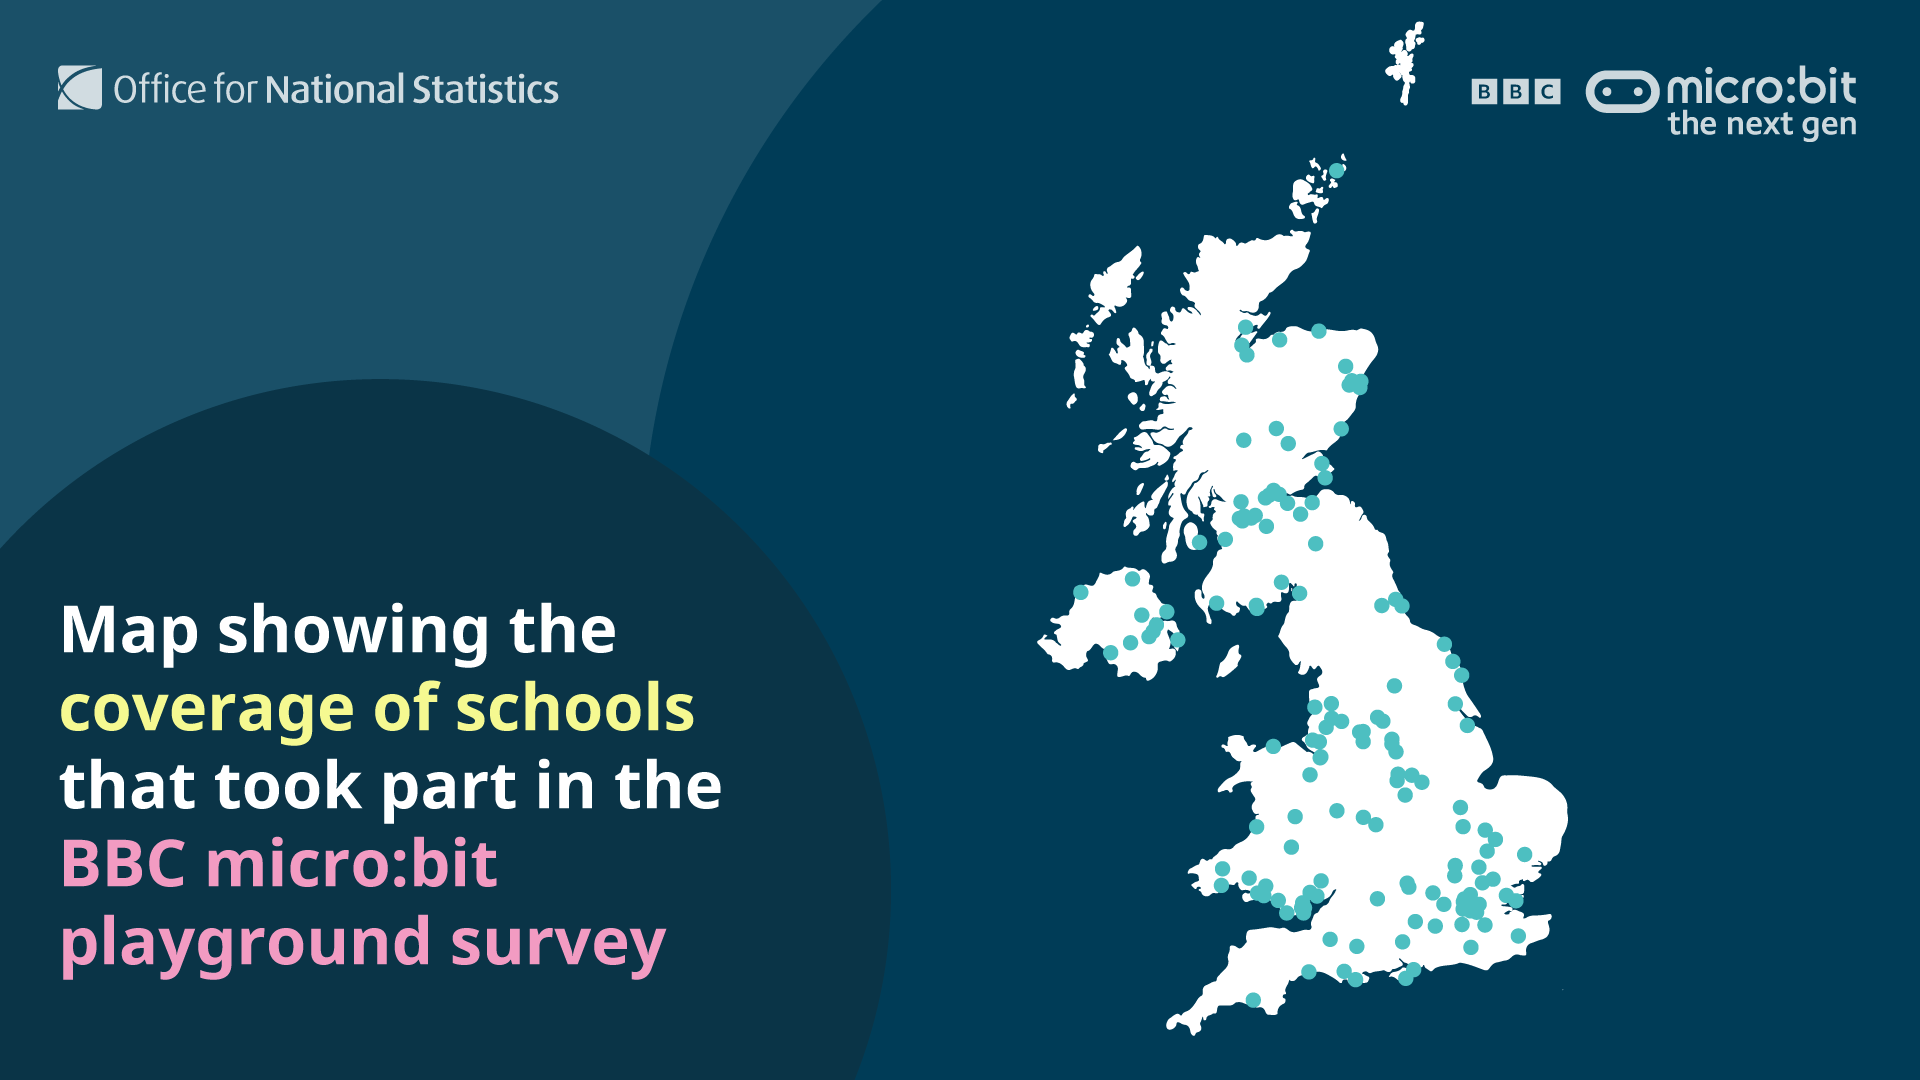
The participants were aged 7 to 11 years old. The most common age group to take part in the survey was 10- to 11-year-olds, with 55% of classes containing students in this age range. 42% of classes included 9- to 10-year-olds, 31% contained 8- to 9-year-olds and 14% contained 7- to 8-year-olds.
Following the teaching materials provided, children at the 156 participating schools collected data with their classes. The data was then submitted to a dedicated survey portal and delivered to the Office for National Statistics (ONS) for analysis.
Privacy and security are vital considerations when working with data. Features that could identify individual students were not available at any stage in the data collection or processing.
For most activities, the data collected by individual students was averaged within their classes before submission. The exception to this was the physical activity data in which anonymised individual records were submitted. However, the only information this contained were the time durations in seconds between different activity levels and a synthetically generated student ID number.
It is important to note that the findings from this study describe only the limited data submitted through the playground survey and are not representative of all children or schools across the UK. A much larger sample of students would be needed for this.
Large surveys, like the ones the ONS uses to create Official Statistics, are carefully designed to minimize the “statistical bias” between a sample of data and the population it is supposed to represent. That has not been achieved here and the results are not representative.
While readers may find our results interesting, we ask that you do not draw too strong a conclusion from anything presented here as it can only tell us about the specific data that was collected. These findings are not Official Statistics of the ONS.
Physical activity
Data was collected on student’s physical activity levels by programming the micro:bit device to monitor movement. Students then wore it on their person or mobility equipment during their school break or lunch time.
The micro:bit measured the intensity of each pupil’s movements second-by-second using an accelerometer, then returned the total time spent across different levels of movement for each pupil.
In total, 58 classes submitted student physical activity data from 1,112 pupils, however, quality issues were identified for some of the data.
These included submissions where the total tracking time was zero seconds, probably because the device was not correctly activated. Some submissions included a total tracking time of several hours, probably because the tracking was not deactivated at appropriate times.
Quality checks like these are an important part of analysing data, as the inclusion of poor-quality data can lead to misleading results. Our aim was to understand how much activity students did during their break and lunch time.
For this reason, we removed any submissions longer than 100 minutes or shorter than 10 minutes, to best match the duration of time a typical student has for breaks within a school day. After removing suspicious data, our analysis was based on data from 802 pupils across 52 unique classes.
Despite some quality assurance, there are still limitations with the data that should be considered. These include, but are not limited to:
- Human error: The data collection assumes the devices were activated and deactivated promptly before and after break times and that the children were wearing the devices consistently and correctly.
- Representative behaviour: The teaching materials emphasised a request for the students to behave as they would normally while wearing the devices. However, the extent to which this was followed is unknown.
- Sample bias: The data represents a self-selected sample of schools that participated in the survey. These may therefore represent some demographics and not others.
Additionally, when interpreting the data, it is important to note the difference between measuring physical activity second-by-second, as was done here, and time spent participating in activity overall.
This is easiest explained by giving an example in which someone plays a 60-minute game of football. They may spend 50 minutes of that time standing relatively idle in their position on the field, but with periodic intense bursts of activity as the ball approaches. This may be especially true for a goalkeeper.
In this scenario, the accelerometer on a micro:bit would measure a relatively small proportion of the time spent moving around despite a long time spent participating in active play.
Movement levels
Student’s movements were measured second-by-second, and the total time spent across different levels of movement for each was recorded. These movement levels were measured in a numeric scale from 0 to 3, where Level 0 is stationary or “inactive” and Levels 1, 2, and 3 represent “low”, “mild”, and “high” intensity levels of movement, respectively.
We found that on average (median), the students in the survey spent 54% of their break time stationary (i.e. inactive). The variation between students however was substantial, with one-in-five spending less than 40% of their break inactive and one-in-five spending more than two-thirds inactive.
On average, the percentage of their break time spent in low intensity movement was 32%, and the average time spent on mild and high intensity levels of movement were 7% and 6% respectively. For more information read our detailed findings.
It should be noted that this inactive time could include time spent eating lunch or participating in creative play (like art) or games like chess. We reemphasise the distinction between time playing and time physically moving (where a game of “tag” for example may involve short bursts of movement and larger periods of standing relatively still).
To build a wider picture, we investigated whether additional data could unlock extra information when combined with the survey data itself. We wondered whether there was a measurable impact from the weather on student’s physical activity. We may expect that poor weather would decrease activity levels, but does the data back this up or not?
The date that the class took part in the activity was recorded for around half of the submissions. This, alongside the school location, allowed us to check historic weather data and determine whether the children’s break and lunchtimes were likely during wet or dry weather conditions.
Breaking down our results between dry days and wet days suggests our expectation may be right. The data collected showed that, on average, higher levels of activity were measured during dry weather conditions and higher levels of inactivity were measured during wet weather conditions.
For example, on average, students spent 60% of their break time stationary (inactive) on wet days, compared to an average of 52% of their time spent inactive on dry days. A more detailed comparison is given in Figure 1.
Figure 1: Comparisons between the average (median) percentage of time spent between different movement levels on wet and dry weather days.
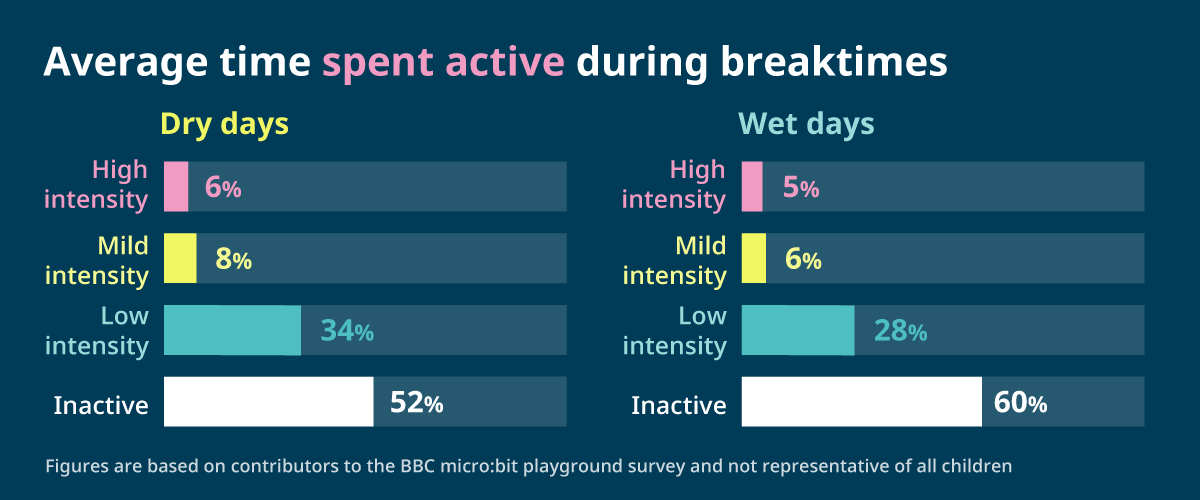
Technical note: because these averages are the median, i.e. the mid-point, of the spread of individual student’s time percentages, the sum of the four averages does not necessarily add up to 100%.
In addition to monitoring the movement levels, most students (but not all) activated an additional programme which estimated and categorised the form of activity the pupil was doing in real-time based on their movements. This was achieved by the micro:bit running a machine learning model.
Machine learning is a specific type of Artificial Intelligence (AI) in which computers are taught to recognise patterns in data. In this case, a machine learning model was trained on a group of children performing different physical activities. Through this training, the model learnt to identify patterns in the children’s movement that are associated with a particular physical activity.
These activities included sitting and/or chatting, walking, running and jumping. Once trained, the model can be used to make predictions about which of these activities a wearer of the device is most likely doing based on their current movement pattern.
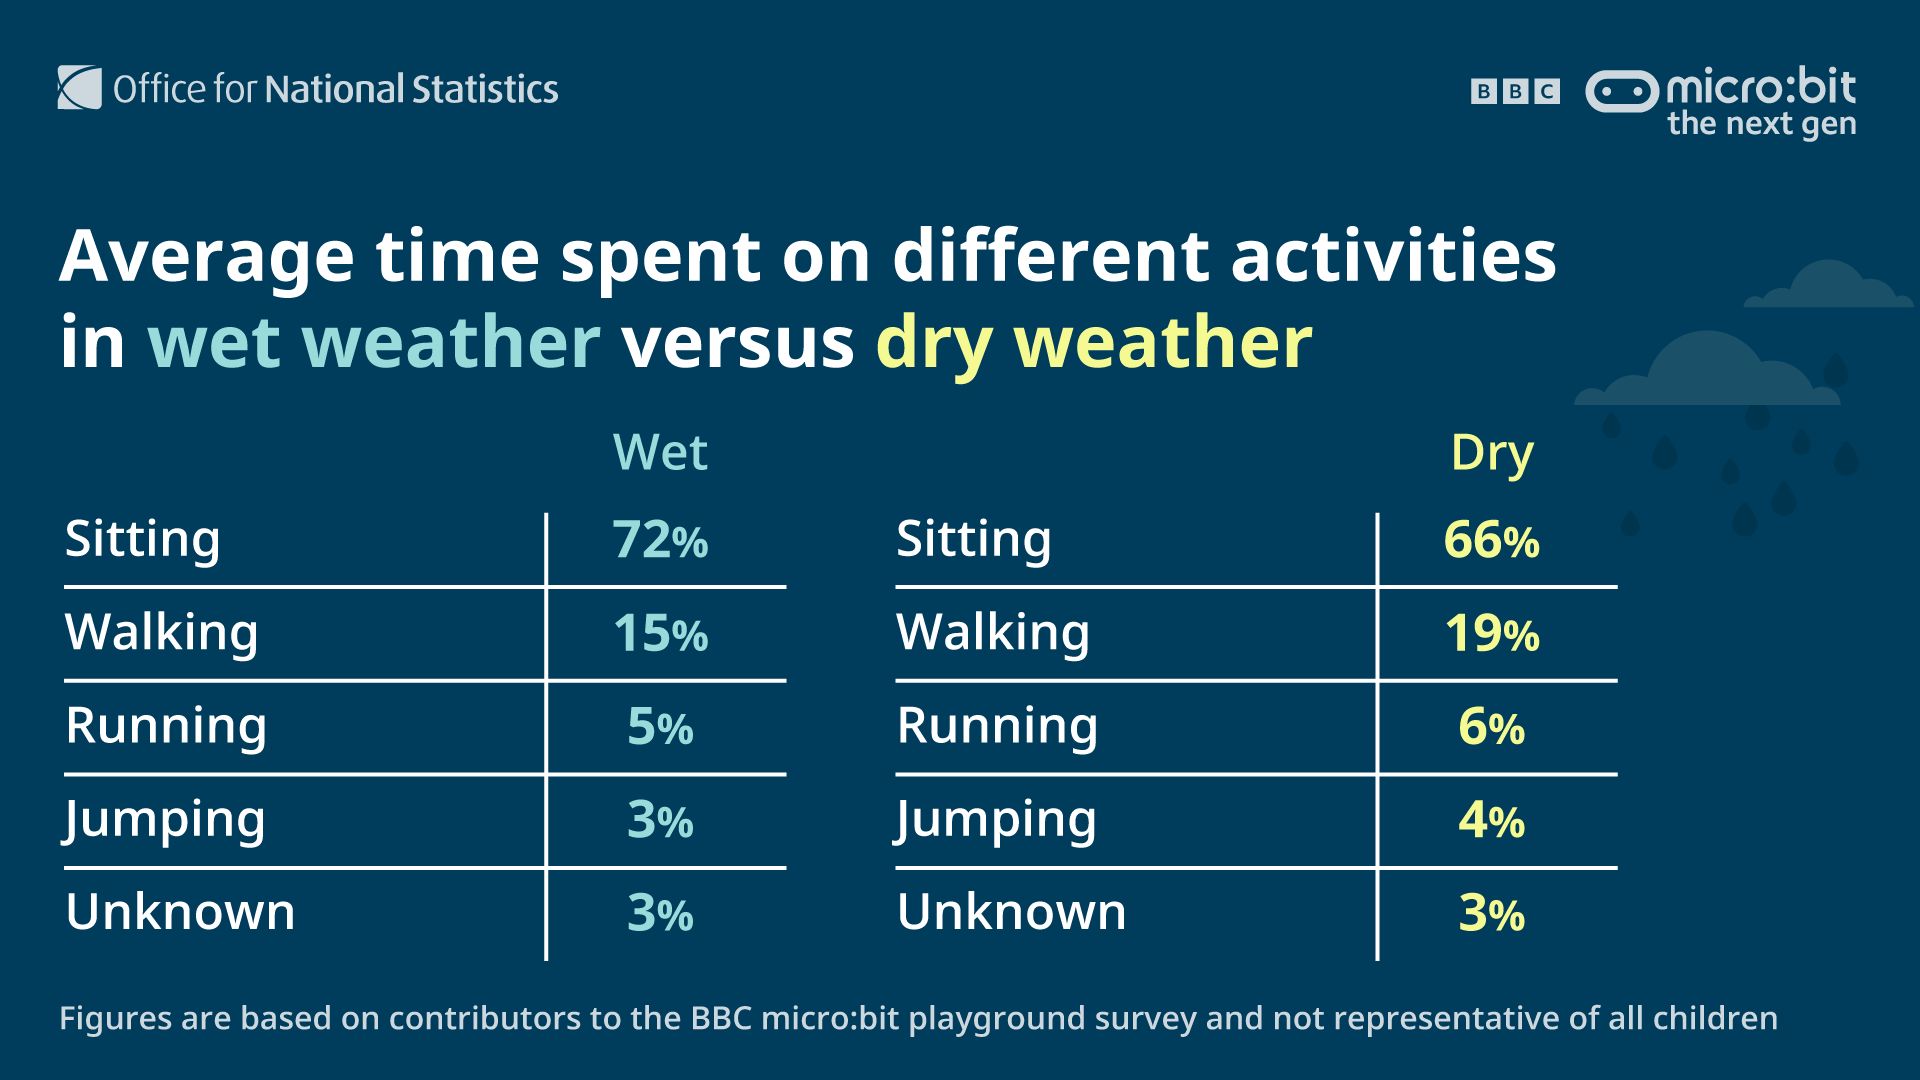
With the model-based predictions on activity types, we again breakdown our results by dry and wet weather conditions, giving the results summarised in Figure 2.
As before, we find that the percentage of time spent on physical activities, like walking, running and jumping was higher on dry weather days than wet weather days, with the reverse true for percentage of time spent sitting/chatting.
Figure 2: Summary of the average (median) recorded time spent between different activity types on wet and dry days.
Biodiversity counter
In this activity, participants were tasked with programming the micro:bit device as a counter and then using it to count the number of unique varieties of plants and animals in their playground.
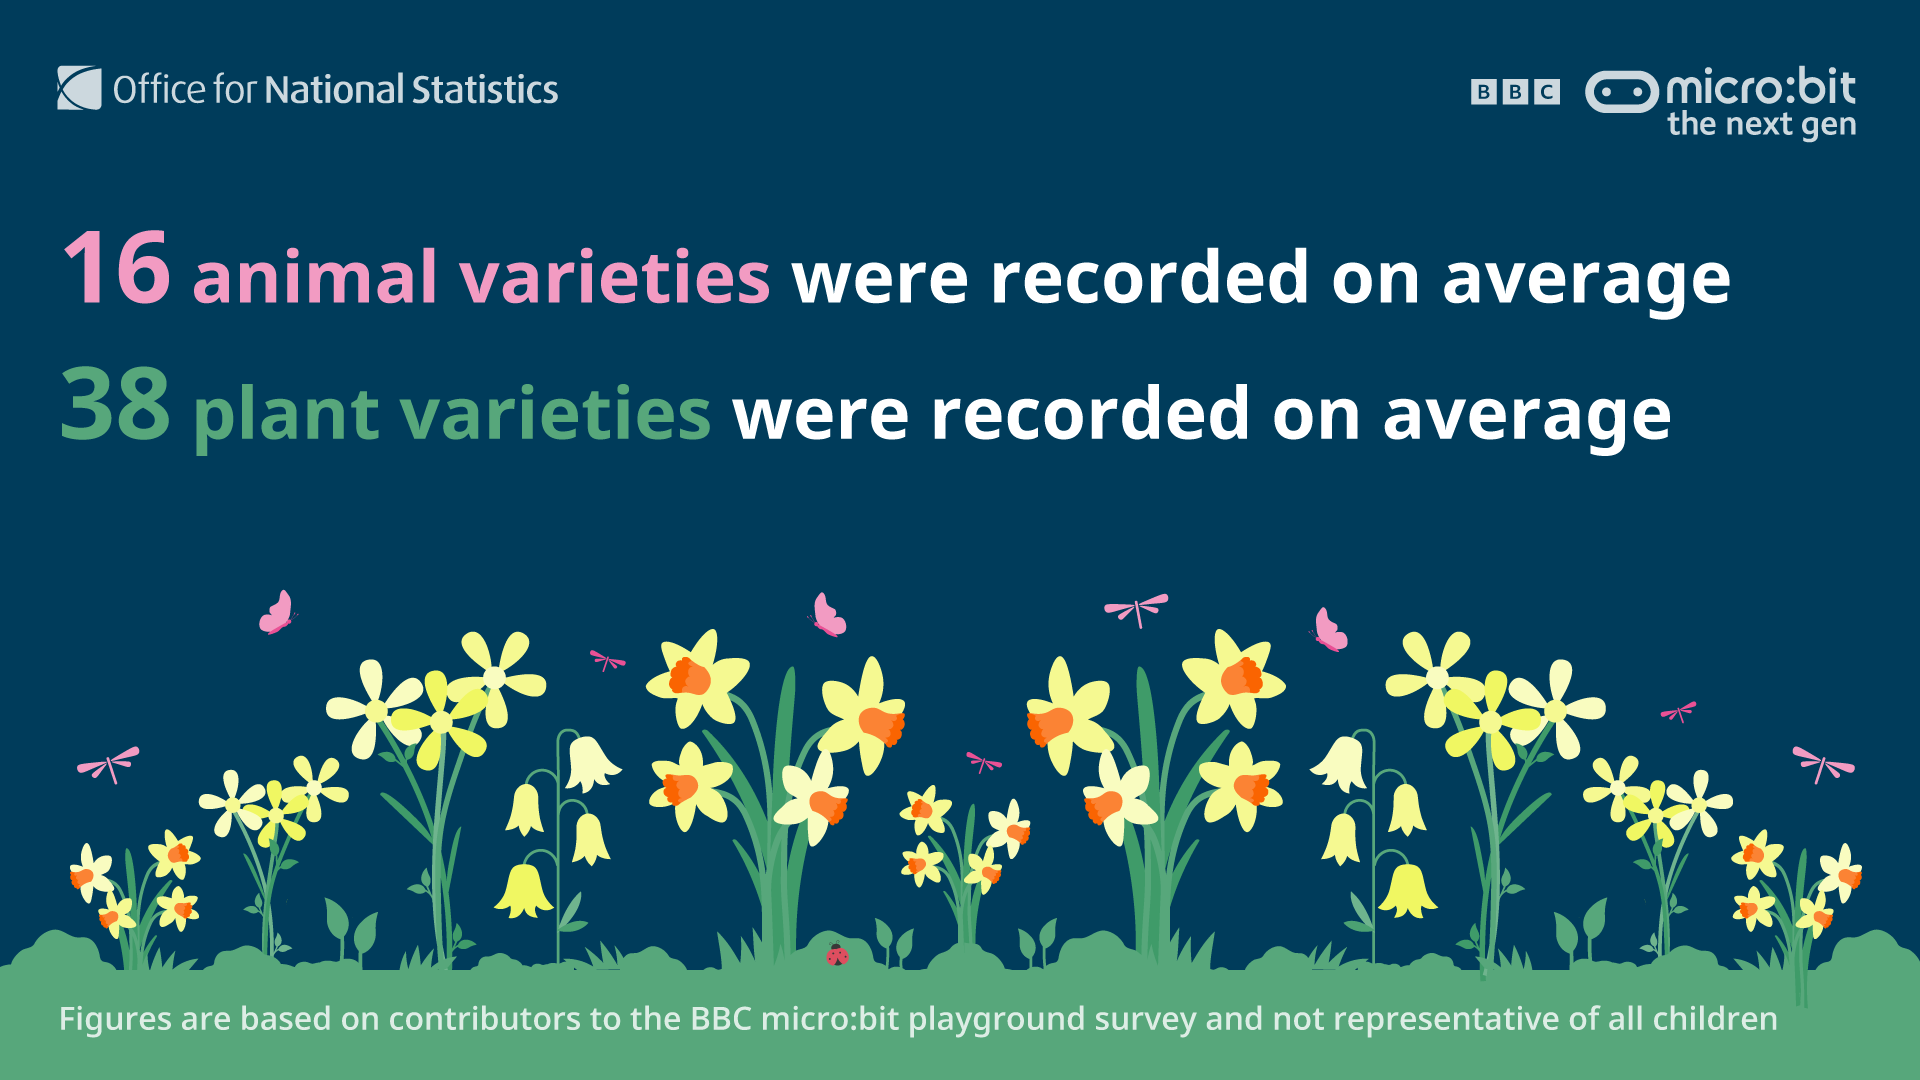
In general, higher counts of plant varieties were reported than animal varieties. The mean animal count was 16 varieties, and the mean plant count was 38 varieties.
There was a substantial level of variability, for example, some classes submitted plant counts as low as two, while others submitted counts as high as 125. The animal species counts varied too, from as low as two in one class, to as high as 57 in another. For more information read our detailed findings.
Playground area
In the playground area activity, pupils were tasked with using the micro:bit device, programmed as a pedometer, to measure and calculate the area of their playground.
Pupils divided the playground into sections, measuring distances using a pre-set average step length, and calculated rectangular areas using length × width to measure the total area of a school’s playground.
In addition to this, an optional task involved doing the same to measure the area of synthetic areas and natural surfaces separately. For example, a “synthetic” playground and a “natural” playing field.
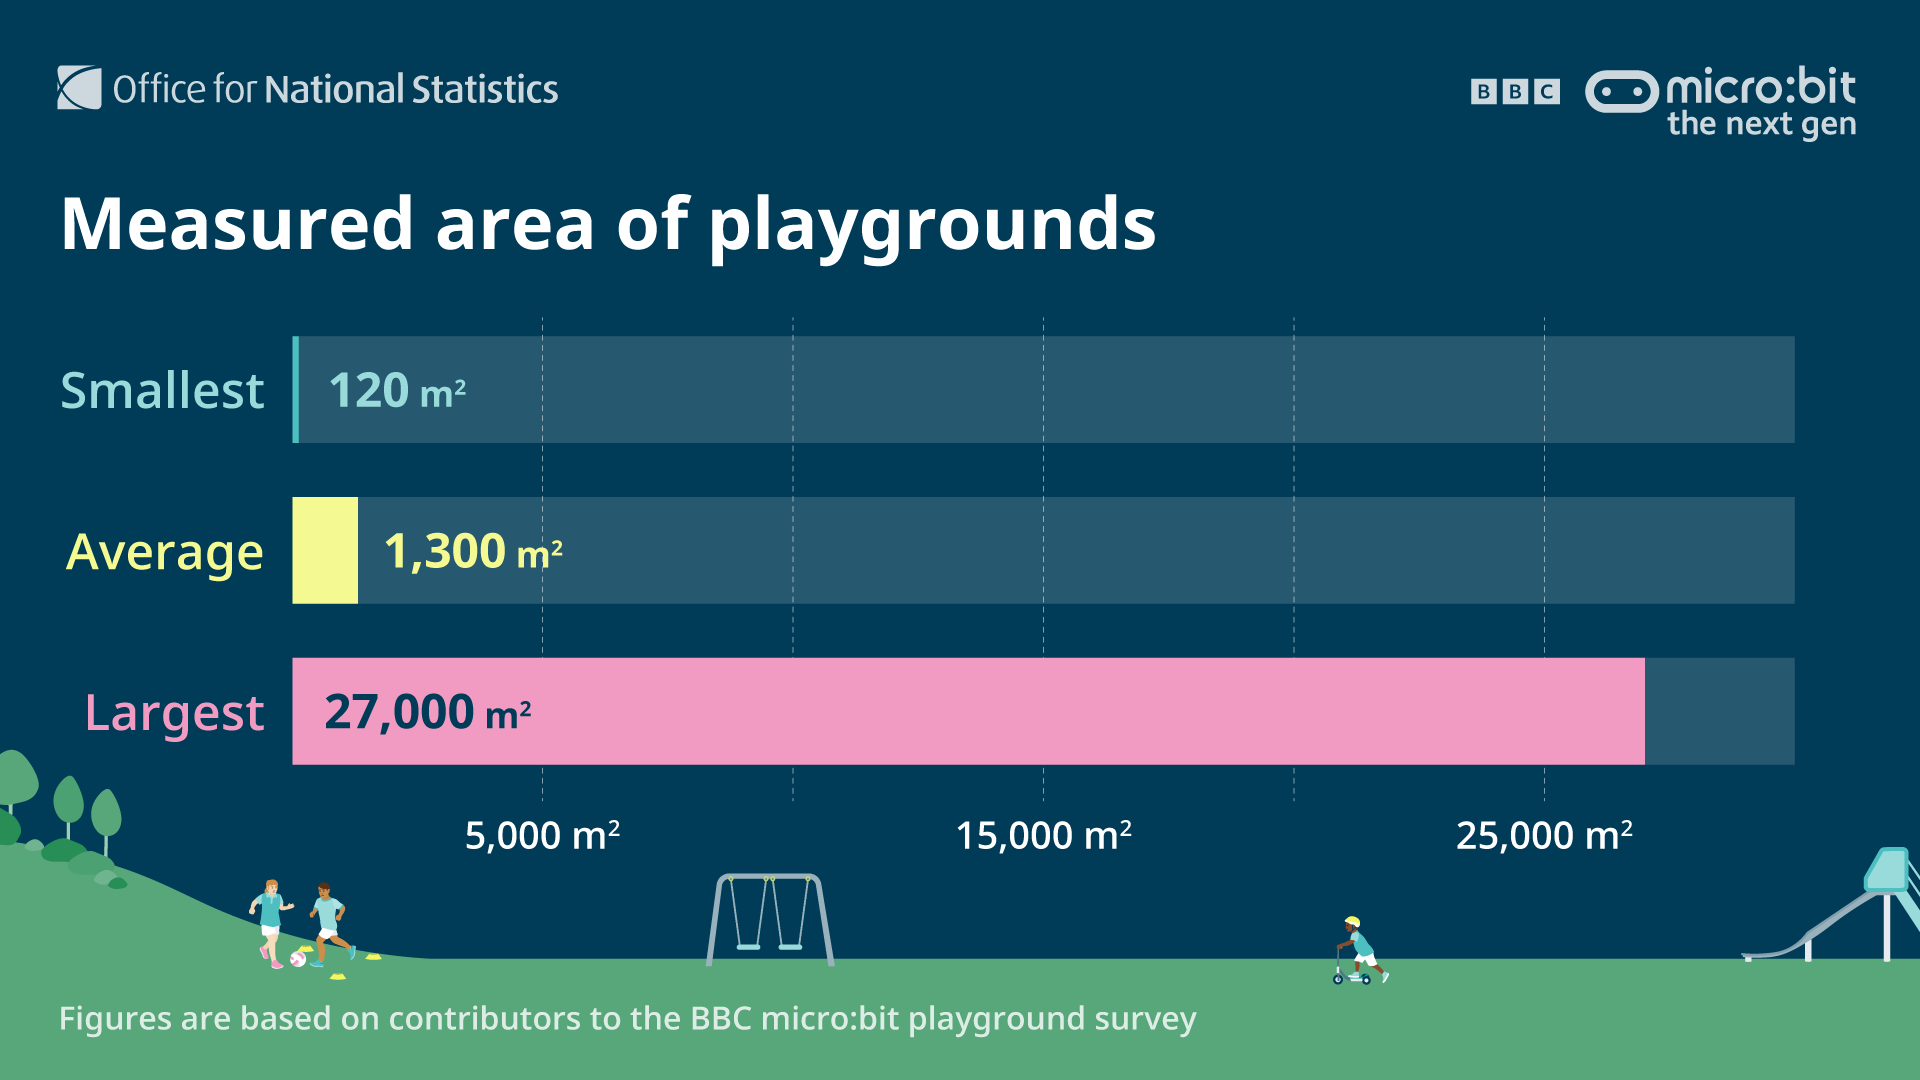
Unfortunately, the sample of area data was particularly small. Only 57 measurements of the “total area” were submitted, and only 15 and 18 submissions of the natural and artificial surface areas were received respectively.
There was a lot of variation in the submitted total playground areas, with the largest measured area being 225 times bigger than the smallest. The average area was around 1,300m2, around one fifth of the size of a football pitch, and 80% of submitted schools measured total areas within the range of 400m2 to 4000m2. A summary of these measurements can be found in Figure 3.
Figure 3: Summary of the biggest, smallest and average playground areas measured in the survey.
Comparing surface temperatures
Pupils were tasked with collecting data on surface temperatures in their playgrounds using the micro:bit device’s internal thermometer.
The task was to measure two synthetic surfaces and two natural surfaces. For example, the playground itself and a playing field space. In total, 142 classes across 118 schools submitted this data.
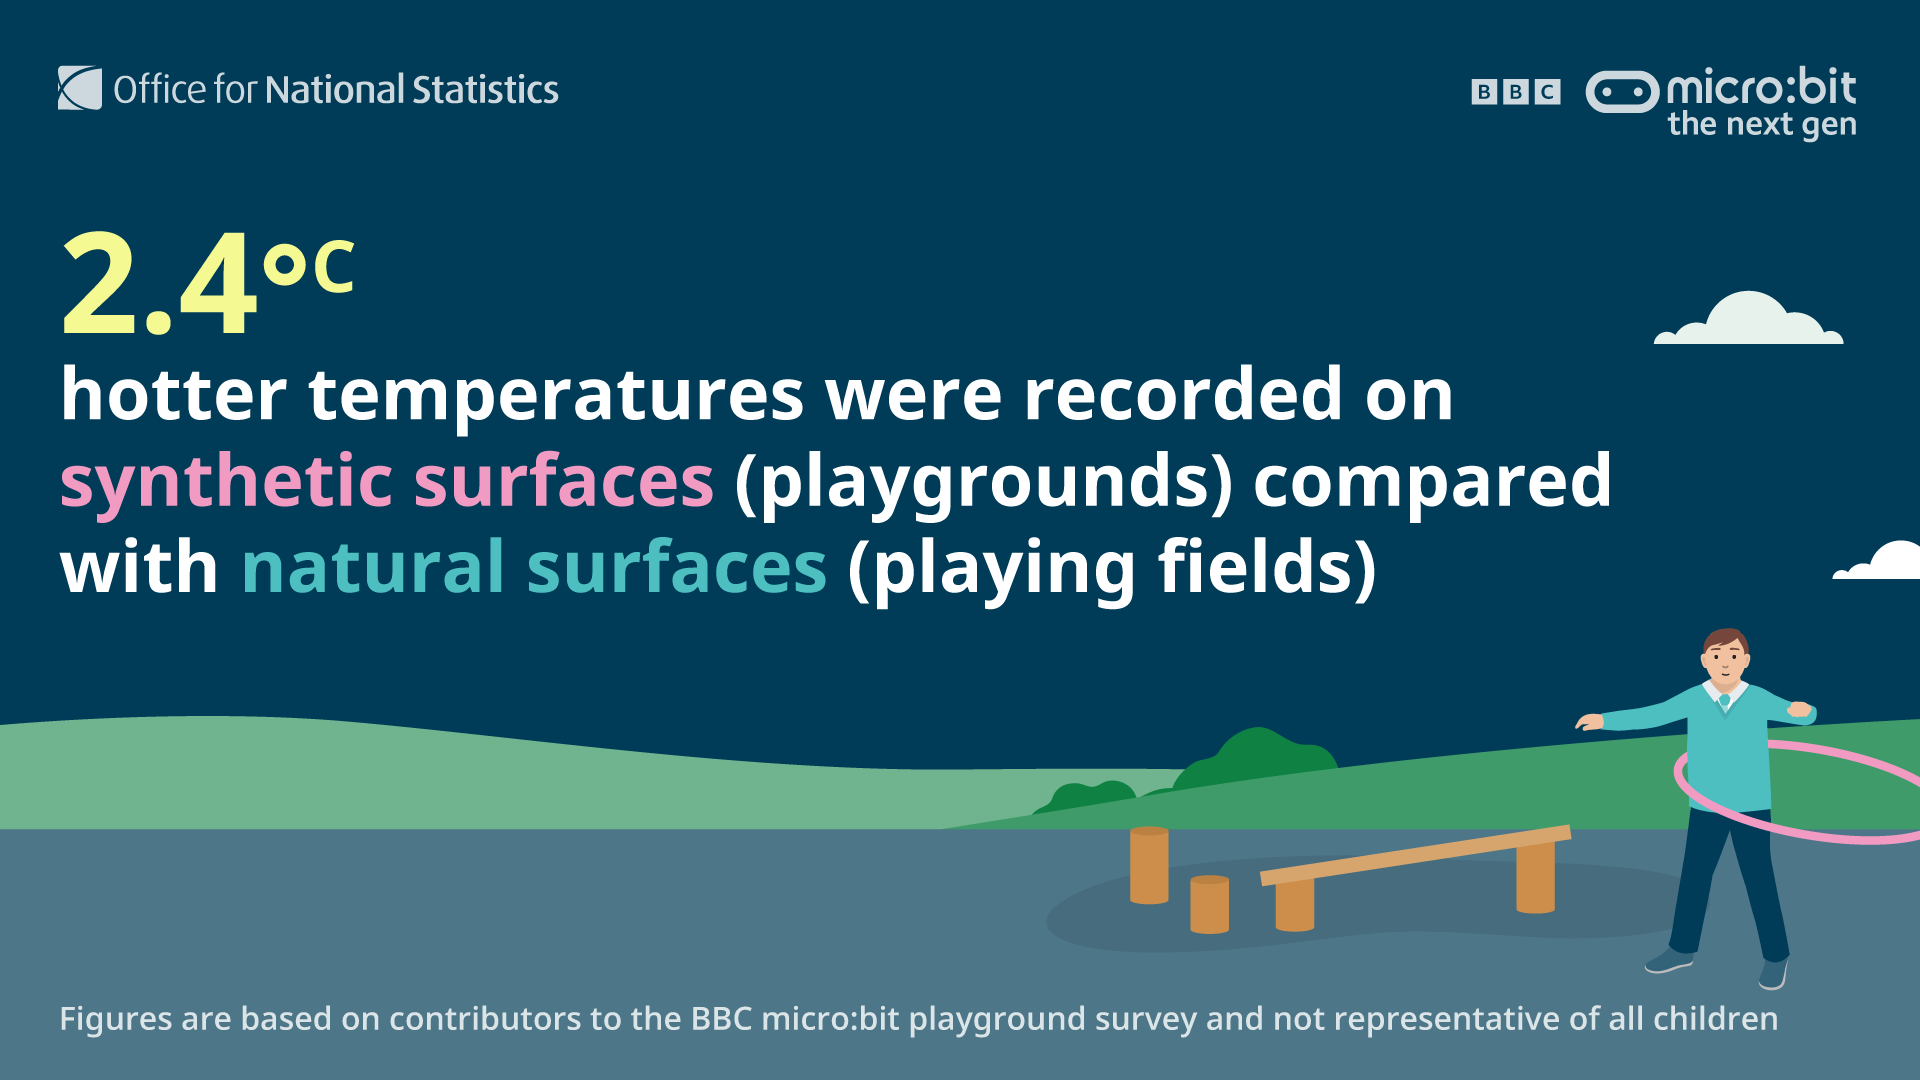
In the data, synthetic surfaces were on average 2.4°C warmer than natural surfaces and exhibited a broader range of temperatures.
The higher temperatures for artificial materials reported in the survey data is consistent with a known phenomenon behind urban heat islands, in which human-produced materials in urban environments absorb more heat than natural surfaces.
This suggests that a higher prevalence of synthetic surfaces in a school environment could exacerbate heat-related discomfort in warmer weather.
Conclusion
We have presented a series of findings from the data collected during the playground survey. Most notably, the difference in the physical activity of children during school because of the weather.
But data is not just about satisfying a curiosity, data can be a powerful tool for making decisions and inspiring actions. We hope the playground survey and its results will inspire young people to think more about their school environments, the way they interact with it and what steps they can take to change this.
The data collected in the survey, whilst limited, produced findings that are consistent with poor weather leading to lower levels of activity among young people. The health benefits of physical activity are well established and evidence suggests active play during school breaks is beneficial for focus within class and ultimately the education of children.
Data insights like these could prompt schools to take more proactive approaches to enhance indoor play or install more sheltered areas in playgrounds to keep children engaged in physical activity, regardless of the weather.
The UK Chief Medical Officers recommend that all children and young people should take part in moderate to vigorous intensity physical activity for at least 60 minutes every day, but evidence suggests fewer than half of children currently do.
Data collected in the Sport England’s Active Lives Survey: 2022-23 show that across England, on average around 44% of children aged 7 to 11 are taking part in physical activity for the recommended one hour or more a day. 35% get less than 30 minutes per day, and 21% get between 30 and 60 minutes of activity per day.
However, the data suggests that the proportion of school children classified as being active has gradually been on the rise when looking at the long-term picture. This data includes activity inside and outside of school, and come from a much bigger and more robust survey than the playground survey.
Only by collecting and understanding data and unlocking the story it has to tell with statistics and data science, can we start taking action to address and improve things. This is why we’re passionate about data science in the ONS; we aim to answer real questions that help drive better decisions for the public good.
We thank our partners in the BBC and micro:bit Educational Foundation for inviting us to be part of the playground survey. We also want to thank all the schools, teachers and students that took part and made it possible.
But as Mary Gregory, Director, Population Statistics, ONS says, “there’s still room for more to get involved in this data challenge.”
The learning resources are still available for classes to take part in the activities, so why not find out how your playground compares to our findings?
“In helping children become data-literate now, we are preparing them for a future where data will play an even more critical role in decision-making and problem-solving”.
Read more about inspiring the next generation through playground data, on the National Statistical blog. You can read additional commentary on the BBC Teach pages.
The author and Data Science Campus would like to acknowledge and thank the various teams, across the Data Science Campus, Reproducible Data Science and Analysis, and ONS Communications that have contributed to this analysis, the write-up and the visual outputs contained within.