BBC micro:bit playground survey results (Detailed statistical findings)
This page provides additional detail to our findings presented in our technical blog (advised to be read first)
Here we provide more information on the distributions of the data. These distributions reveal more about the variability of the data, that is otherwise hidden when discussing averages, but which contains useful insights.
The final activity wise data submissions were as follows:
| Activity | Number of classes | Number of schools |
| Playground area | 57 | 51 |
| Biodiversity counter | 99 | 82 |
| Surface temperature | 142 | 118 |
| Physical activity tracker | 58 (1,112 individual pupils) | 44 |
Physical activity tracking
The distributions of the percentage of time that students spent across the four different movement levels is given in Figure 1.
Figure 1: Distributions in the percentage of break time each pupil spent between the different levels of movement, as tracked by the micro:bit. The dashed lines show the quartiles within the distribution, with the central one being the median (average) value.
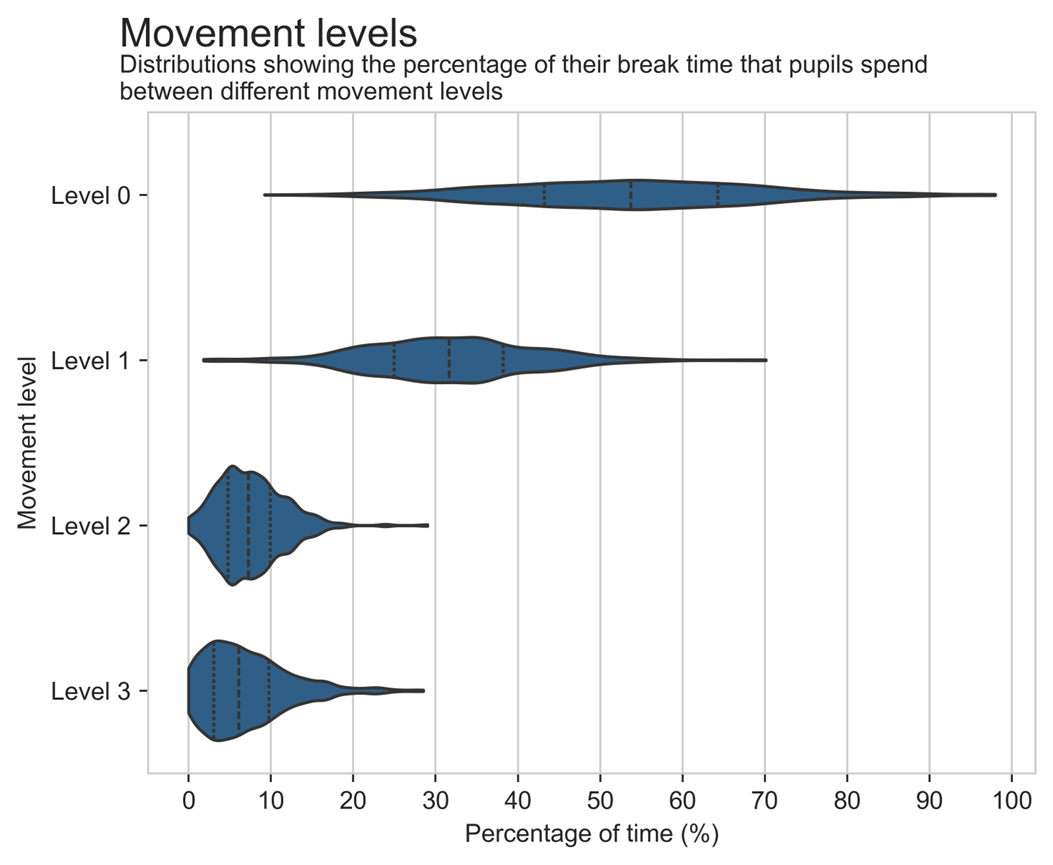
The proportion of time spent between inactivity and activity varied substantially between individual pupils.
- The majority (60%) spent between 40% and 66% of their break time at movement Level 0 (inactive), with an average (median) of 54% per pupil. This could include time spent sat around eating lunch, participating in creative play (such as art) or talking to friends. But this varied between individuals, with around 20% spending over two thirds of their time in this state and 20% of pupils spending fewer than 40% of their time stationary.
- Conversely, this means on average, pupils spent around 46% of their time in some form of activity. Indeed, 20% of pupils spent more than 60% or more of their break time moving around.
- On average, pupils spent around 32% (one third) of their time in low intensity movement (for example walking), 7% on moderate intensity movement (such as running) and around 6% on vigorous movement (such as jumping). Note the above activities are illustrative suggestions only and may not reflect individual pupil’s physical capabilities.
- 10% of pupils spent over a quarter of their break time in either level 2 or 3 activities (i.e. mild to intense movement).
Weather
The distributions of the percentage of time that students spent across the four different movement levels but broken down between wet and dry weather conditions is given in Figure 2.
Figure 2: Distributions of the percentage of break time spent between the different movement levels. These are broken down between the pupils who were tracked on days with rainy conditions versus those who were tracked on days with dry weather conditions. The dashed lines show the quartiles within the distribution, with the central one being the median (average) value.
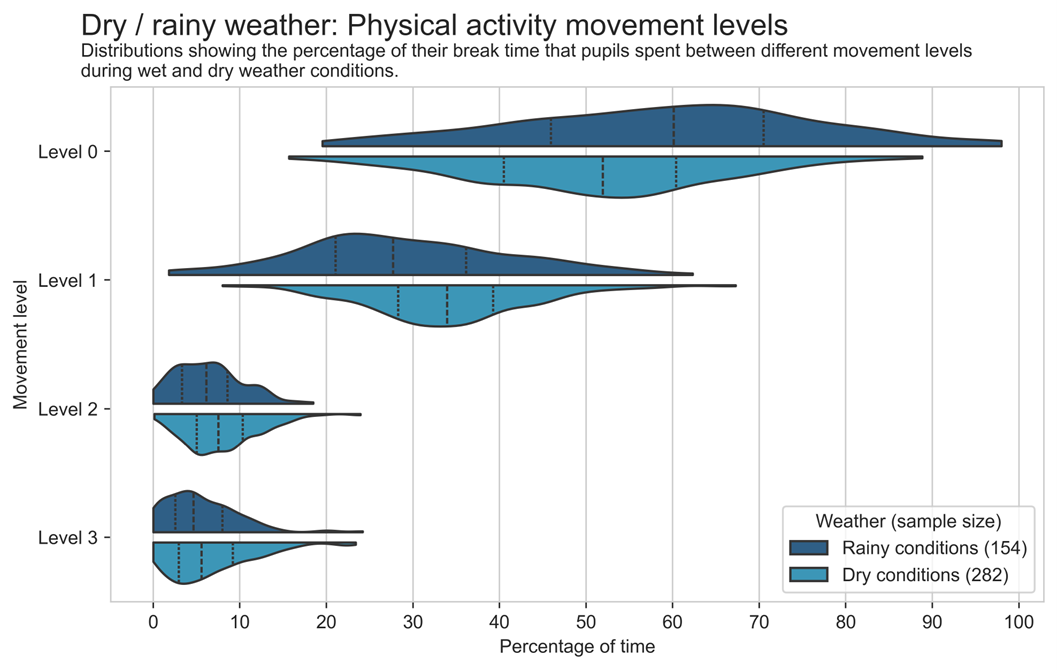
As shown in Figure 2, we find that on rainy days, the average proportion of time being inactive (i.e. time spent at Movement Level 0) was 60% compared to 51% on dry days.
In dry weather conditions, a higher percentage of break time was spent at all active movement levels (1, 2 and 3) than during wet weather. In wet-weather conditions, the average proportion of time spent on Level 1, 2, and 3 movement (i.e. low, mild, and high intensity movement) was 29%, 6%, and 5% per cent respectively compared to averages of 34%, 8%, and 7% during dry weather conditions.
The substantial level of variability previously seen between individual pupils is still present. This can be seen in the broad range of values in the percentage of time spent in Levels 0 and 1 in Figure 2, and interquartile range values of around 20 to 25 percentage points across Level 0, for both dry and wet weather.
Activity Types
Looking at the percentage of break time each pupil spent between the different activity types (for the data collected for 686 pupils where the machine learning model-based predictions for activity types) gives the distributions in Figure 3.
Figure 3: Distributions of the percentage of break time each pupil spent between different activity types, as tracked by the micro:bit and inferred from a machine learning model in real-time. The dashed lines show the quartiles within the distribution, with the
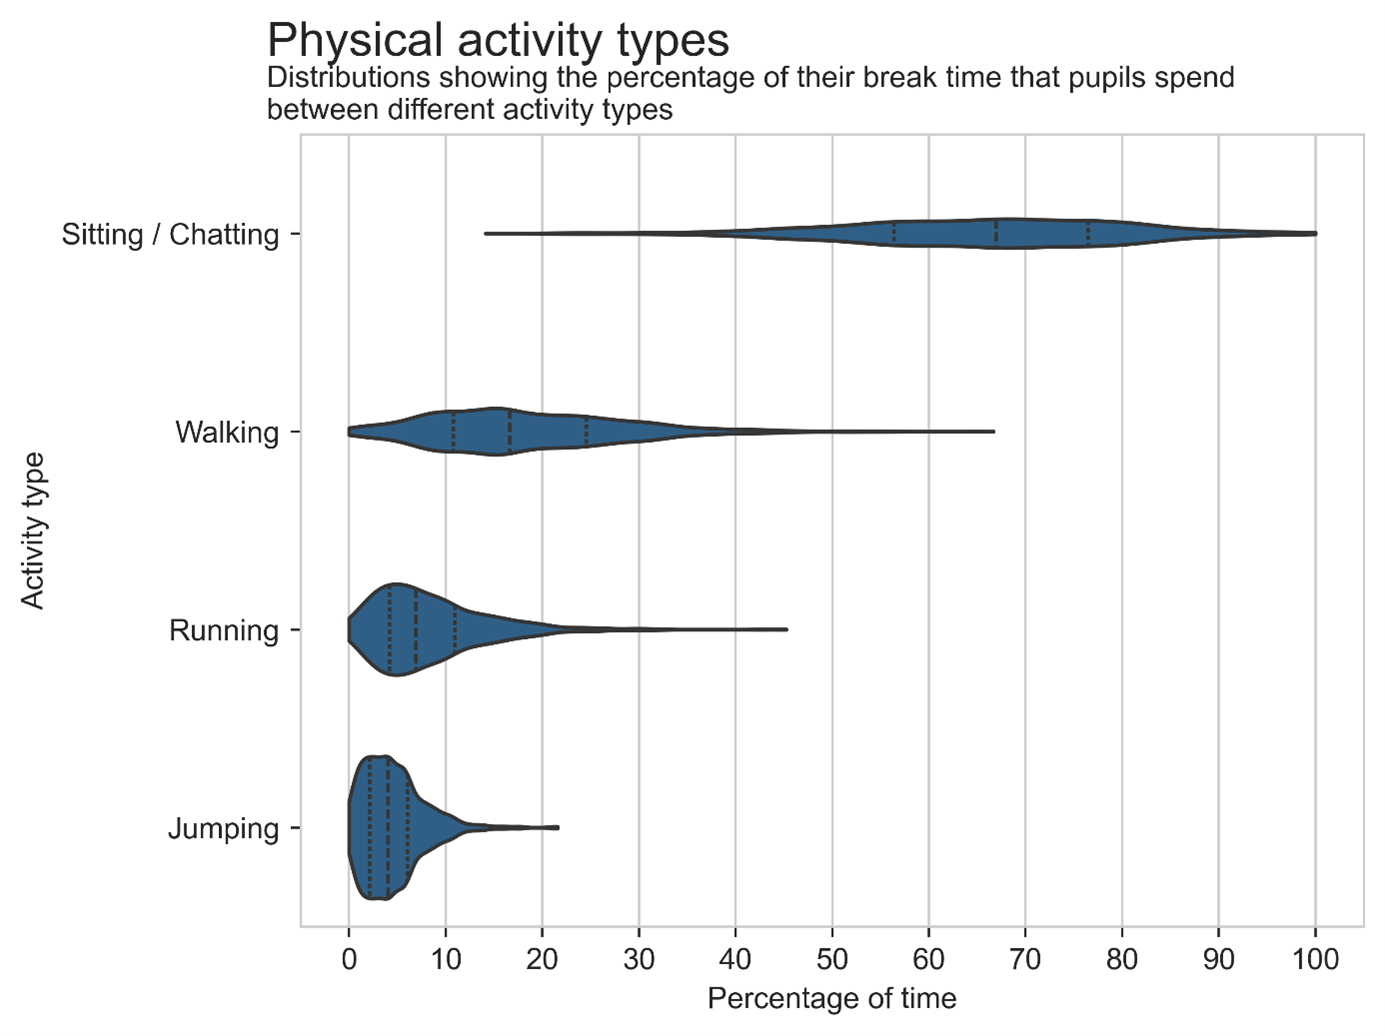
The distributions reveals that most (87% of) pupils spent more than half their break time doing the activity “sitting and/or chatting” (which could include time eating lunch, participating in creative play (such as art) or talking to friends).
- On average, pupils spent two thirds of their time sitting around or chatting. But this varied greatly from pupil to pupil, with 14% of pupils spending less than half the time sitting, whilst 17% of pupils spent over 80% of their time sitting.
- On average, pupils spent approximately 17% of their time walking around, but with substantial variation from pupil to pupil. One in five pupils spending more than quarter of their time walking around and one in five spending less than 10 per cent of their time walking.
- On average, pupils spent approximately 7% of their time running around. One in four spending more than quarter of the time running and one in four spending 10% or less of their time running.
- On average, pupils spent approximately 4% of their time jumping around. The individual values varied across pupils, with some spending as little as 0% of their time jumping, whilst others spent up to 22% of their time jumping.
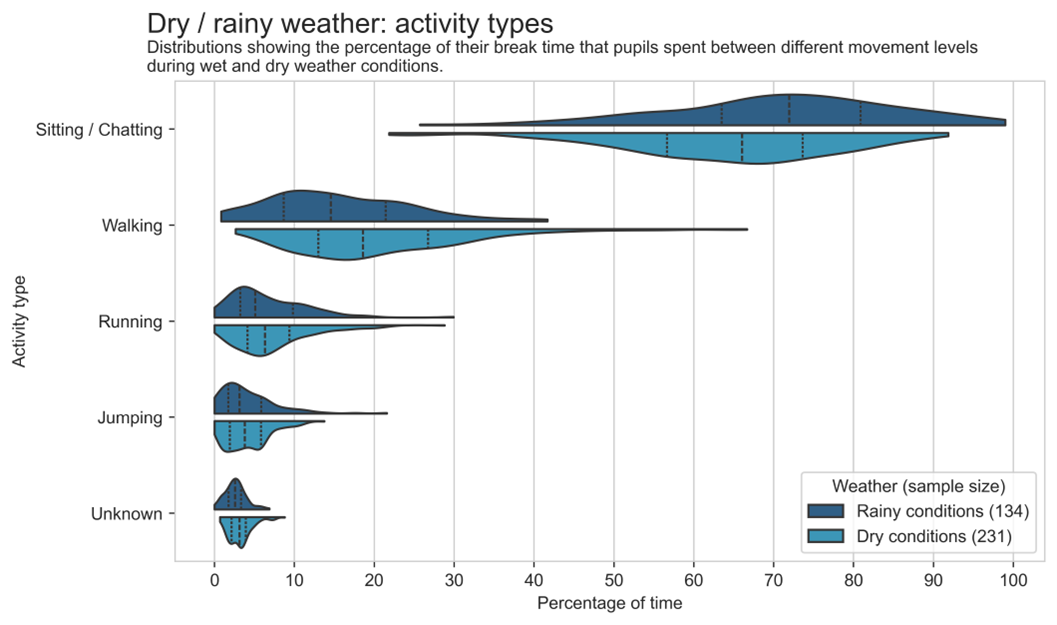
The breakdowns of time spent between the different activity types, by rainy or dry weather-conditions, reveals a similar set of results (Figure 4). On average, pupils spent a higher proportion of their break time walking, running, and jumping during dry weather conditions and a higher proportion of their break time sitting and/or chatting during rainy weather conditions.
Figure 4: Distributions of the percentage of break time spent between different activity types, broken down by wet and dry weather conditions on the day. The dashed lines show the quartiles within the distribution, with the central one being the median (average) value.
Comparing Surface temperatures
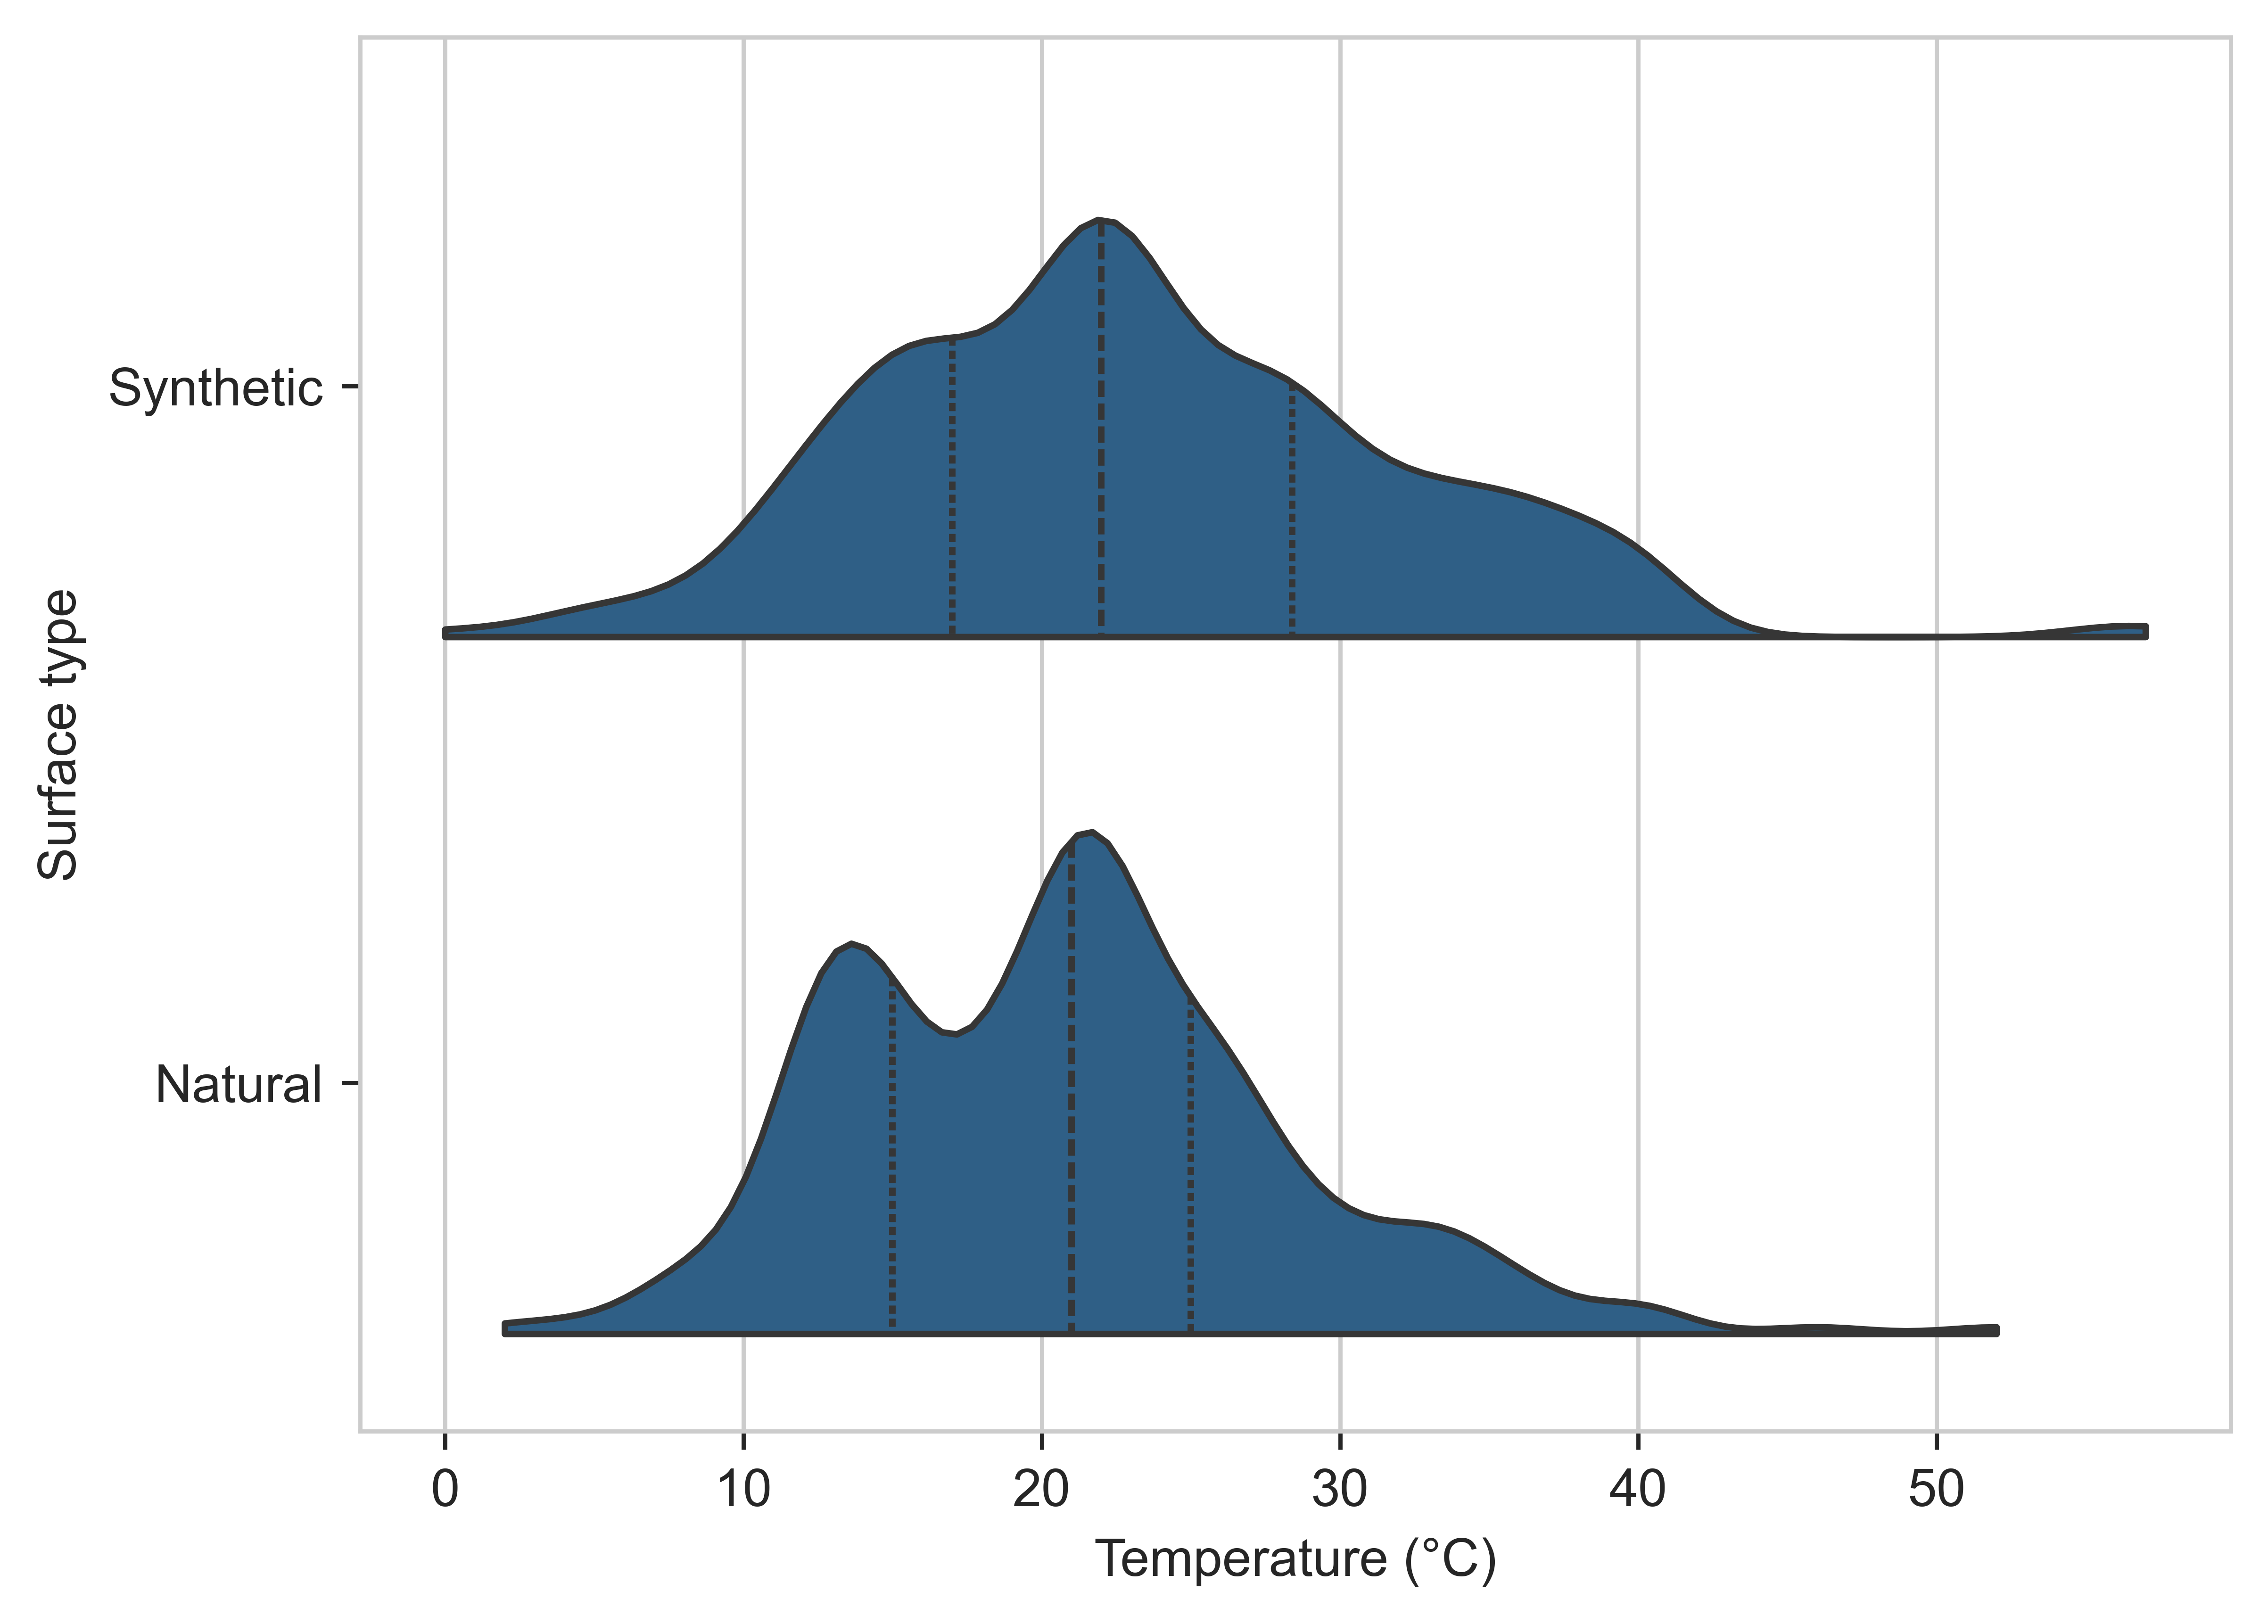
Students collected data on surface temperatures, measuring two synthetic surfaces and two natural surfaces. The data recorded synthetic surfaces as being on average 2.4°C warmer than natural surfaces.
The distributions between these two surface types are shown in Figure 5. A broader range of temperatures was found for synthetic surfaces (as can be seen in the broader distribution of values in the figure).
Figure 5: The distributions of measured surface temperatures for synthetic and natural surface types. The three dashed lines within the shaded region represent the 25th, 50th (median) and 75th quartiles. The boldest central dashed line therefore represents the median (average) value.
Measuring biodiversity
Tasking 7- to 11-year-old children to count unique animals and plants is likely to lead to inconsistencies in the quality of data collection. Particularly in relation to duplication of counts in which multiple incidences of the same species are counted. As a result, the quality and accuracy of the raw data collected through this activity is likely questionable.
Data was submitted from 99 classes across the UK, (with 51 classes in England, 21 in Scotland, 16 in Northern Ireland and 11 in Wales). Figure 6 shows the distributions of counts between animal species and plant species within this data.
Figure 6: Distributions of the counts of animals and plants submitted during the survey. The dashed lines show the quartiles within the distribution, with the central one being the median (average).
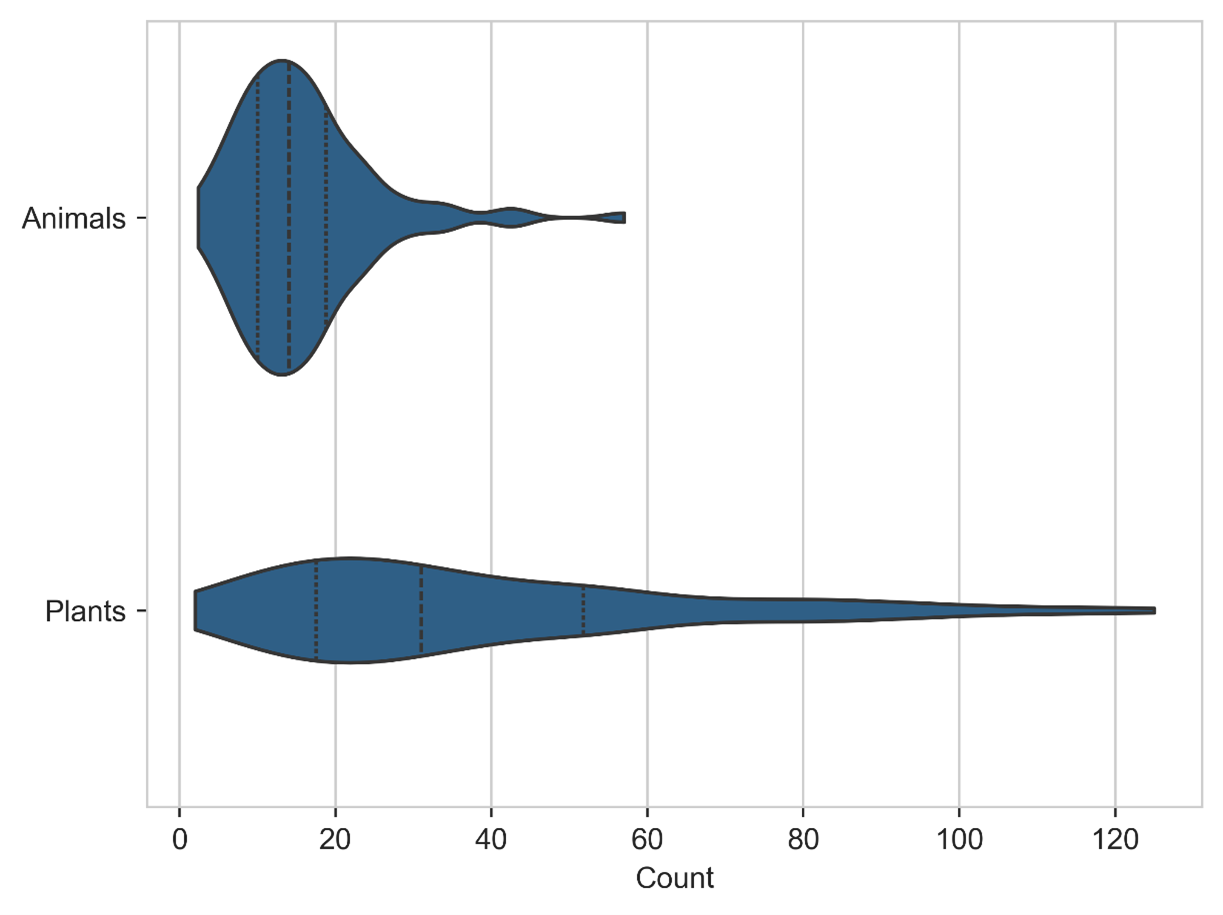
In general, more plant species were found than animal species. The mean animal count was 16 species, and the mean plant count was 38 species. But there was a substantial level of variability, for example, some classes submitted plant counts as low as two, while others submitted counts as high as 125. The animal species counts varied too, from as low as two in one class, to as high as 57 in another.
Read more about inspiring the next generation through playground data, on the National Statistical blog. You can read additional commentary on the BBC Teach pages.