Access to services using multimodal transport networks
The ability for a household to access a range of services necessary for day-to-day living is of great importance to local authorities and policymakers. The impacts on health, economic and social stability due to lack of access to crucial services, especially in deprived areas, further limits job opportunities and social well-being in the communities. The Welsh Index of Multiple Deprivation (WIMD) includes an access to services domain that contains nine indicators, each being a weighted average of the travel time (in minutes) by public and private transport to the service (pharmacies, food shops, general practitioners and others). In 2014, it identified that high deprivation was widespread not only across several rural areas of Wales but also in some pockets near large urban areas.
The Data Science Campus worked with Welsh Government officials to develop a tool that will enable the estimates of travel times based on private and public transport. The tool is based entirely on open transport data and open-source travel planning tools, and allows for “what-if” scenario modelling from multiple locations to multiple destinations, single location to multiple destinations and the other way around. Choropleth and isochrone visualisations are used to distinguish areas based on several criteria. A case study is demonstrated where the tool assesses the access to sports venues from different areas in Cardiff. This tool can help the Welsh Government feed some of the WIMD measurements and allow for more frequent and up-to-date calculations based on the latest public and private transport information. With further development, the tool could help other teams within the Welsh Government, such as Valleys Taskforce, South Wales Metro and Cadw, to draw insights, support their policies and plan for future actions. The tool is available as an R package called propeR.
Creating transport data feeds
The tool developed for this project relies entirely on open-source data coming from different sources and in various formats. Data for car, bicycle, on-foot, bus and train travel is combined to build different scenarios and possible routes from multiple origins to multiple destinations. This can be performed for geographical areas in Middle layer Super Output Area (MSOA) or Lower layer Super Output Area (LSOA) level and specific services.
The car, bicycle and foot travel information are provided from OpenStreetMap (OSM), which is built by a community of mappers all over the world. The UK nationwide bus schedules and related data are provided in TransXChange format from the Department for Transport. The train data are provided in Common Interface Format (CIF) from Network Rail, filtered to include only passenger train services.
The different nature of the data formats and the difficulty of combining them under a common tool, implied that we had to convert them to a more usable format. A common and very popular type of transport data is the General Transit Feed Specification (GTFS) as used by Google to draw directions and calculate travel times in their maps applications. A typical GTFS folder contains the text files described in Table 1. In general, they contain information about the service operator, stops, routes, timetables, times between journeys, fares and other travel related information.
Table 1: Contents of a General Transit Feed Specification folder
| Filename | Description |
| agency.txt | Information about each service operator |
| stops.txt | Information about each stop |
| routes.txt | Information about the route |
| trips.txt | Information about each trip on a route and service |
| stops_times.txt | The start and end times for stops on a journey |
| calendar.txt | The start and end dates of journeys |
| calendar_dates.txt | Shows exceptions for journeys for holidays etc |
| fare_attributes.txt | Information about journey fares |
| fare_rules.txt | Assigns fares to certain journeys |
| transfers.txt | Transfer type and time between stops |
However, as far as we know, in the UK only Manchester and London have open-source GTFS feeds. Therefore, our first task was to convert these formats to the more usable GTFS format. A complete guide on how to convert both TransXChange and CIF formats to GTFS can be found in the graphite GitHub repository. Once the conversion is successful, the new GTFS files for buses and trains need to be cleaned and pre-processed to remove any unwanted information that will cause issues when the transport network is built later. This can be easily performed from the clean GTFS built-in function in the package.
Building a transport network
Once all our data files are converted to GTFS format, we can use an open-source route planner, like the OpenTripPlanner (OTP), to build a transport network and perform the calculations we need. The OTP is getting all the information about private transport (car, bicycle, foot) from OSM and the GTFS files provide all the information about public transport (bus, train). A detailed walkthrough on how to build a graph based on OSM and custom GTFS data, and then initiate an OTP local server, can be found in the Campus’ graphite GitHub repository. Once the OTP server is up and running, we can see the front-end on our browser, as shown in Figure 1, to ensure that it is running correctly and contains all transport information.
Figure 1: Multimodal trip planning using OpenTripPlanner
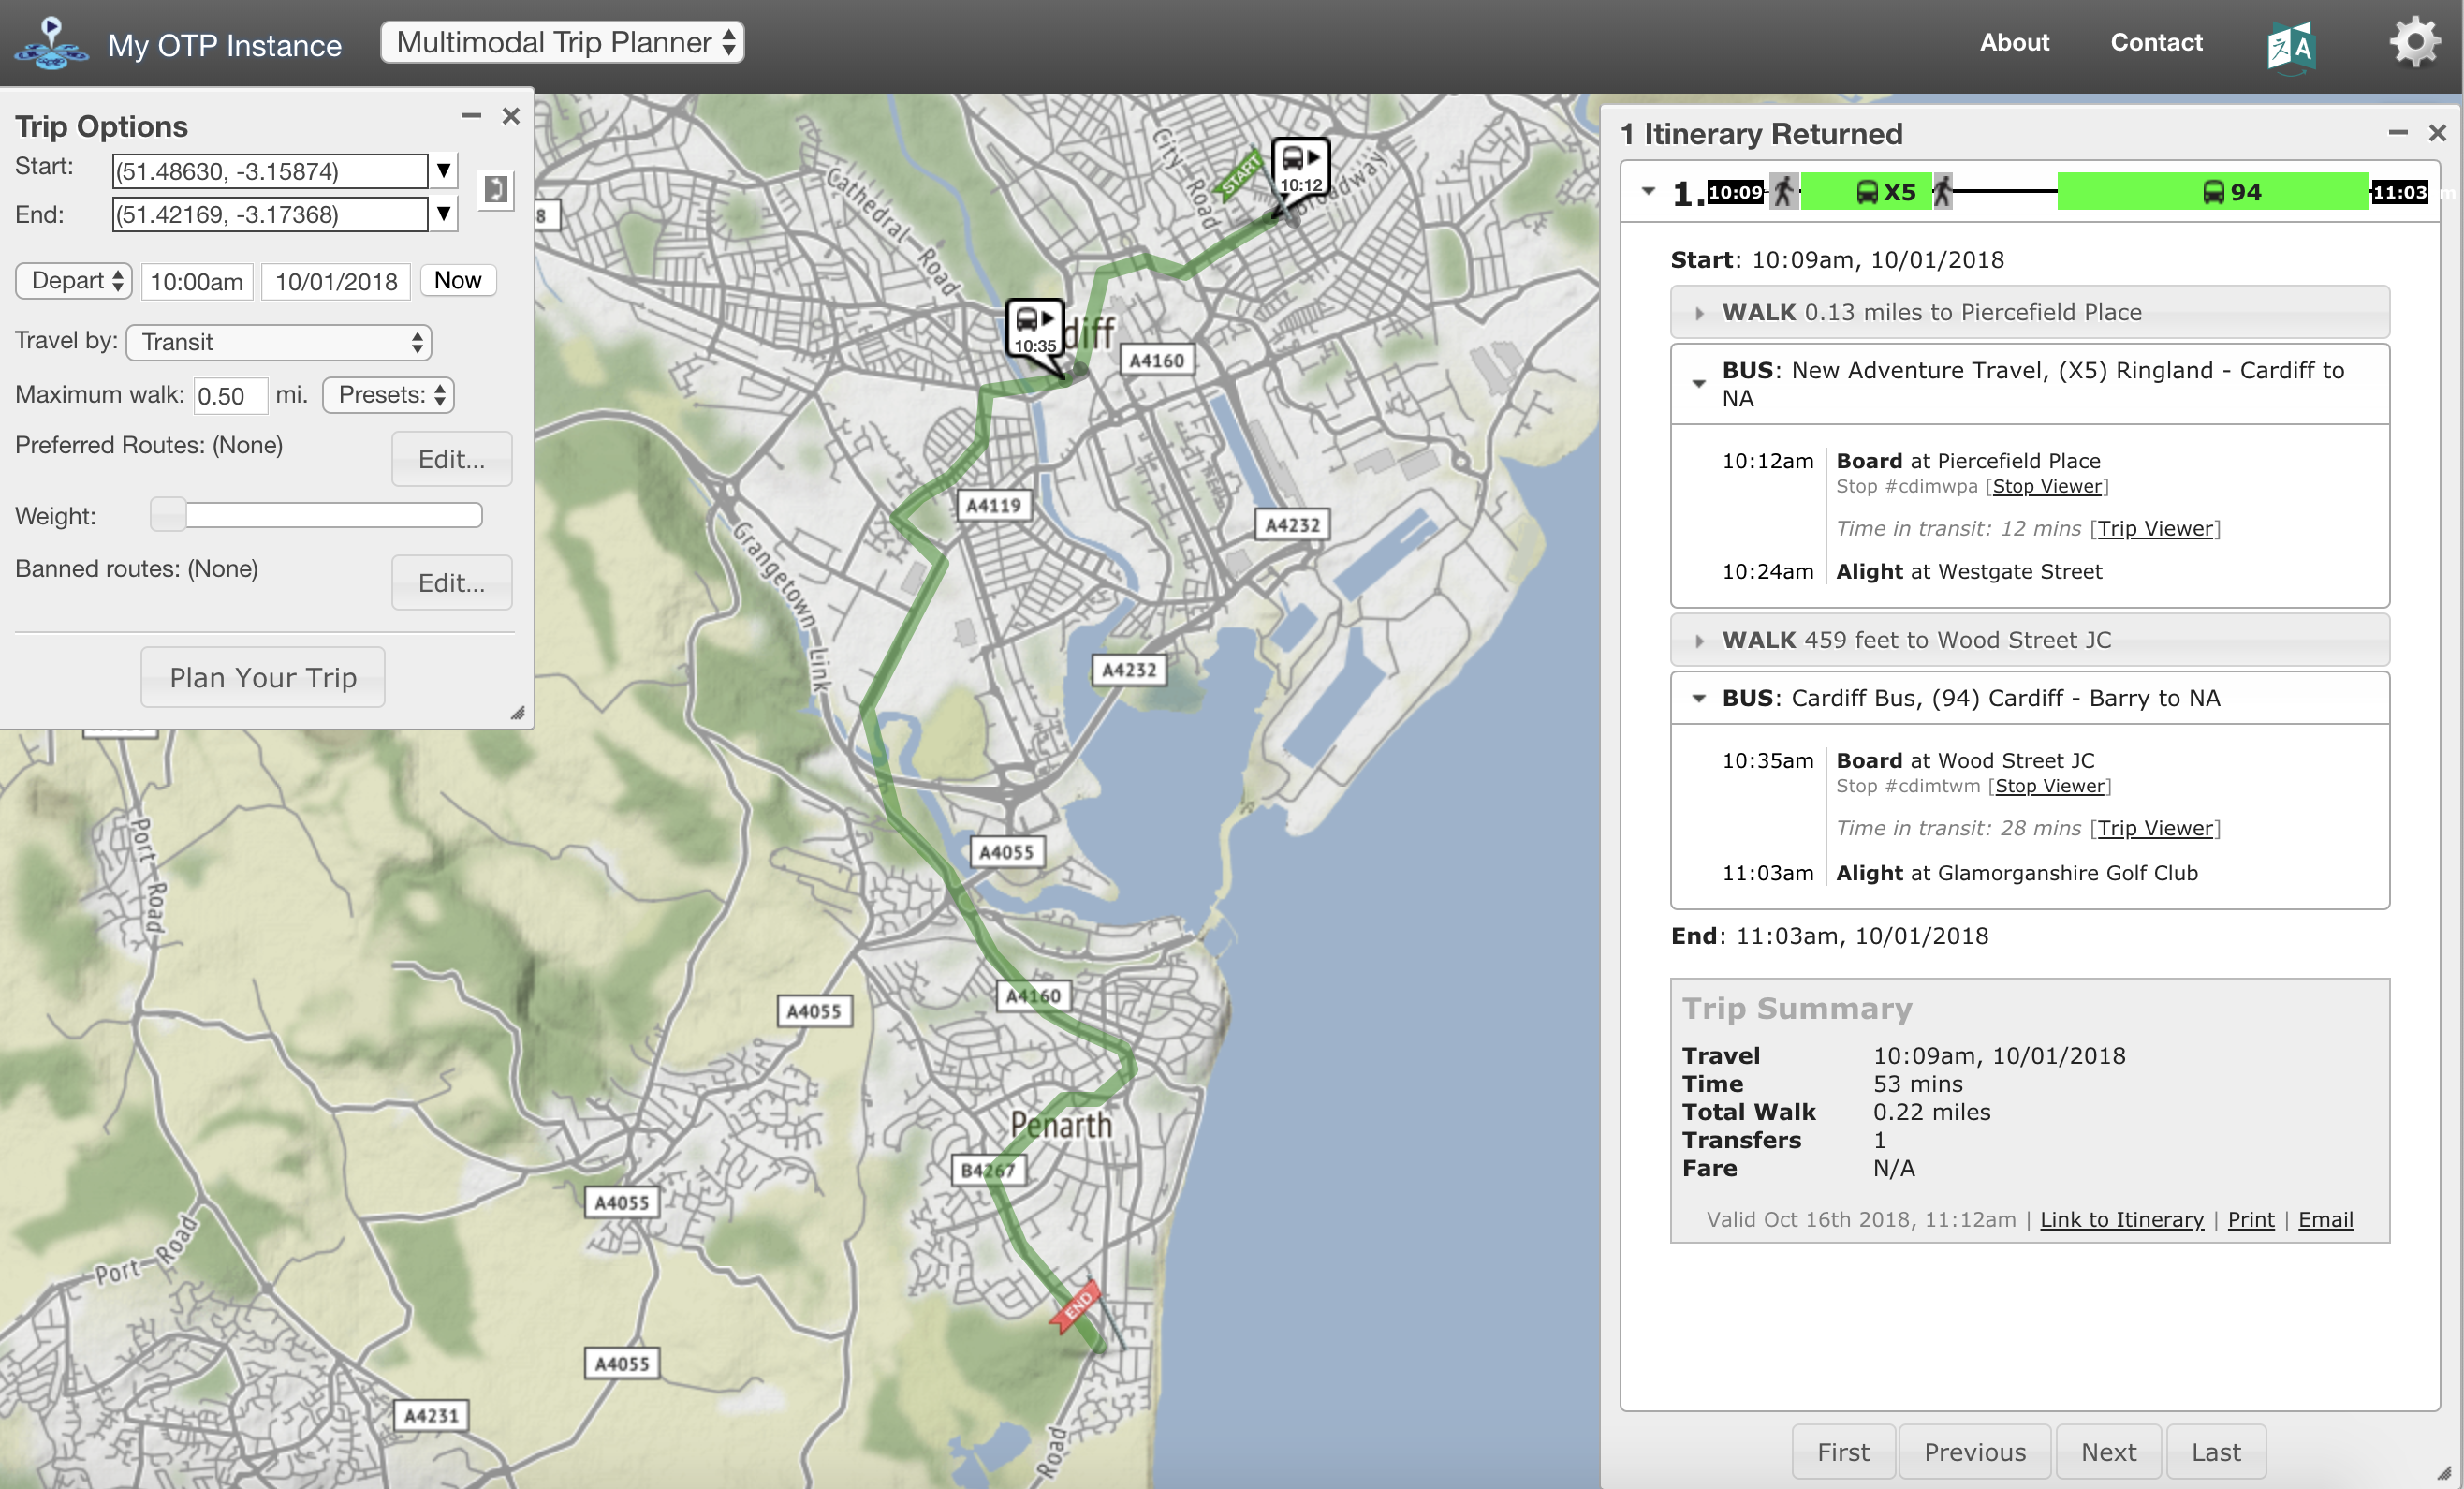
The user can choose the origin and destination from the map or insert the longitudes and latitudes. In addition, different modes of travel can be chosen, along with how long the user is willing to walk between possible travel modes or stops. It then provides detailed route information based on the details contained in the GTFS files. The propeR package takes advantage of the OTP Analyst, to send queries to the OTP and extract information about the route.
Travel measurements using propeR
Once all the data are converted into GTFS format and the OTP server is initiated using the correct graph, the propeR functions can be used to query the OTP analyst, extract travel insights and create informative visualisations.
The main function pointToPoint performs a single query to the server and produces journey details for a trip with a single origin and destination. These include the start and end time of the trip, duration, walk time, transit time between stops or modes of travel, waiting time and total transfers. An extension to this function is the pointToPointTime function that, instead of a single query, performs multiple queries over a defined period. This gives the ability to investigate the travel conditions between two points during different times of the day and create daily, monthly or yearly aggregated figures.
Figure 2: Point-to-point travel plan over time using the pointToPointTime function from propeR
An example of the travel information from Cardiff 008A LSOA in Cyncoed to Cardiff City Stadium on 1 October 2018 between 15:00 and 19:00 is illustrated in Figure 2. It is clear that the suggested trip from OTP changes depending on the time of the day, and the route, duration, walking time and number of transfers can be different. This implies that, when considering the ability to access specific services, the time element needs to be taken into consideration and a single value might not be adequate.
The propeR package offers numerous functions that produce informative isochrone or choropleth visualisations. Isochrones are often used in transportation planning to describe areas with equal travel times. They take a single origin and compute the maximum distance from this origin within specified cut-off times. This means that the travel time from a single LSOA to multiple destinations can be analysed through a single OTP call, defined by specific criteria about the journey.
Figure 3: Isochrone from single origin to multiple destinations using the isochrone function
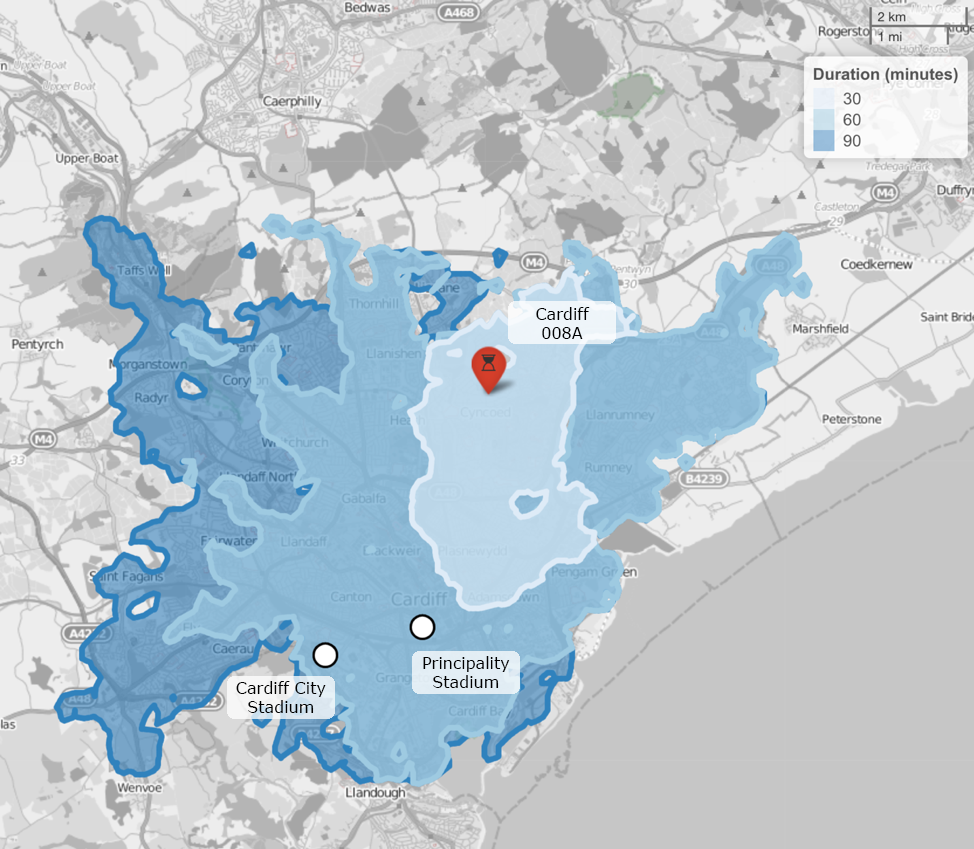
An example of the isochrone function in Figure 3 shows how far people from the Cardiff 008A LSOA can reach by combining walking and using public transport. Cut-off times of 30, 60 and 90 minutes are used. If we would like to examine if people from that LSOA can reach any of the Principality or Cardiff City Stadiums, we can see that in 30 minutes they would not be able to access any, but they would be able to access both between 30 and 60 minutes.
The isochroneMulti function works similarly to the isochrone function; however, it can handle multiple origins and multiple destinations. This is useful when considering the travel time between multiple locations to multiple possible destinations.
Figure 4: Isochrone from multiple origins to multiple destinations using the isochroneMulti function
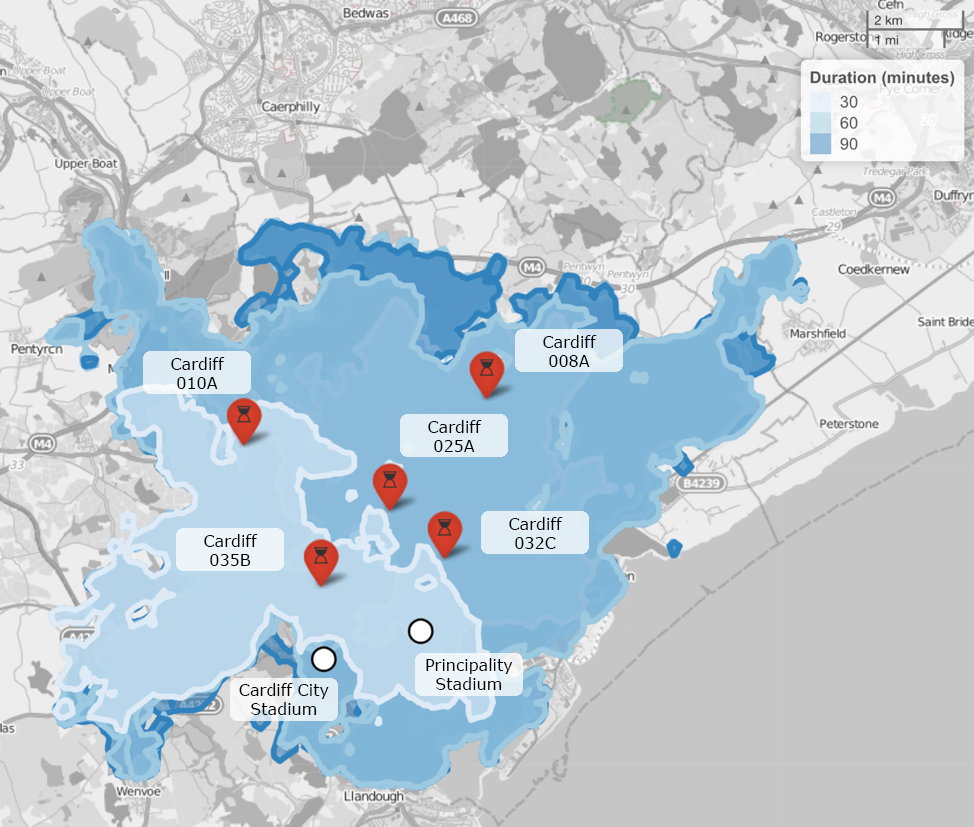
For example, using a sample data of five LSOAs in Cardiff, we can show the travel time from these areas to the two main sports venues (the Principality Stadium and Cardiff City Stadium) in Cardiff. The isochrones show that Cardiff City Stadium cannot be reached in less than 30 minutes from any of the LSOAs, while it can be reached from all between 30 and 60 minutes.
On the other hand, the Principality Stadium can be reached in less than or equal to 30 minutes from two LSOAs (Cardiff 025A and Cardiff 035B) and between 30 and 60 minutes from the other three LSOAs (Cardiff 008A, Cardiff 010A and Cardiff 032C).
The propeR package contains several other versions of the isochrone function that can be used to draw useful information.
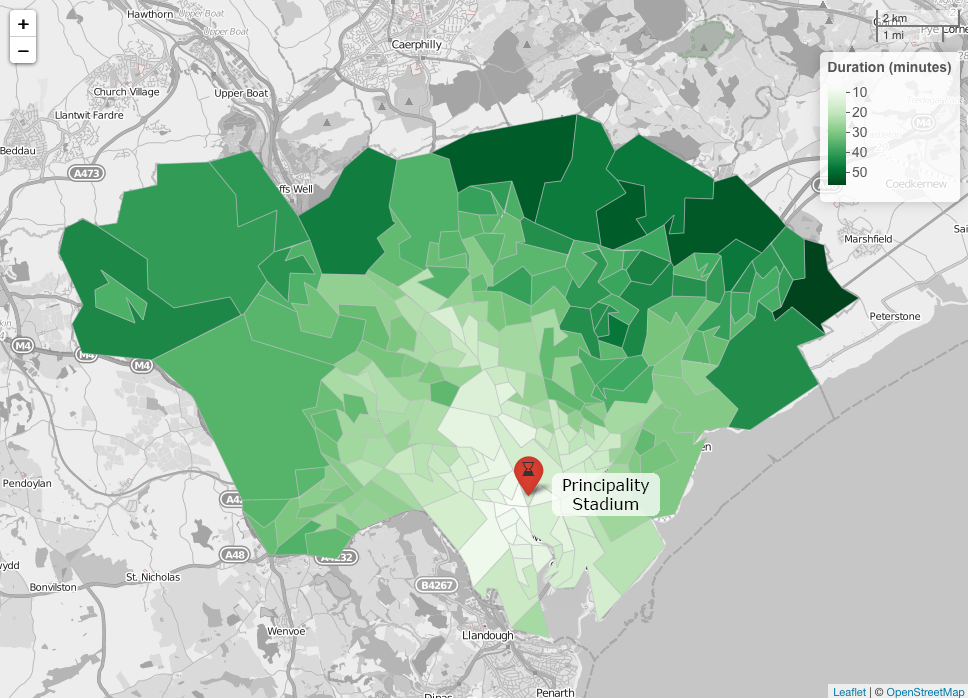
The choropleth function creates a number of OTP API calls for multiple origins to a single destination. It then uses a GeoJSON file to create polygons and colour them based on the journey details calculated. Figure 5 shows a choropleth for all the Cardiff LSOAs and the Principality Stadium. Cut-off times of 10 to 60 minutes with 10-minute intervals were used. Even though travel times in general increase when we move away from the stadium, interestingly, we can see that some of the distant LSOAs have shorter travel times than ones that are closer to the stadium. This can be due to the lower number of transfers, shorter walking distances or shorter waiting times.
Figure 5: Choropleth showing travel duration bands from all Cardiff Lower layer Super Output Areas to the Principality Stadium using the choropleth function
Case study
The multi-modal transport system can be used to evaluate complex social and service accessibility problems for policymakers by combining the three functions (point-to-point, isochrone and choropleth) described in previous sections. To demonstrate the flexibility and scalability of this system, a simple case study is used. “How many people in Wales can reach a sport venue with a capacity greater than 10,000 seats, within 90 minutes using public transport?”
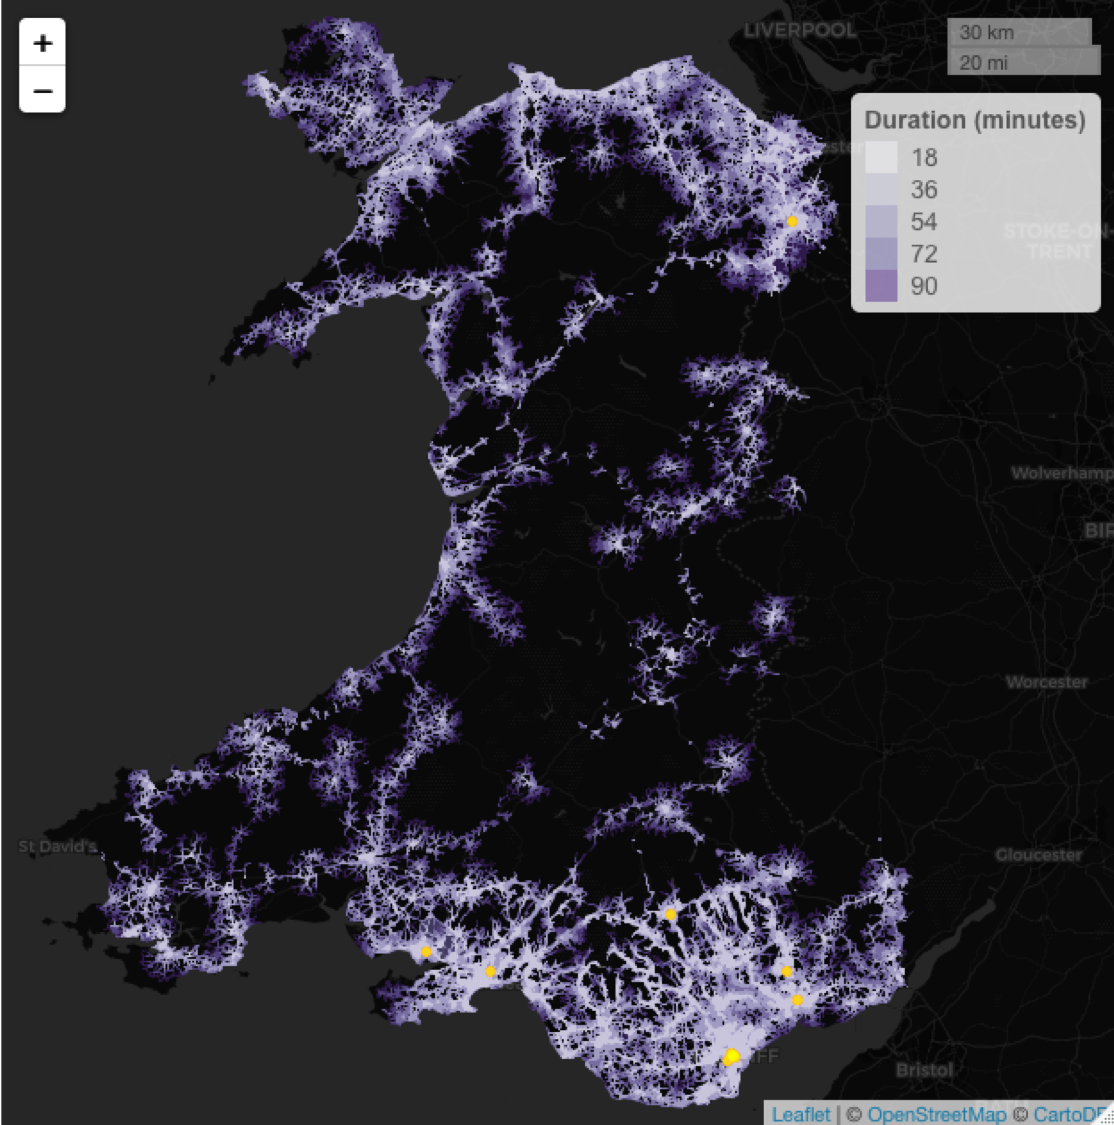
In this example, first we use the population estimates for MSOAs in Wales, published by Office for National Statistics (ONS), the MSOA centroids and the isochrone function of propeR. The isochrone for the entire country can be seen in Figure 6, with travel times from 0 to 90 minutes with intervals of 18 minutes. In Wales, there are 10 sports venues with capacity greater than 10,000 seats and the majority are in the south.
Figure 6: Isochrone for Middle layer Super Output Areas in Wales to the 10 sports venues with capacity greater than 10,000 seats
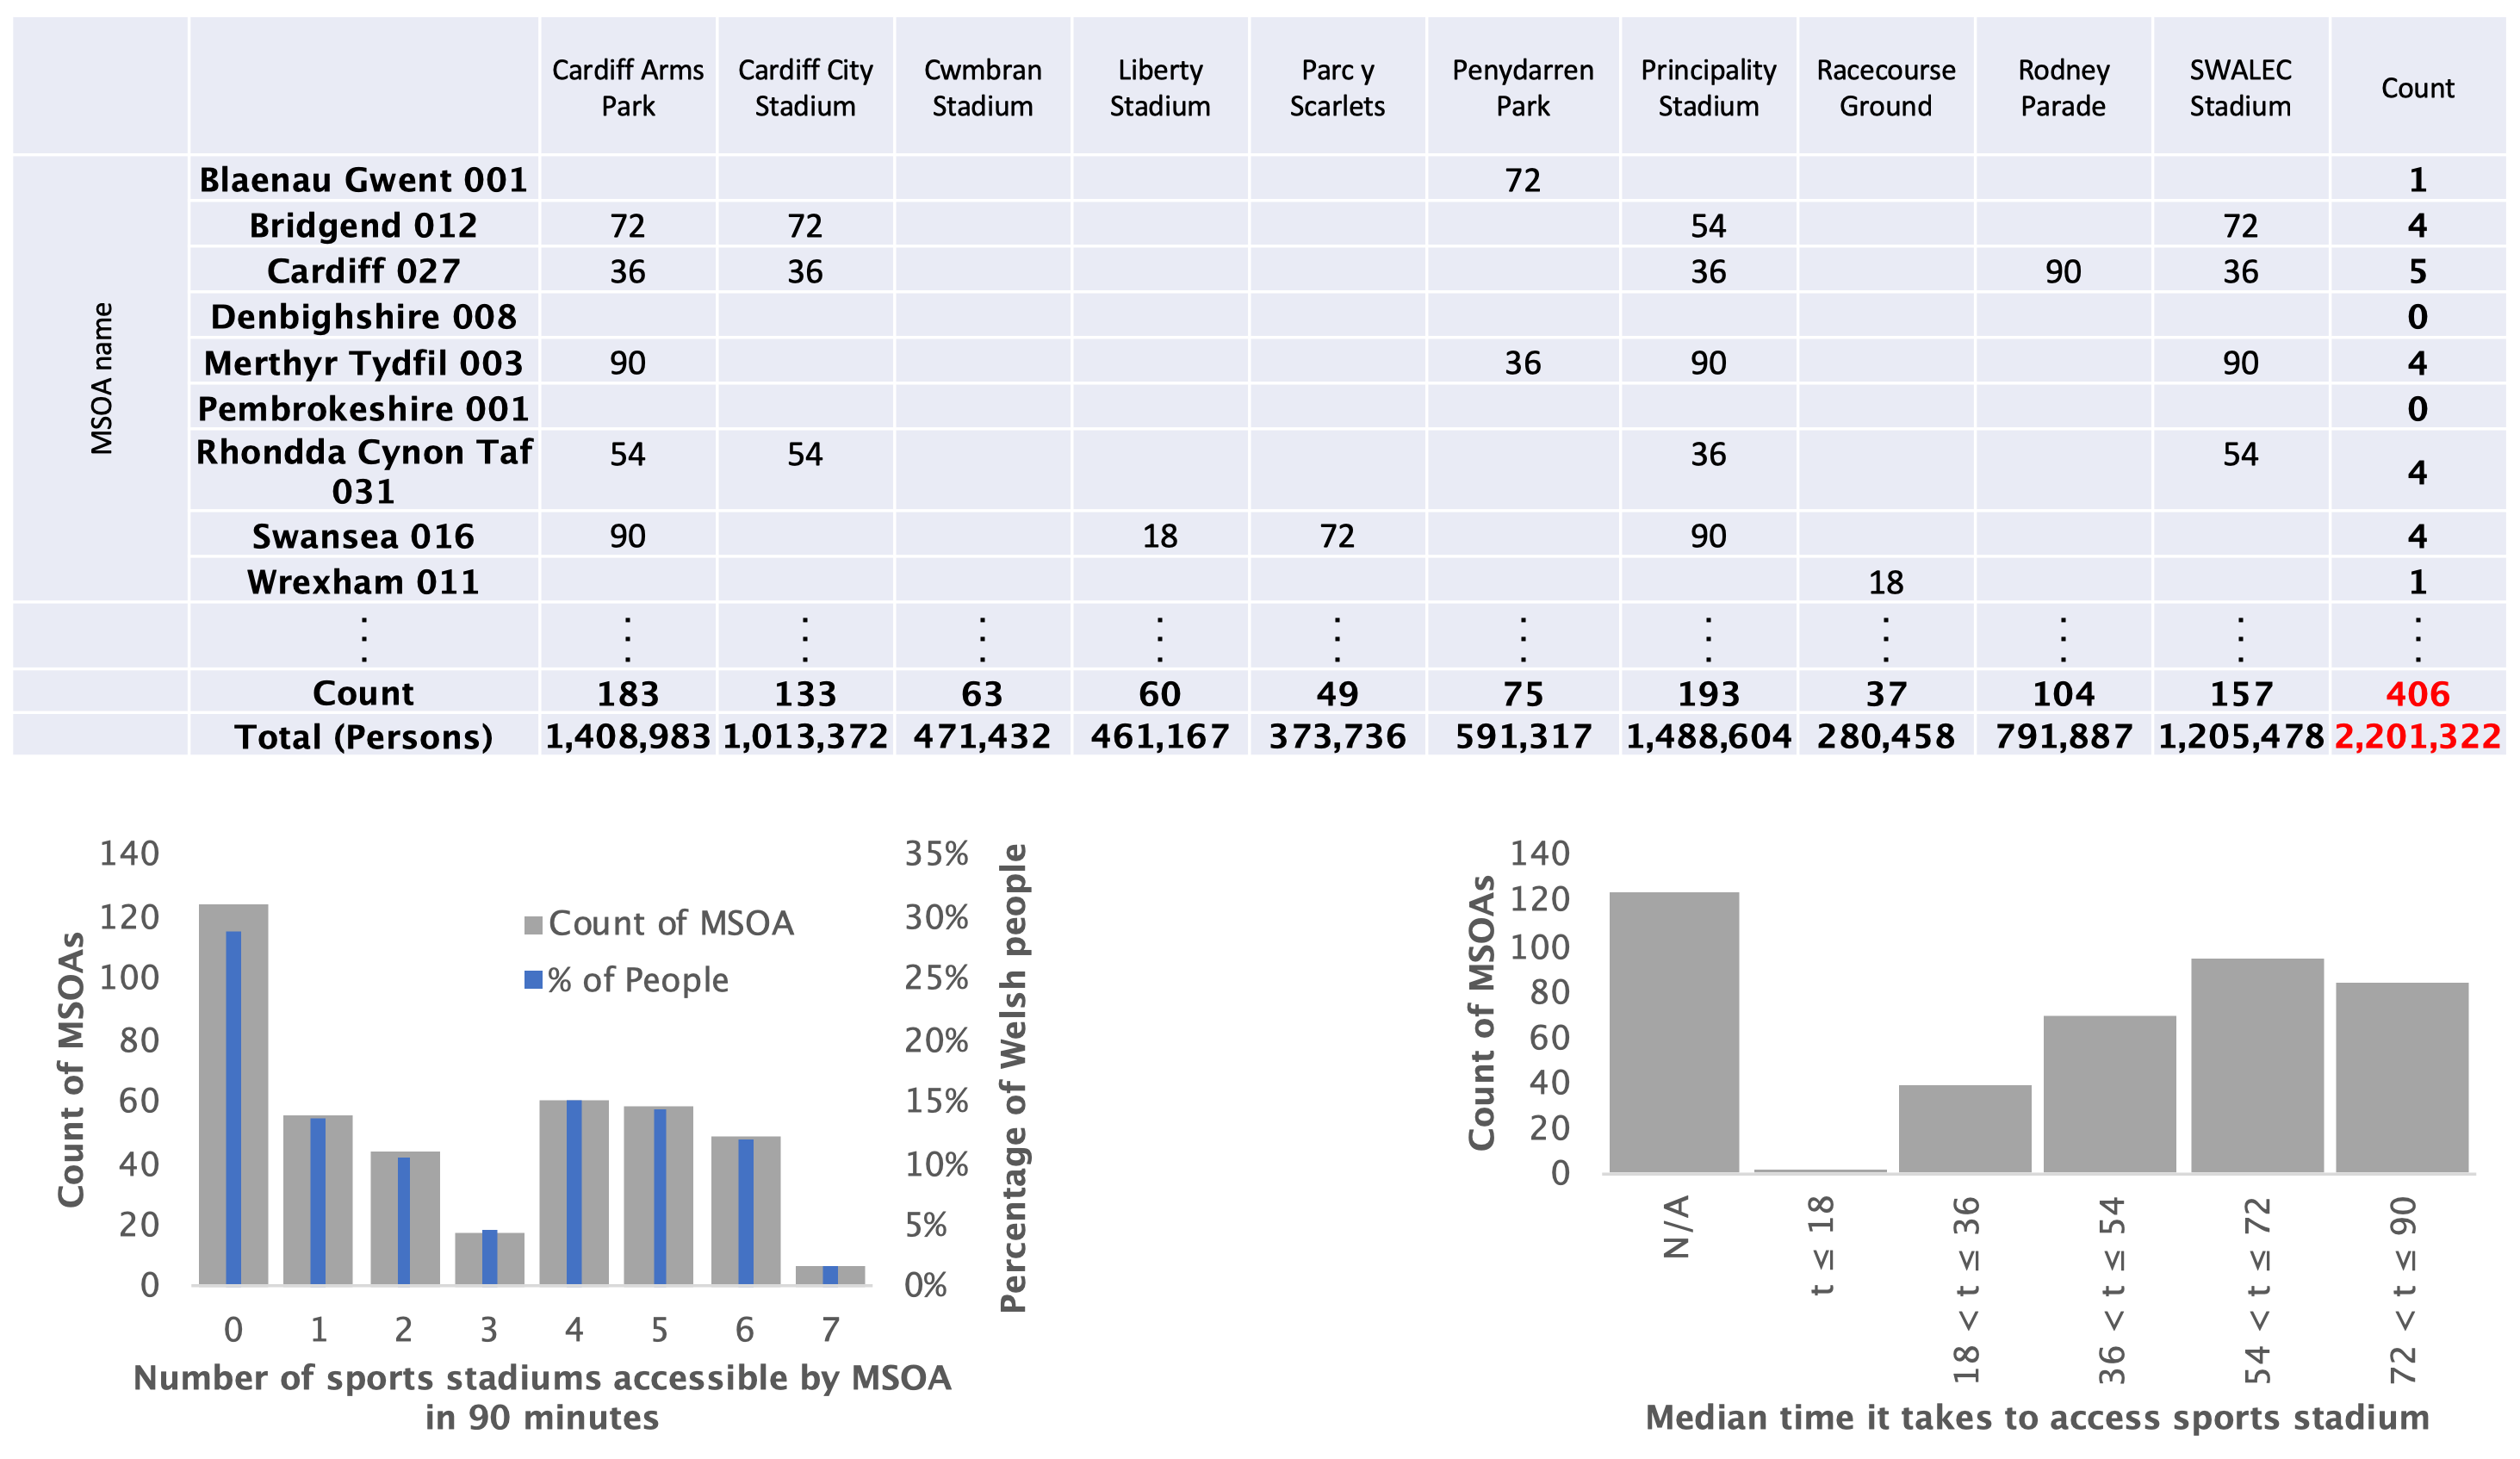
From the isochrone we can easily extract which MSOA can access which sports venues and in what time window, as seen in the top table in Figure 7. There are cases where a single MSOA has access to several sports venues in less than 90 minutes, but there are more than 120 out of 406 MSOAs that do not have access to such a venue in less than 90 minutes, as seen in bottom left bar chart in Figure 7. Only a very small number of MSOAs can access the venues in less than 18 minutes, while the majority need more than an hour to access the venues, as seen in the bottom right bar chart in Figure 7.
When adding the population estimates of the MSOAs that have access to at least one sports venue with capacity greater than 10,000 and in less than 90 minutes, we can see that around 2.2 million people in Wales have that privilege. Similar scenarios can be easily replicated for other geographical boundaries and services by changing the origins and destinations files.
Figure 7: Linking the information from propeR with the population estimates
Summary and future work
The Data Science Campus worked together with the Welsh Government to develop a tool that uses open private and public transport data and the OpenTripPlanner (OTP) open-source route planner to build a transport network and perform travel estimates. The propeR R package is a fully parameterised tool, it responds to various permutations of criteria, and gives the respective calculations and visualisations with regards to the parameters chosen by the users to fully exercise different “what-if” scenarios. A complete pipeline for gathering the public transport data, converting it to General Transit Feed Specification (GTFS) format, cleaning it, setting up an OTP server and performing calls to it using the propeR package has been established and tested for different such scenarios.
We believe that our tool will be able to benefit a number of Welsh Government projects. The Welsh Index of Multiple Deprivation (WIMD) will benefit from more precise and accurate calculations for “service accessibility” (more control over parameters) and increase the frequency of measurements from four or five years to yearly. With further development, programmes like the Valleys Taskforce could potentially use the tool to look at access to locations of employment/strategic hubs and look at change in future years. The South Wales Metro could calculate a baseline for current heavy rail and bus network, introduce new timetables and stops into GTFS file and compare to baseline. Finally, the Cadw team would be able to measure the access to Cadw properties from tourist accommodations in specific travel times and list the accommodations accessed by public or private transport. The Campus is working closely with these teams to help deliver their current workplan and we will add functionalities following further collaboration.
Acknowledgements
The Data Science Campus wishes to thank the staff at the Welsh Government for their collaboration and support through the course of this project.